
Routing, a monitoring rework, Zabbix, AI agents, scripts, a settings redesign and a terminal console
BGP, OSPF and EVPN in the inventory, checks every 200 ms, a history of every status change, flapping you confirm, Zabbix as an engine, MCP and Ask Danbyte.
0.16.0 is the largest release so far, and this is a long post. The contents above jump to each part, and the release note on GitHub has the short list.
The first half is monitoring. Status changes were already being logged; this release turns that log into something you can hover and click, on every page an address appears, so an incident review starts with when it went down, for how long and who saw it, instead of a table. A second lane runs the checks that matter every 200 ms to 30 s without filling the database. Flapping becomes a state a check is in until a person clears it. And an existing Zabbix can answer for a device, a rack or a whole site through an ordinary check, so alert rules, silences and history work over it unchanged.
The second half is routing. Danbyte now models how a device forwards: static routes, BGP with peer groups and sessions, OSPF, IS-IS, EIGRP, the policy objects they share, and the EVPN/VXLAN overlay, and renders all of it into the device's config template. It is the oldest open request on the tracker.
Then the things that let something other than a browser work with the inventory. Danbyte speaks MCP, so Claude Code, Cursor, VS Code or an agent of your own can ask it questions with an API token's access, and Ask Danbyte is a chat panel that answers about your own network as you and shows every lookup it made. Scripts run Python inside Danbyte as the person who clicks Run. Backups are archives Danbyte takes of itself. And there is one search box, a settings area with one map, and the site's own certificate from Settings. Everything new that reaches outside the box ships off.
Status history you can see
The thing you will notice first. Wherever an address, a device or a check appears, there is now a thin bar drawn over a window to scale: one block per stretch of unchanged status, its width the share of the window it covered. An outage two days ago is a red block two days back. A host that bounced for an hour is a striped patch an hour wide. Grey is time with nothing measured. It shows status only, never latency, and because it is drawn on time rather than on samples a five-minute check and a one-second one look the same.
Hover a block and you get its status, how long it lasted and its start and end on one line. Click it and a card opens with the exact From and To, the change that started the block (from, to, check name, who answered, and the checker's own detail, [Errno 111] Connect call failed ('10.0.0.41', 9990) or loss 0 %), and every alert that was open while it lasted, first eight inline, then a link to all of them.
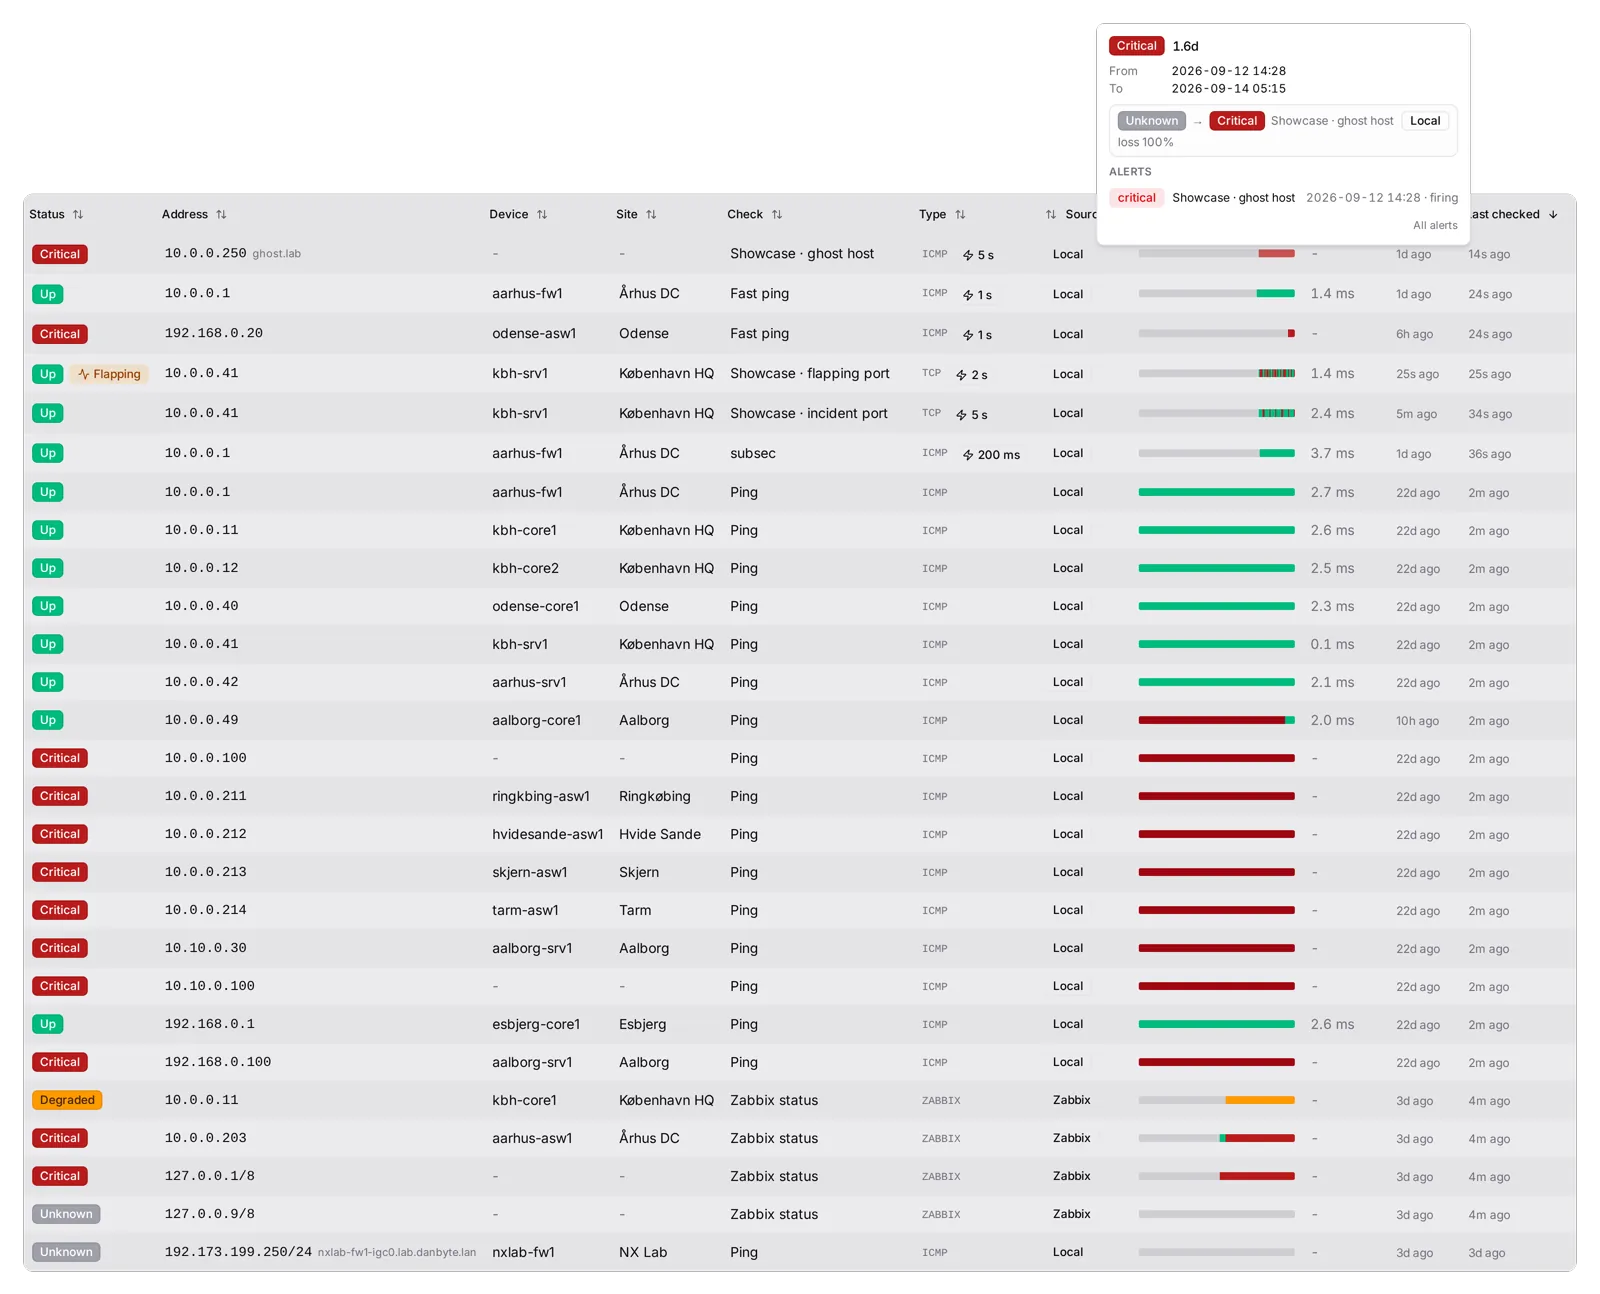
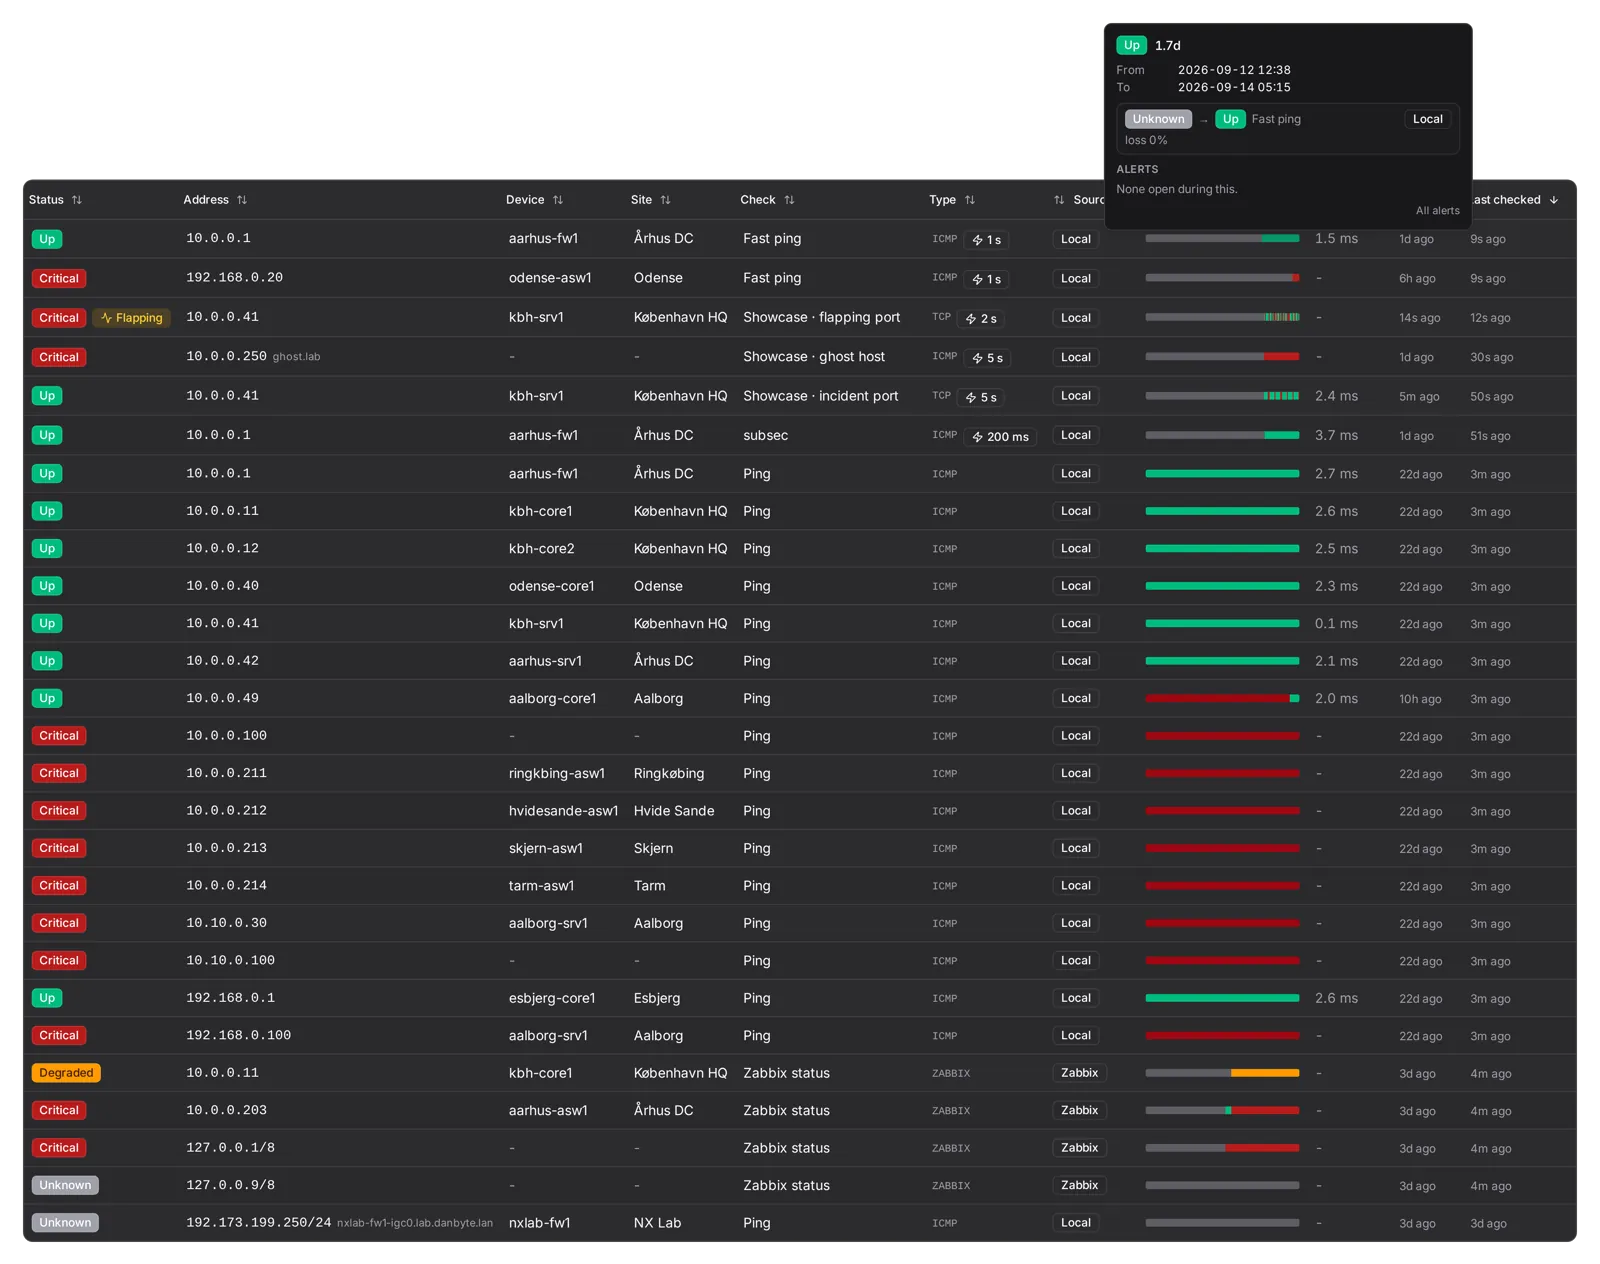 The click card on a 24-second Critical block of the flapping port: the change that opened it, the checker's detail, and the one alert that fired while it lasted. What happened and who was paged, without leaving the list.
The same strip is on the address's Monitoring tab (one per check, seven days), the device's Monitoring tab (one per address), the Checks list with a 7 days switch, the Flapping tab (last 24 hours), the History panel and a dashboard widget. They are all cut from the same status changes, so the strip, the number, the bars and the table cannot disagree.
flowchart LR
  E[Workers, fast lane, Outposts, Zabbix] --> R[Results]
  R --> C[Status changes]
  C --> S[Segments per check and rolled up]
  S --> A[Strips]
  S --> F[Availability figure]
  S --> B[Daily bars]
  C --> T[History table]
  C --> H[Heatmap and most changes]
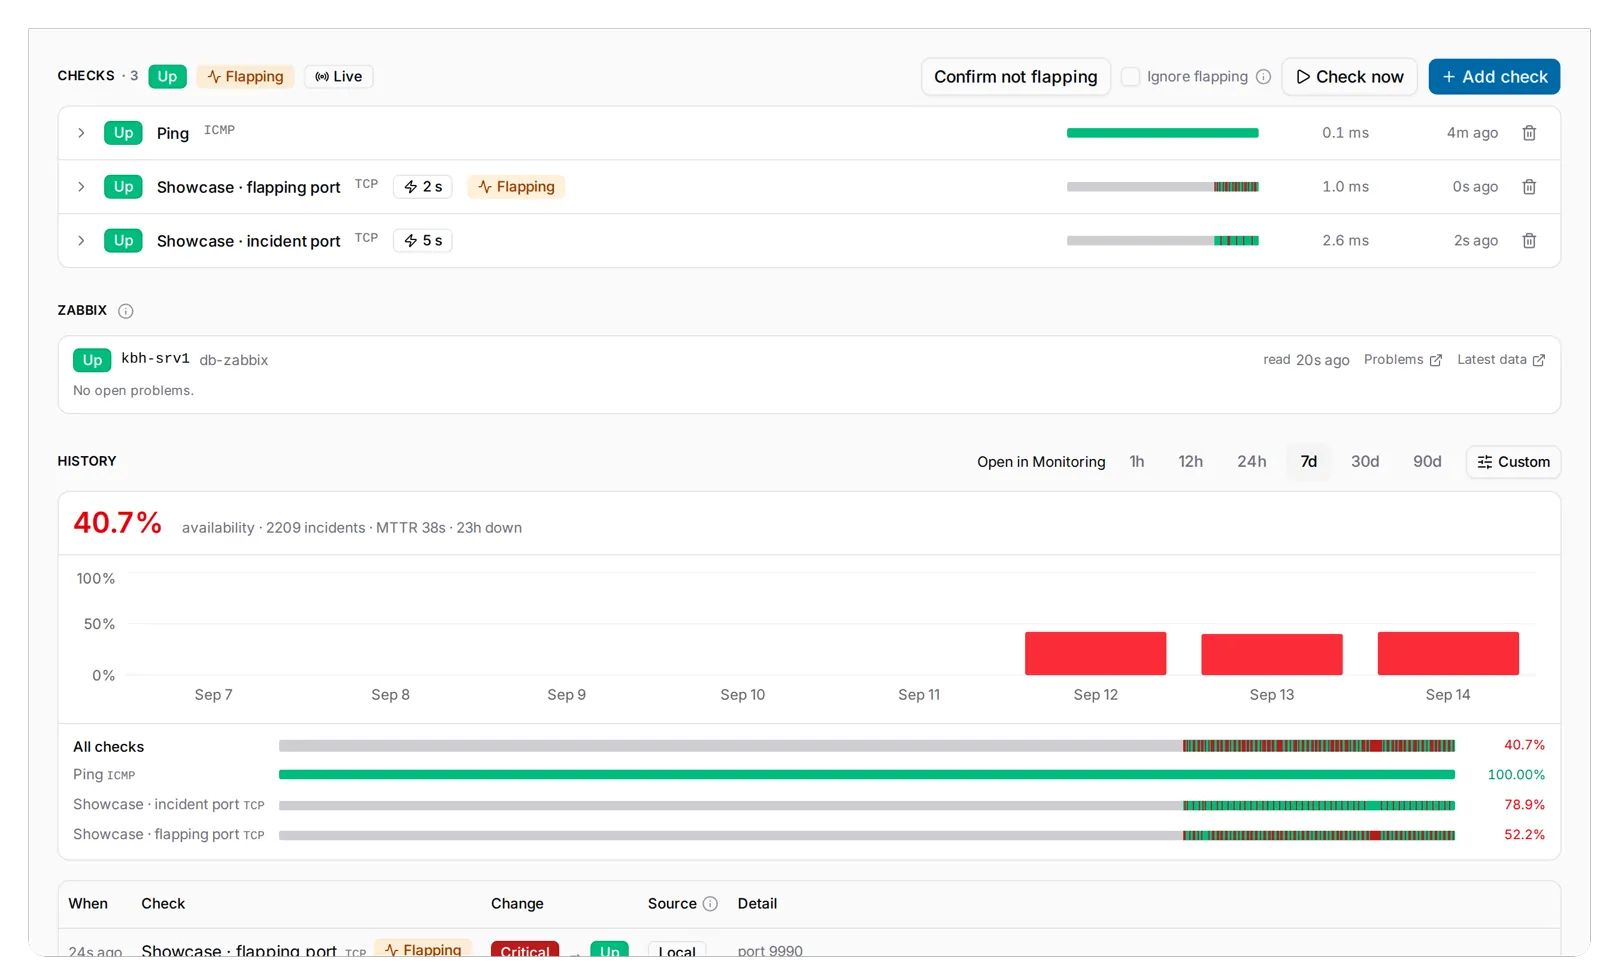
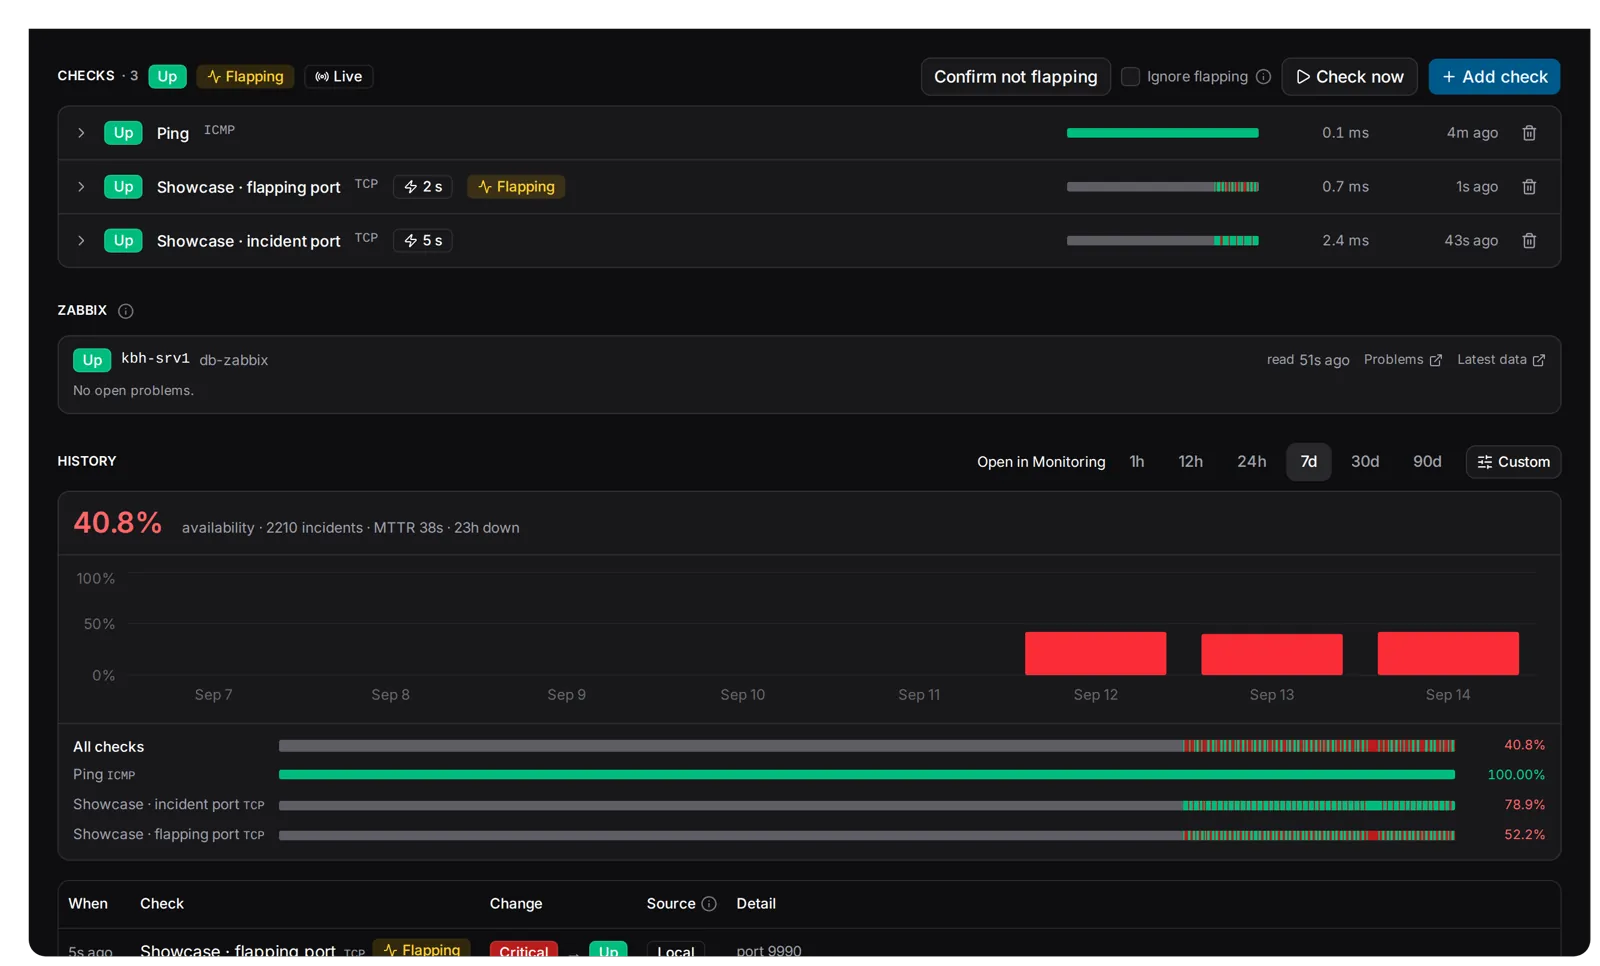
An address's Monitoring tab now reads top to bottom as now, other systems, over time. Checks first, one row per check with its status, a Fast badge if it is on the fast lane, a Flapping pill if it is flagged, the seven-day strip, last latency and a chevron that opens the row. A Zabbix section when the device is a Zabbix host. Then History, which carries the window: 1h, 12h, 24h, 7d, 30d, 90d, or a Custom slider from an hour to a year. The figure is availability in the window with incidents, MTTR and time down, time-weighted from the segments. Unknown and skipped time is excluded, so a check that was not running cannot read as 100 %. Once three or more days in the window were measured, one bar per calendar day appears under it: three nines green, two nines amber, less red. A week that was fine except Tuesday reads as exactly that. Under the bars, the changes themselves, 25 a page, and Open in Monitoring carries the address into the tenant-wide History tab with its filters set.
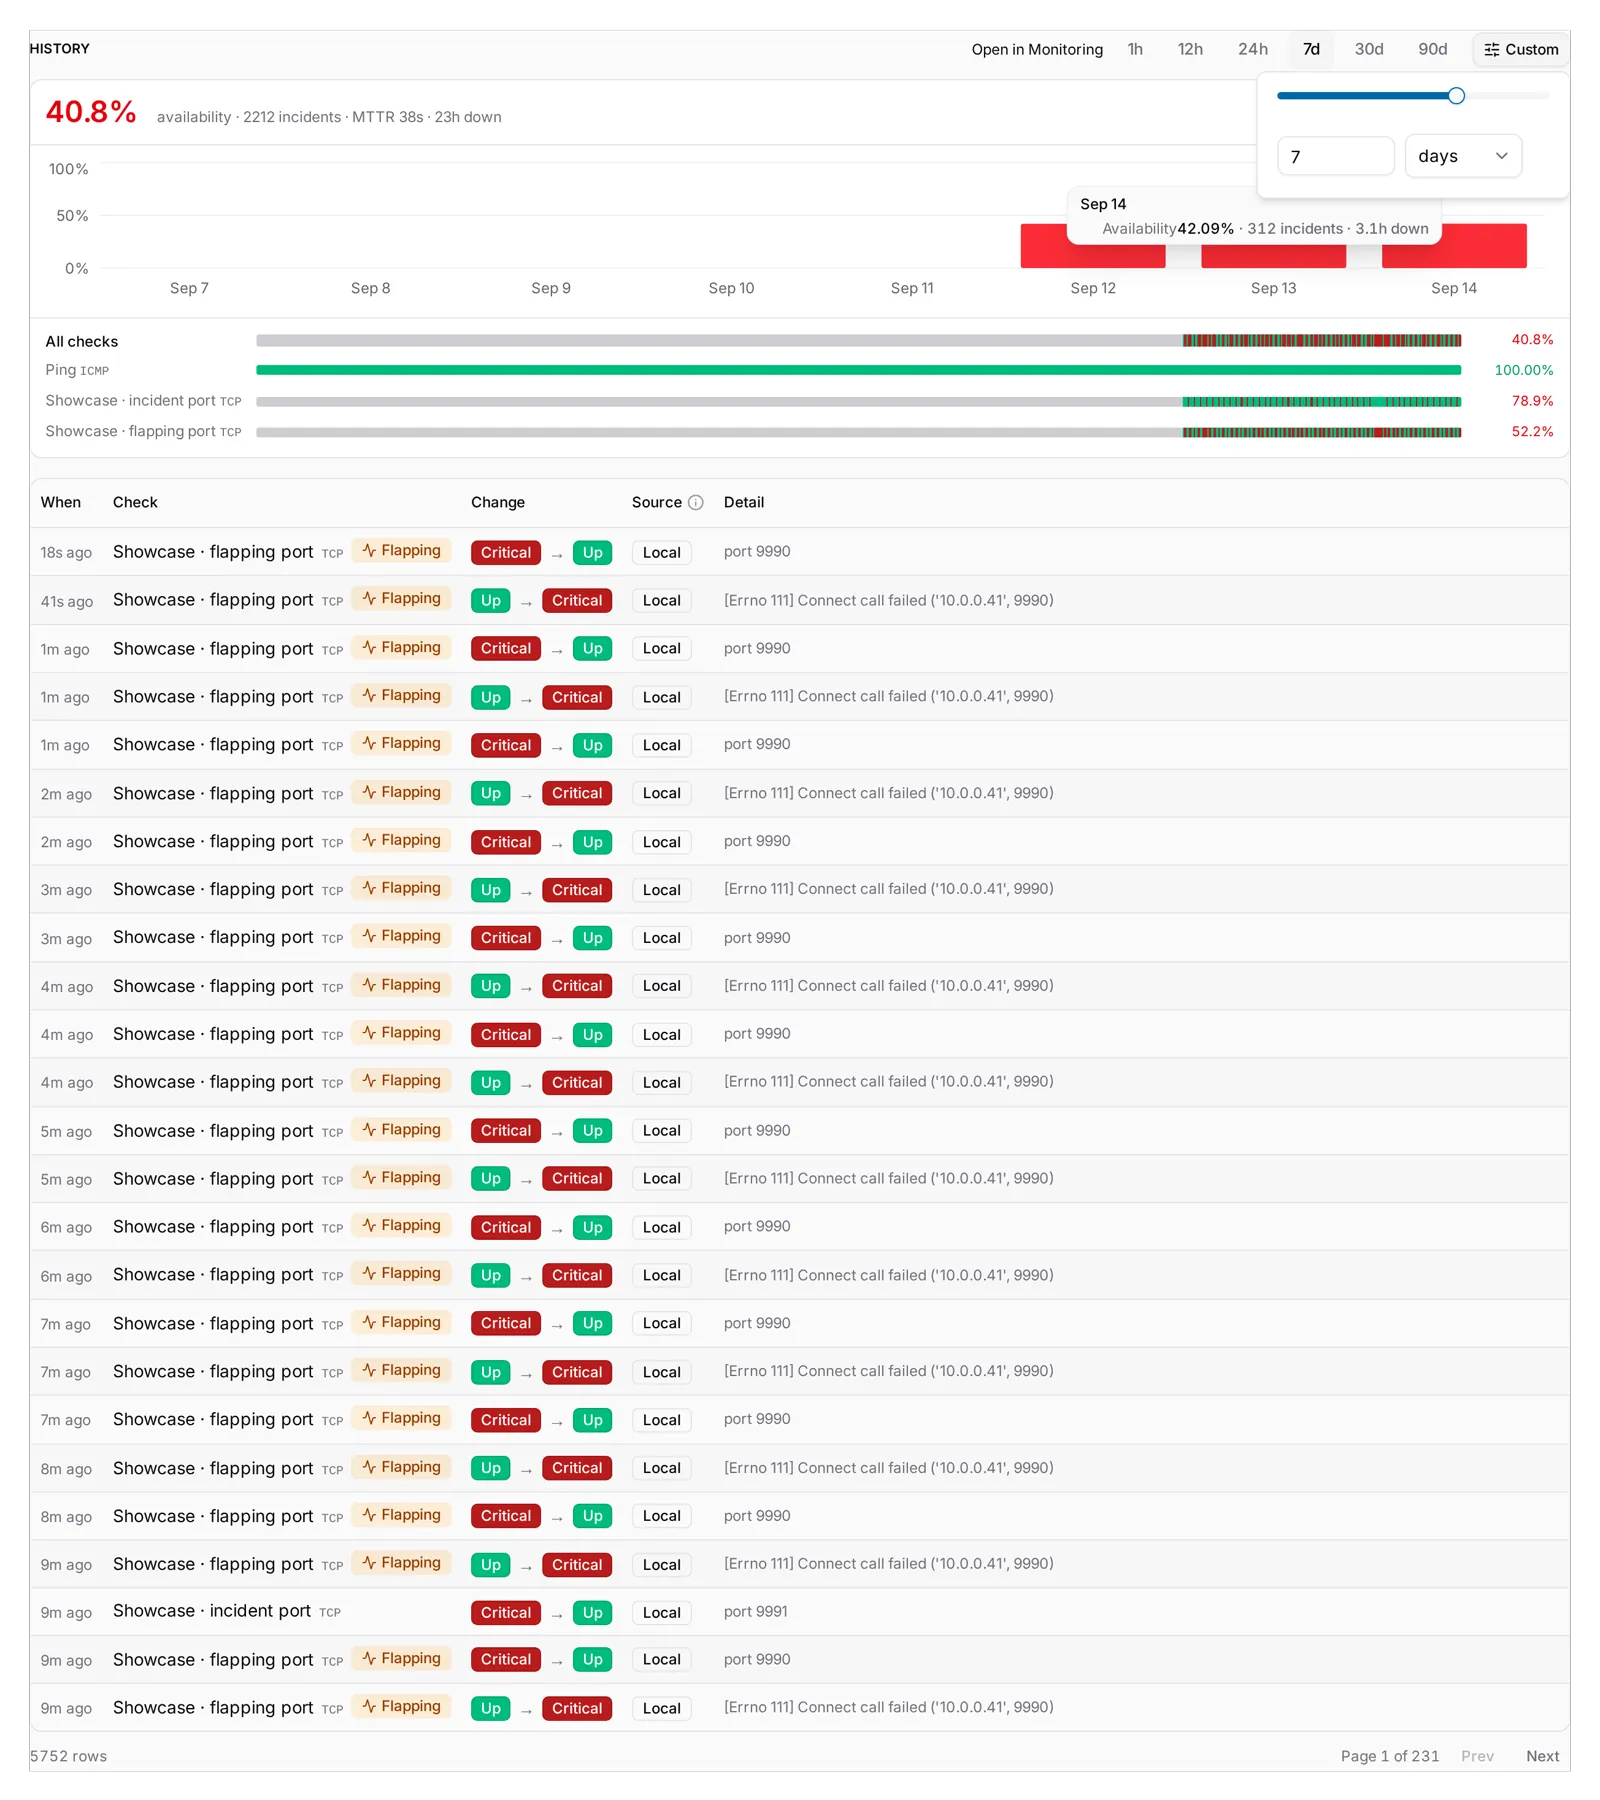 The Custom slider open on 10.0.0.41's History panel, with a tooltip on the Sep 14 bar: 42.29 % availability, 198 incidents, 2.0h down. The three red days are the days the showcase checks existed.
Devices get a Monitoring tab of their own, separate from what the device reports about itself over SNMP (that tab is now called SNMP). It is the roll-up: one row per monitored address with its strip, Confirm not flapping and Notify me for the whole device, the Zabbix panel when there is one, and the same History panel one level up. Checks still attach to addresses; a device that answers on three addresses shows three strips and one figure.
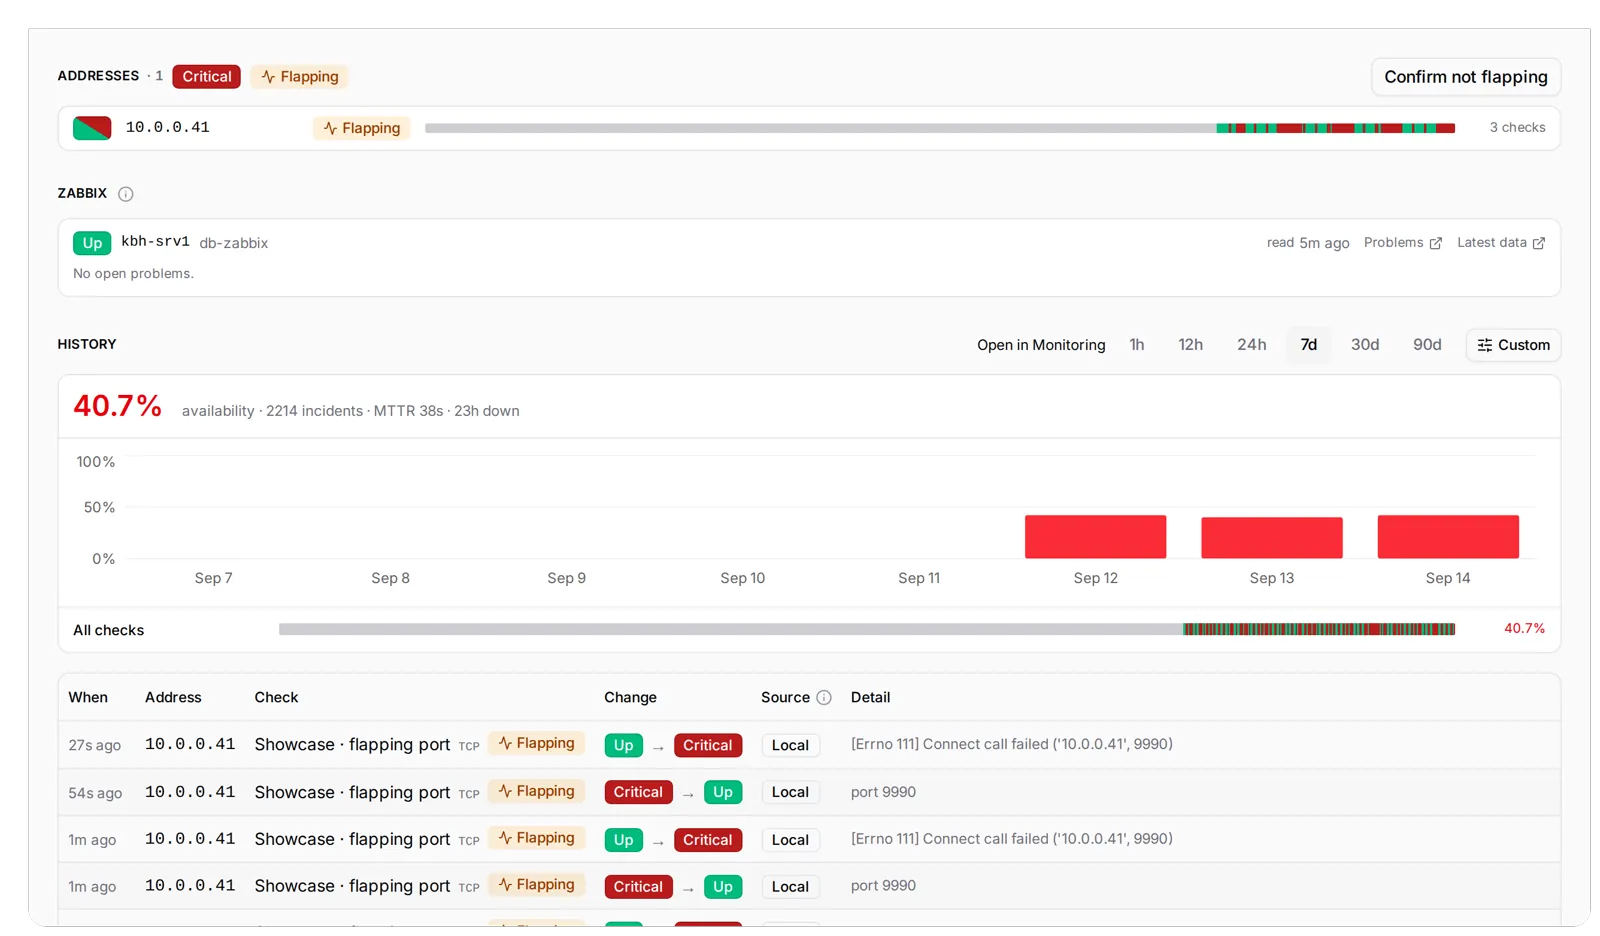
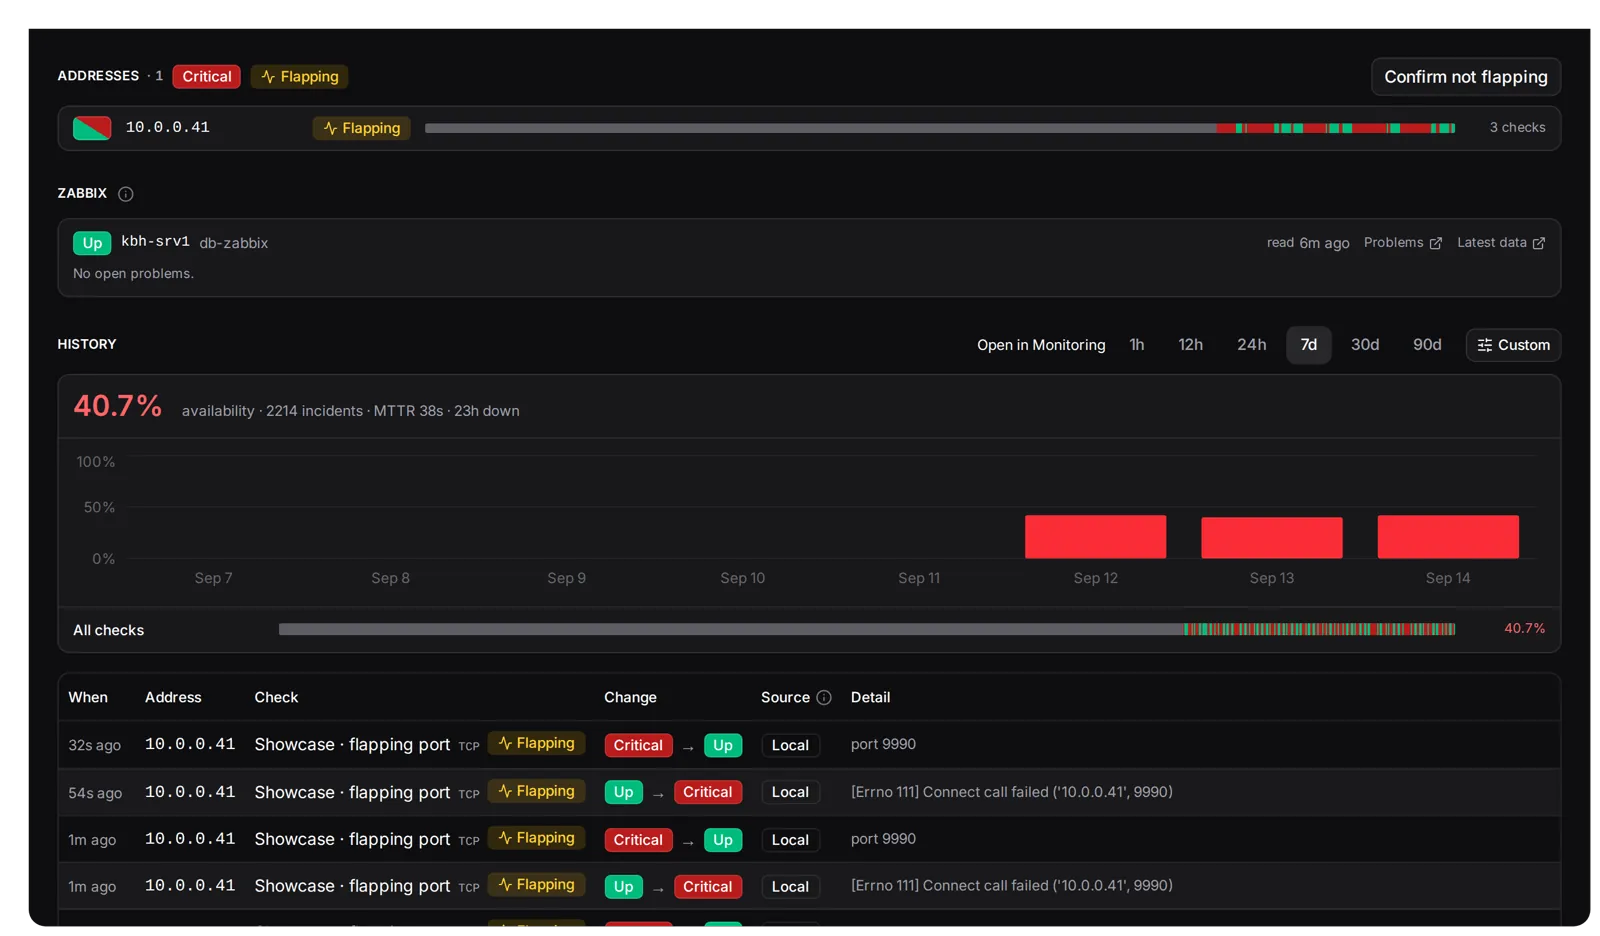 kbh-srv1's Monitoring tab: Addresses · 1 with an Up badge and a Flapping pill, the Zabbix panel reading No open problems, and History at 7d with 40.6 % availability and the changes behind it.
The History tab
Governance, Monitoring, History lists every status change in the tenant. The rail on the left is the one the Checks list has: Status, Flapping, From, Source, Type, Site, Device type, Role, Platform, Check, Engine, plus pickers for Region, Device, Prefix, VRF, VLAN, Tag and Port. Each facet counts what ticking it would leave, computed with every other filter applied, so a second value in one facet never zeroes its neighbours. Above the table, a chart of changes per hour (up to three days) or per day, stacked by state in your own state names and colours. Everything is in the URL, so a filtered view is a link you can paste into a ticket, and saved views keep a rail, a window and a search under a name.
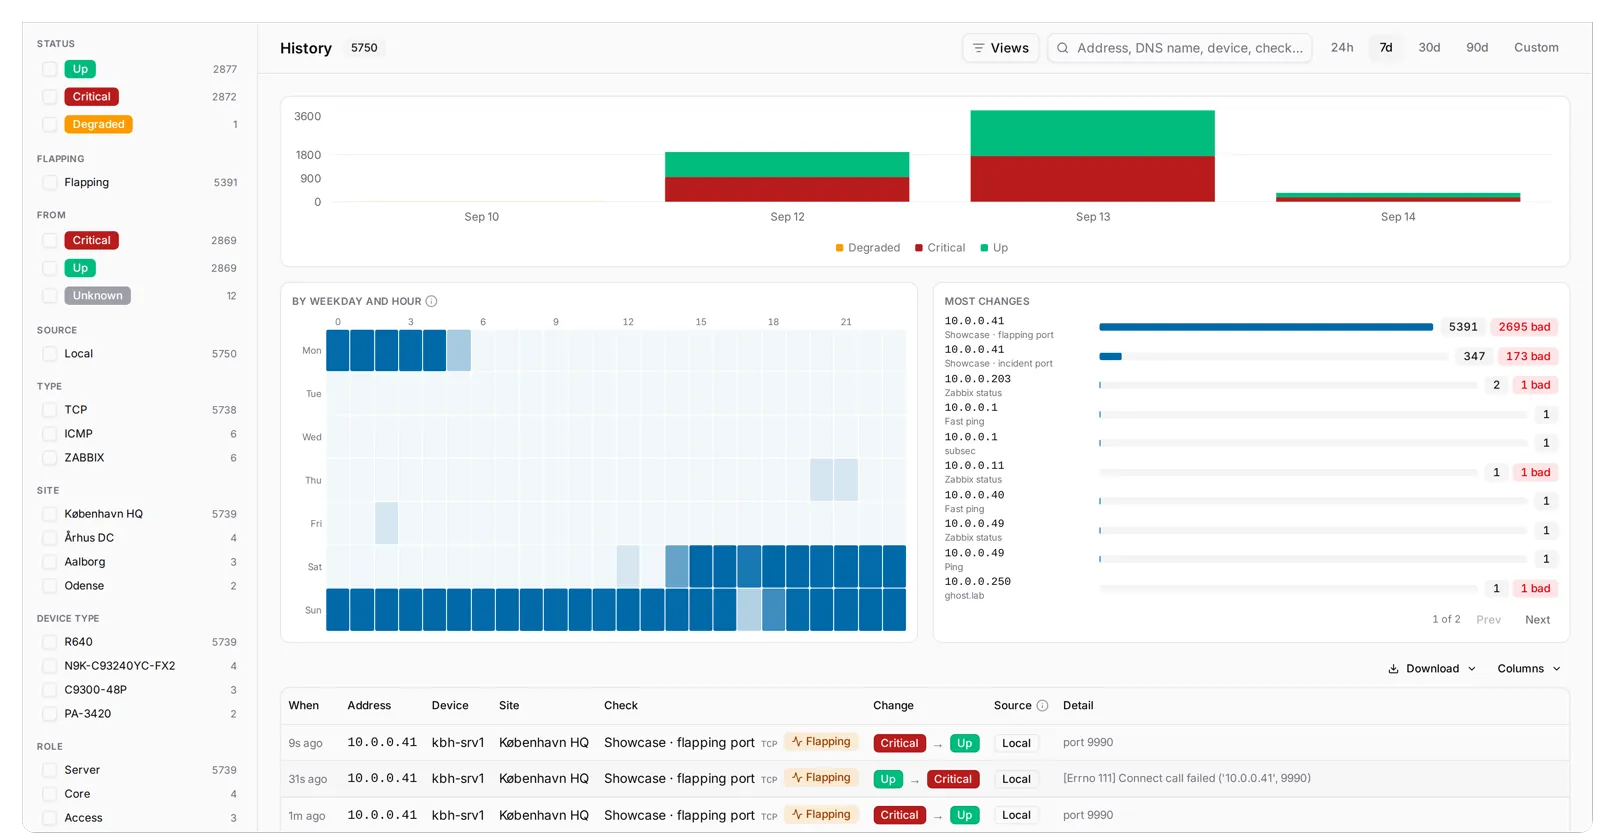
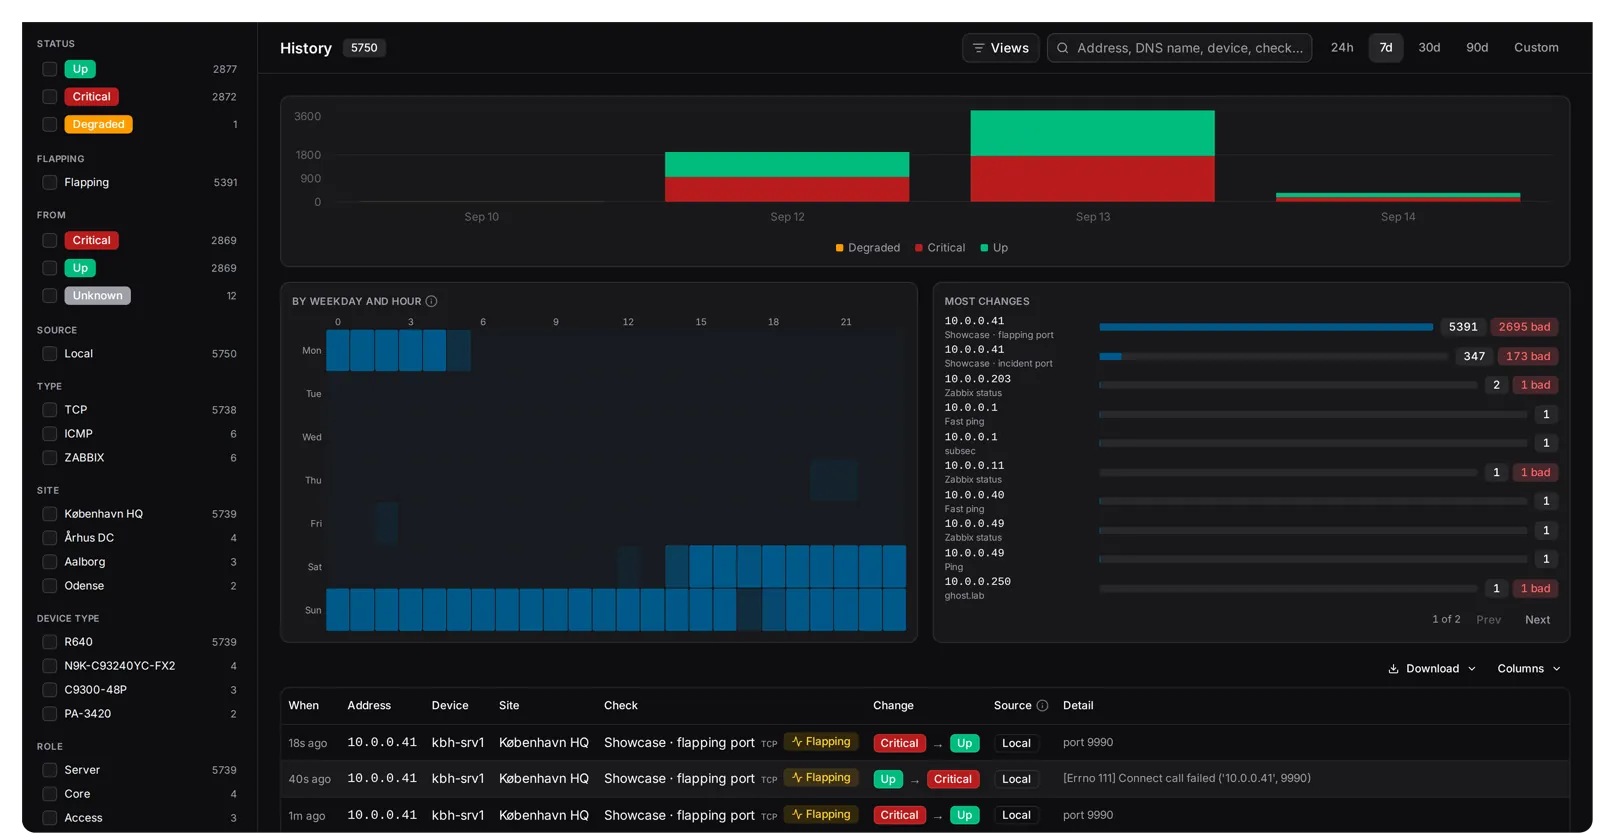 The History tab at 7d: the rail, the per-day chart, the weekday and hour heatmap, Most changes headed by the showcase flapping port, and the first rows with their Source and detail.
By weekday and hour
A 7 × 24 grid in your timezone, shaded by count. It shows patterns the table hides: a column lit on every row is a scheduled job, a single lit row is one bad day, a 03:00 column is a backup window. Click a cell and the table and the Most changes list narrow to that hour of that weekday, with a chip to clear it. The grid itself stays whole so the next cell can be picked. This week is one lab host flapping around the clock, hence the solid Sunday.
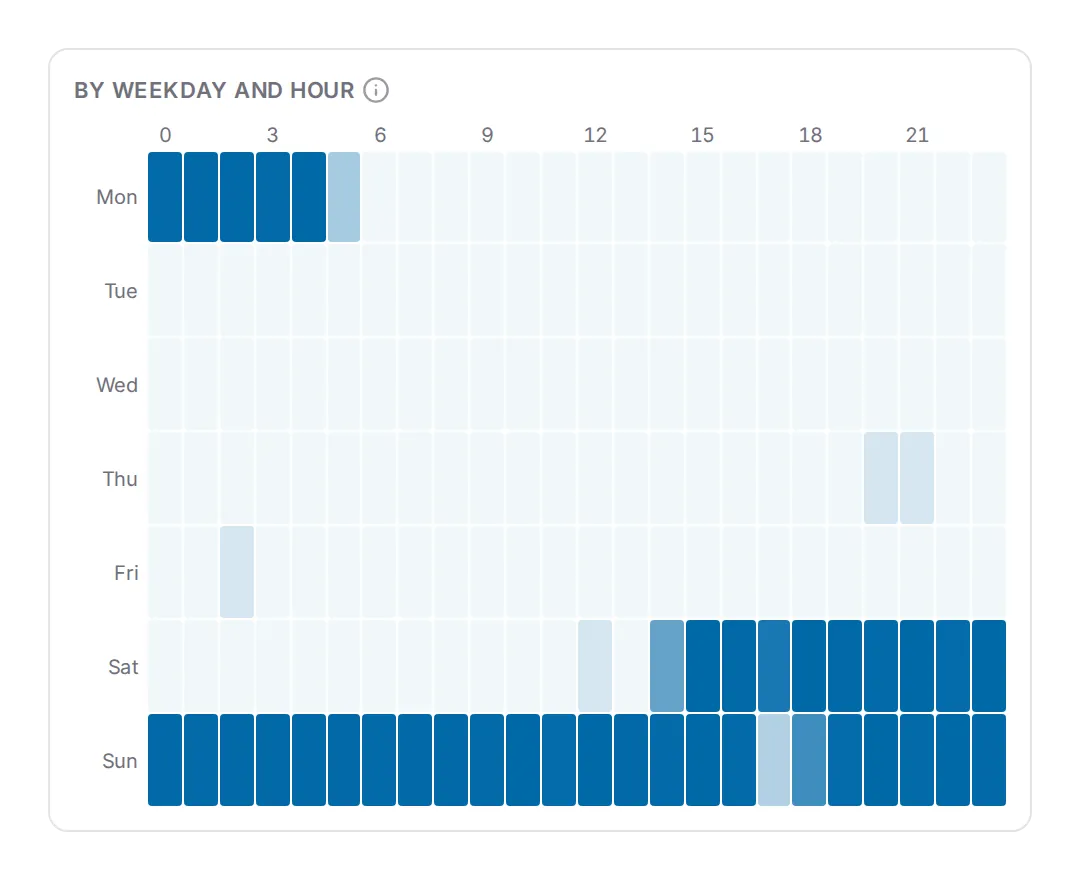
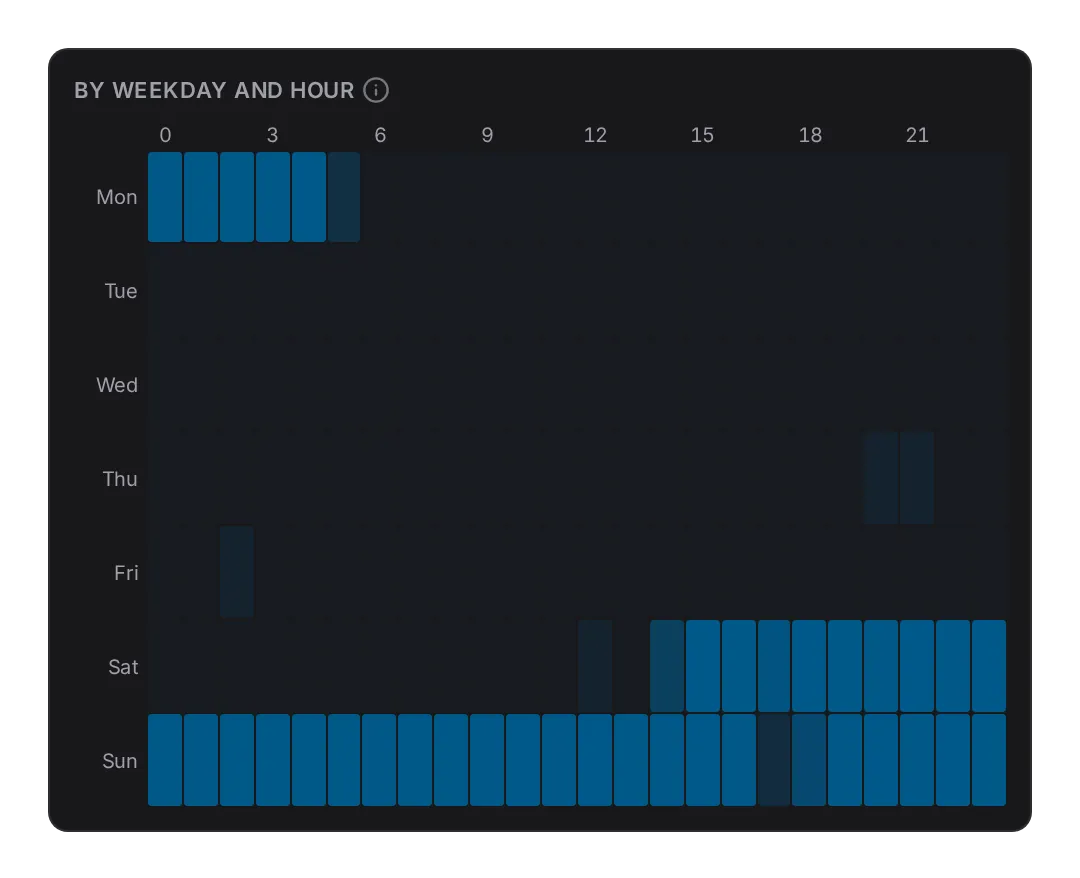 By weekday and hour: a week of one lab host flapping around the clock, hence the solid Sunday.
Most changes lists the addresses and checks that changed most, with a bar scaled to the noisiest and a red count of the changes that went to a bad state. Download exports every page the filters match, capped at 5,000 rows. Status changes are kept for a year; results for thirty days.
The Overview's charts
The Overview gains a window and three figures. Check results over 24h, 7d or 30d, per hour up to three days and per day beyond. Latency as the estate's median and 95th percentile per bucket, which is the pair worth having: the median says how the network feels, the 95th says who is suffering. Alerts as opened against resolved per day, the "are we keeping up" chart; matched bars mean alerts close as fast as they open. The Availability card on the Overview is a result-count ratio over the window, not the time-weighted figure the History panel shows, so the two are not expected to match.
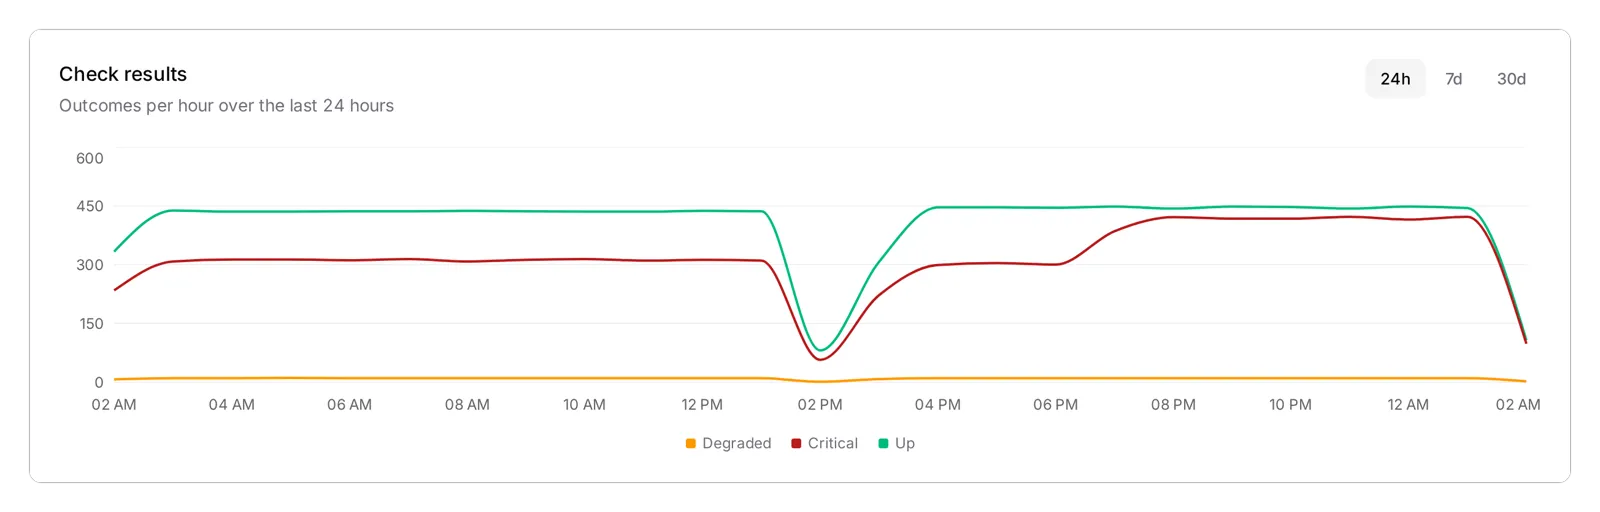
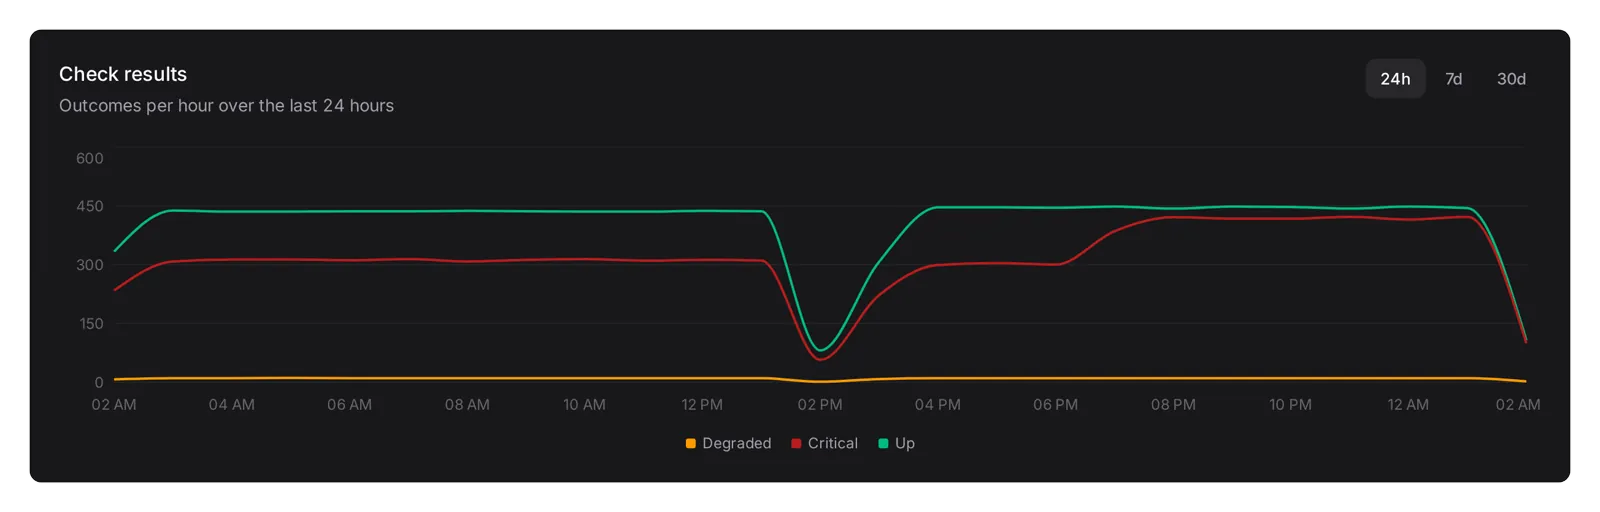 Check results at 24h on the Overview: outcomes per hour, with Up and Critical dipping together around 2 PM and recovering.
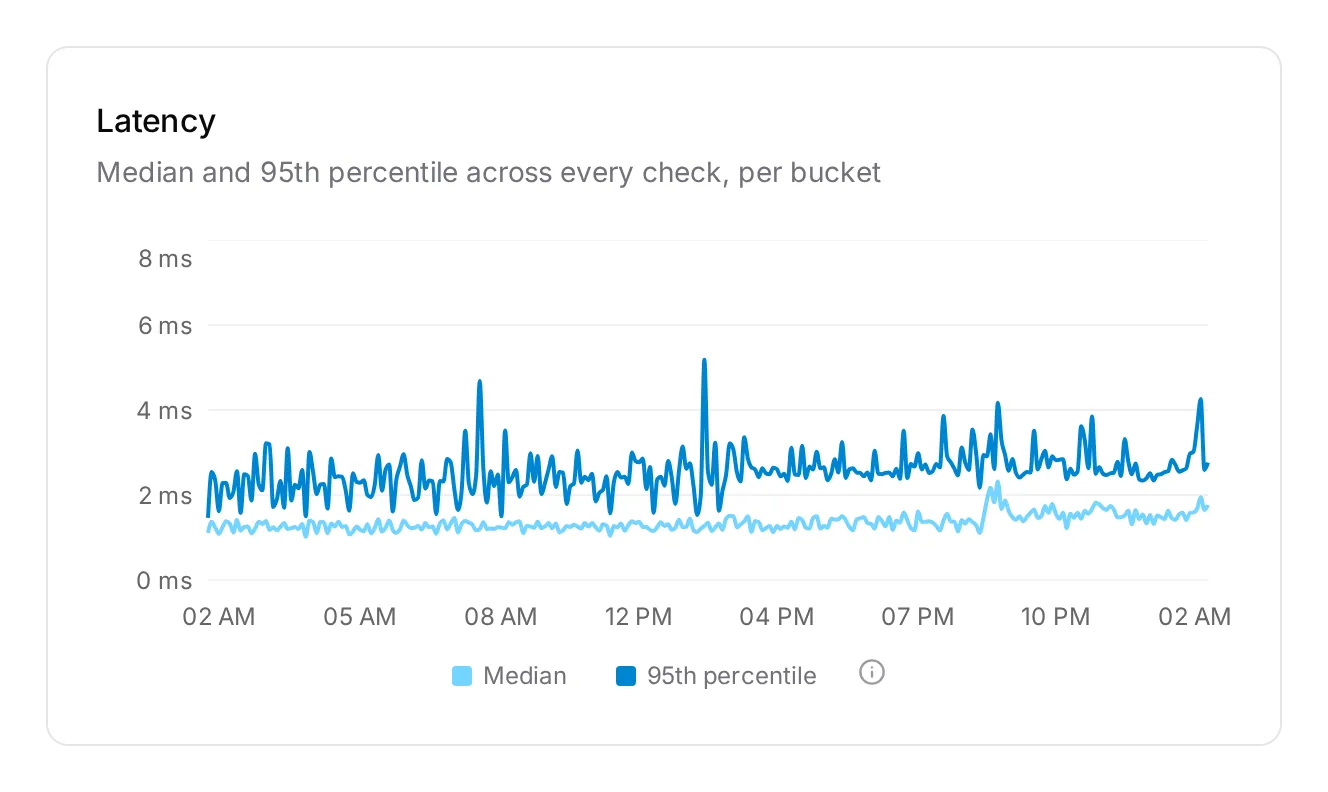
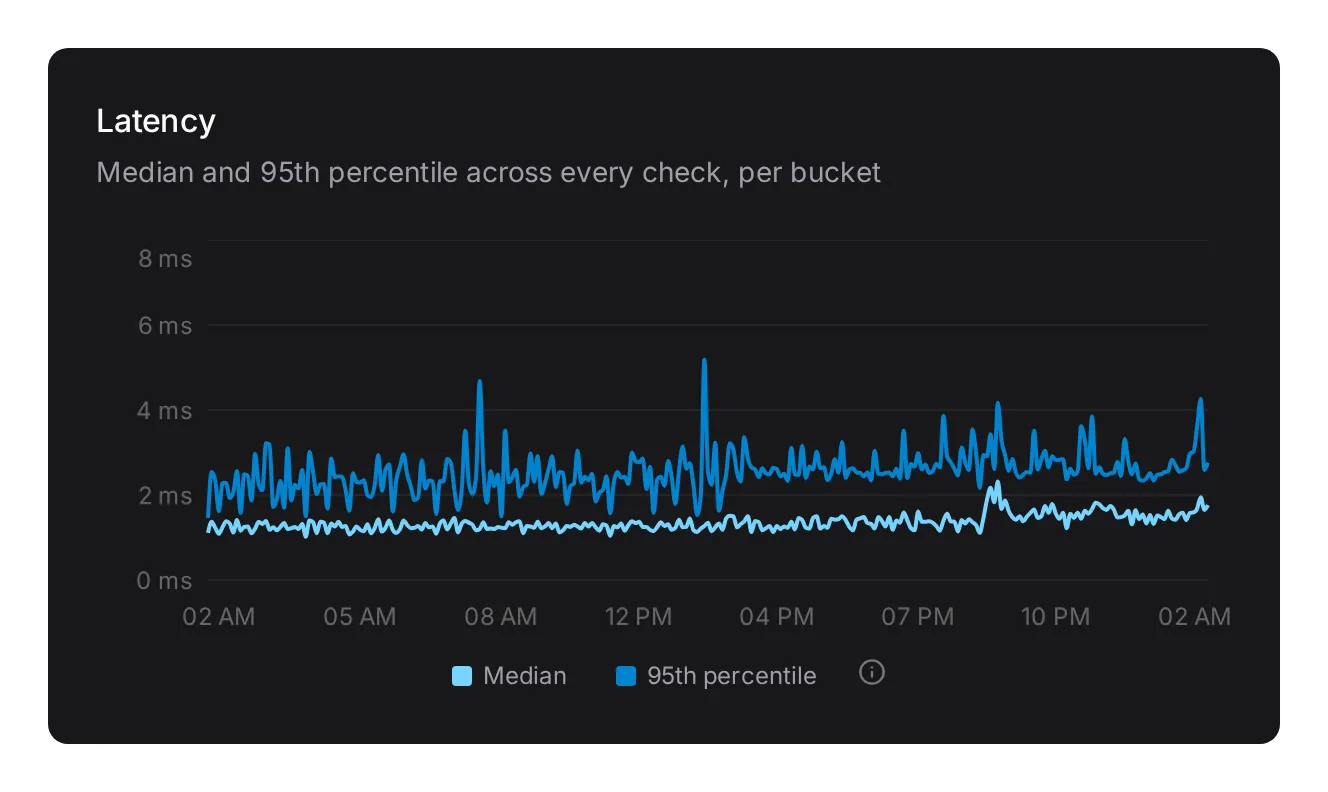 Latency: median and 95th percentile across every check, per bucket.
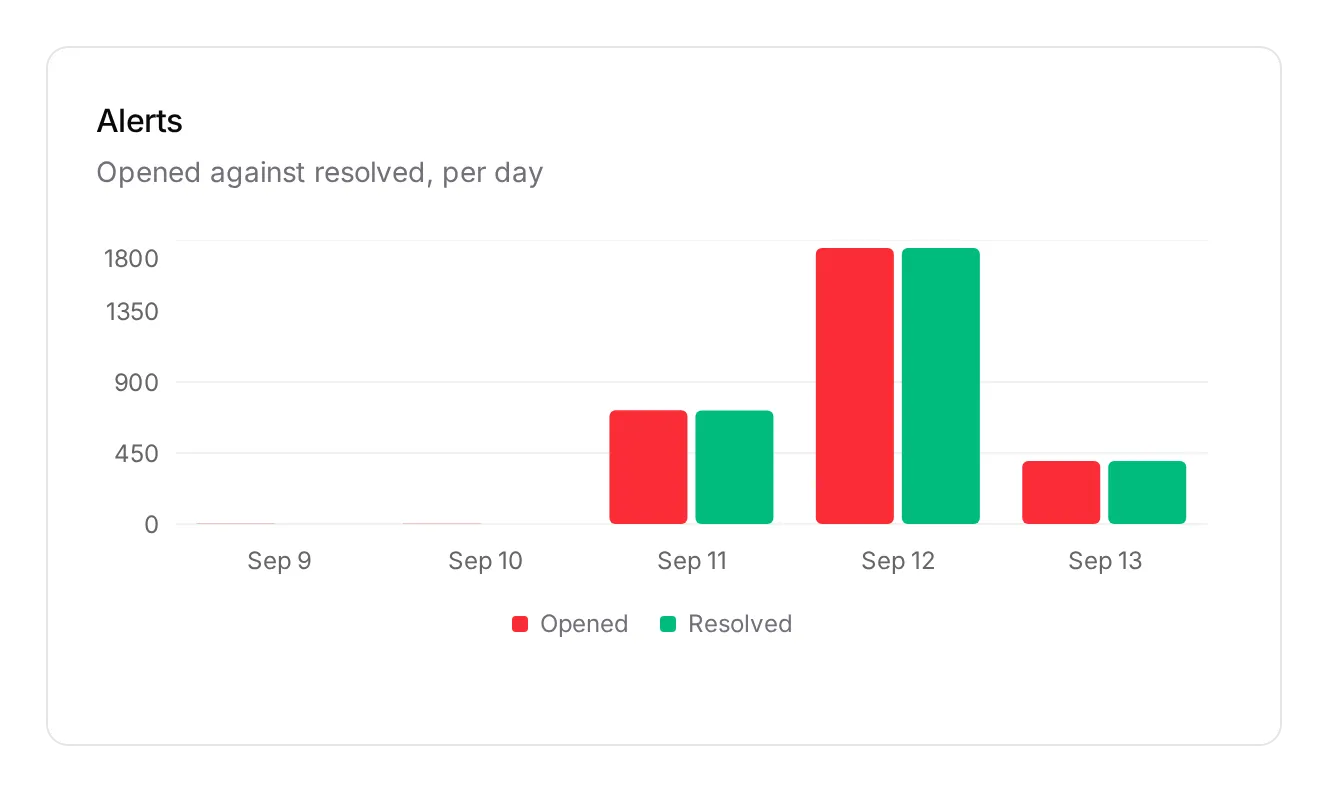 Alerts: opened against resolved, per day.
Who answered
Every result and status change now records the engine that ran the check: Local for Danbyte's own workers, an Outpost by name, or Zabbix. It shows as a Source column on the Checks list and every history row, as a badge in Recent changes and inside a strip's click card, and the rail filters on it. It is the engine that ran the check, not the one the target is bound to: a ping on a device bound to Zabbix runs on Danbyte's workers and says Local. When Danbyte, an Outpost and Zabbix all watch the same estate, "who said it was down" is the first question in an incident.
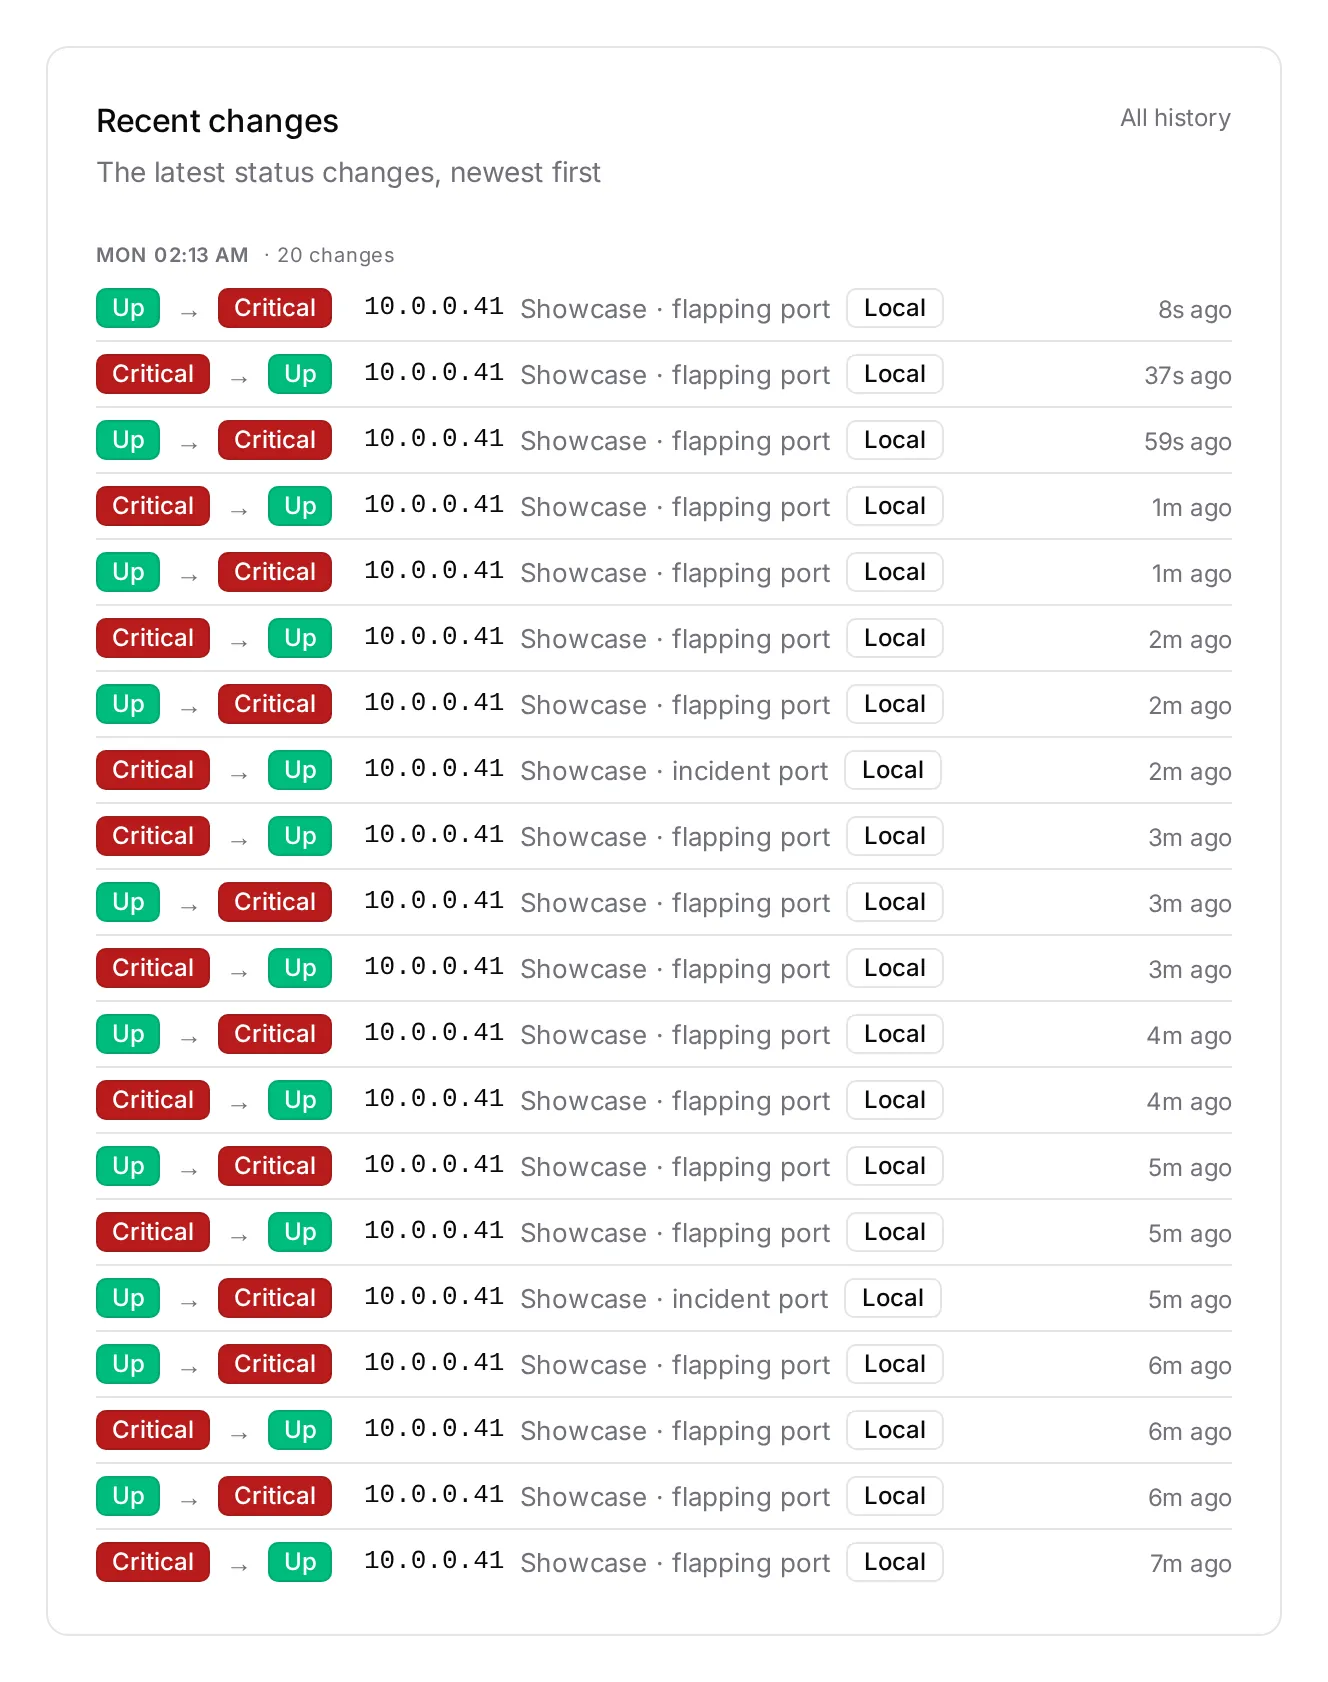
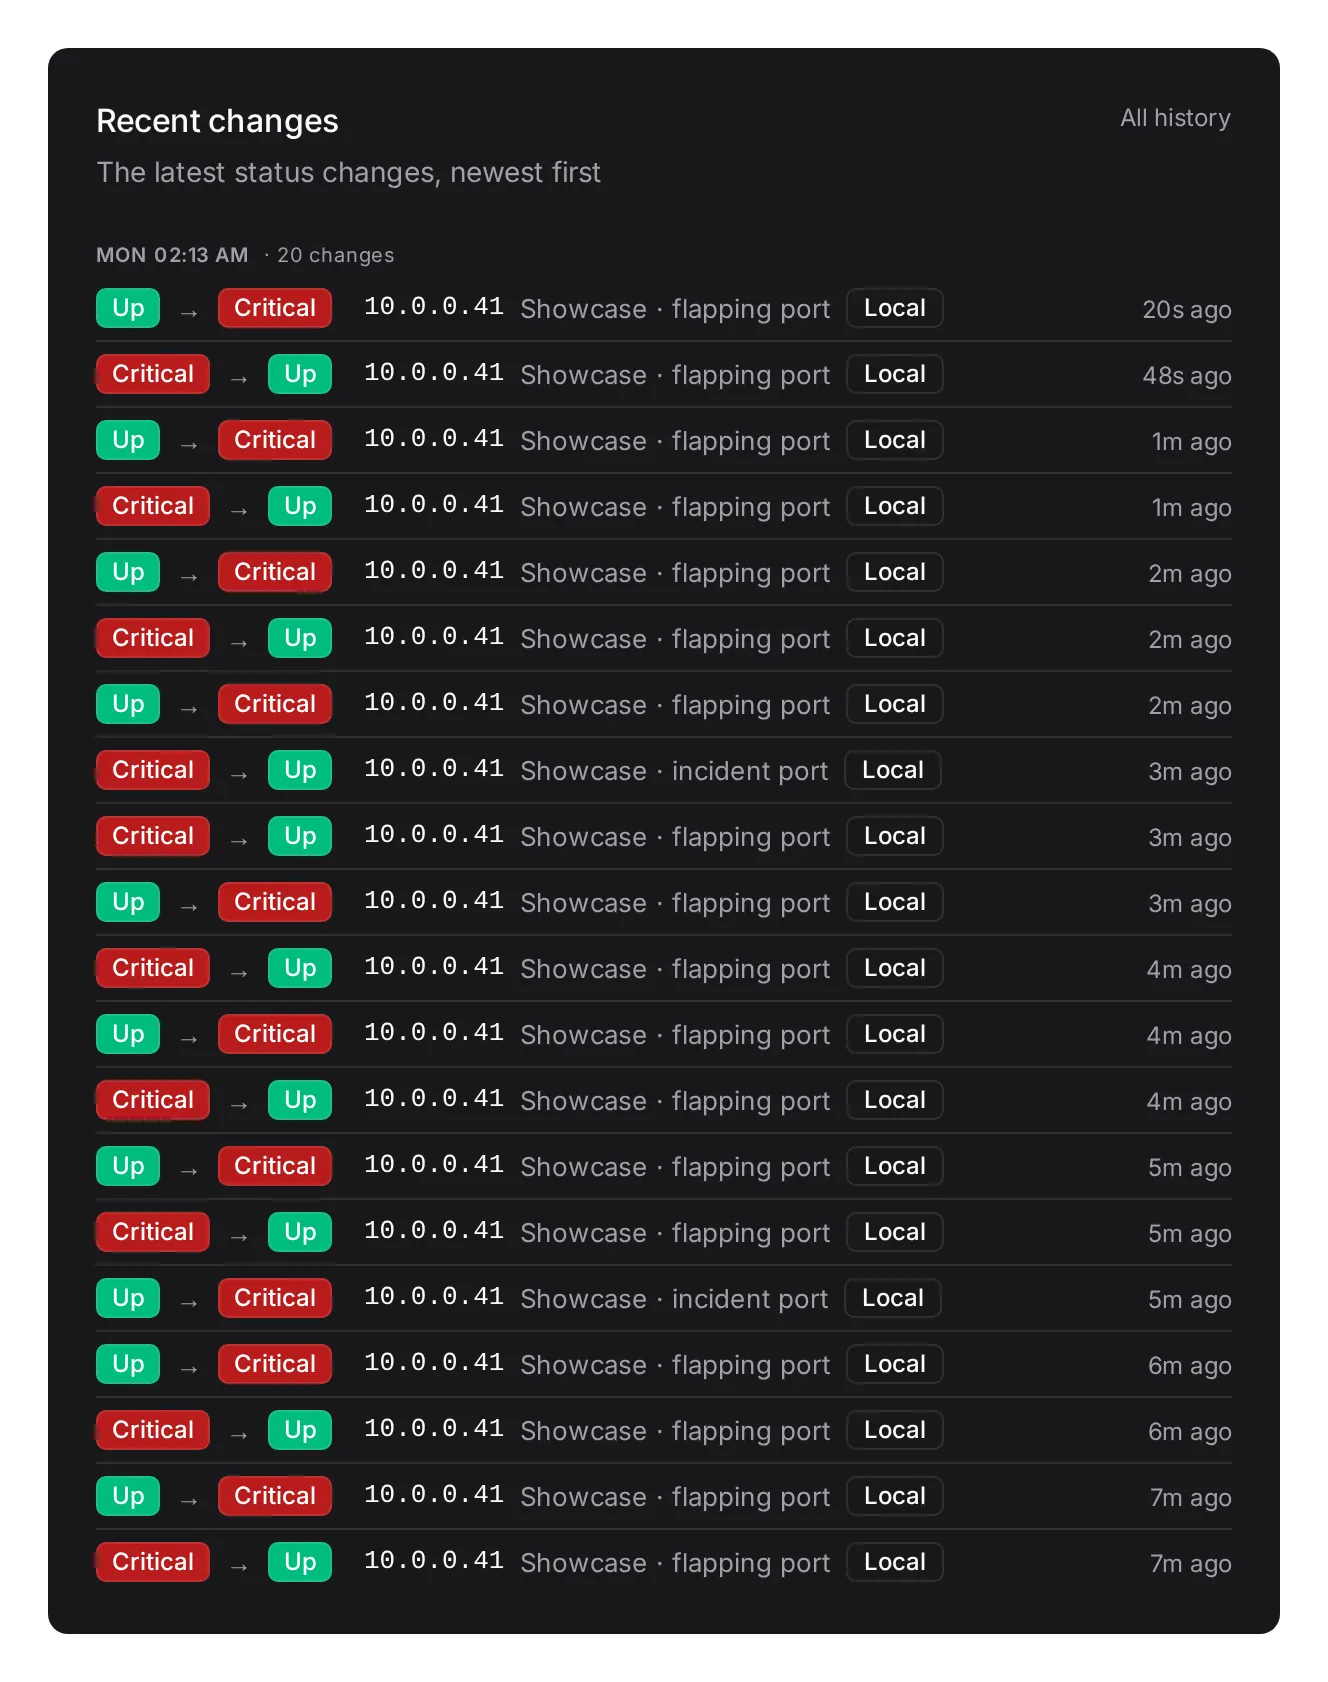 Recent changes on the Overview, each with a Source badge saying who answered.
Four dashboard widgets bring the same pictures to the home page. Status history shows the strips and availability of up to twelve addresses and devices you pick, with its own window; add it more than once for different sets. Availability is a seven-day gauge, Alerts per day and Latency are the Overview's charts at seven days. All follow the same site scoping as the monitoring pages.
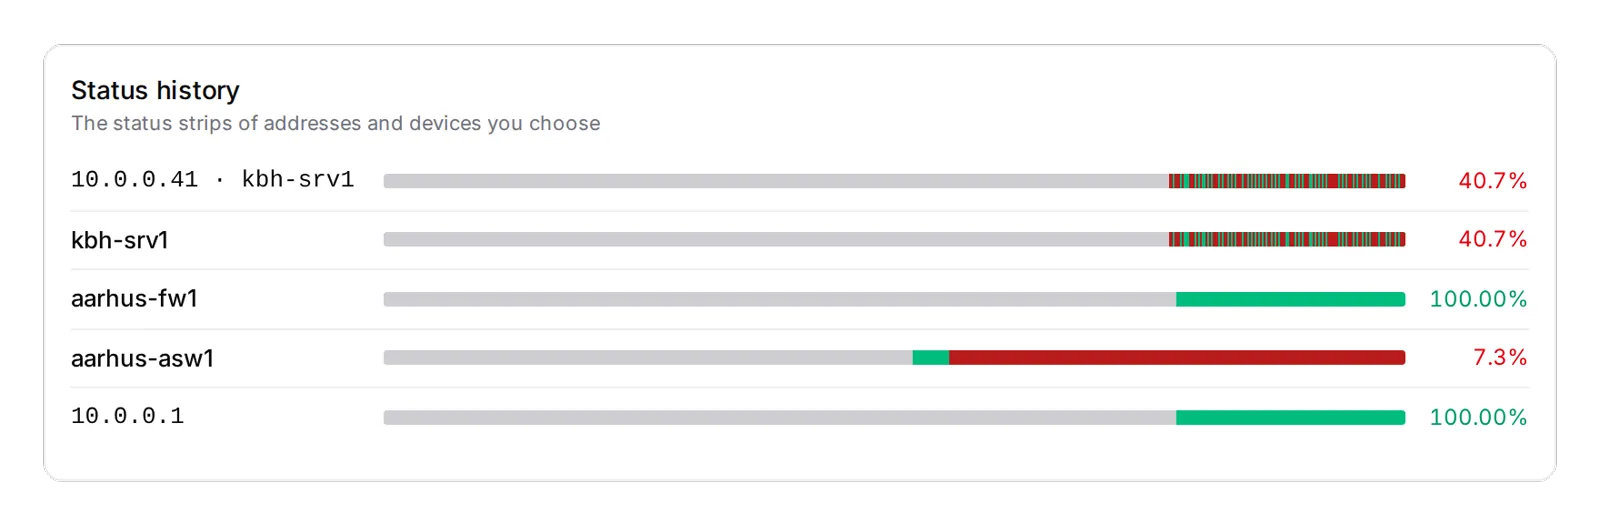
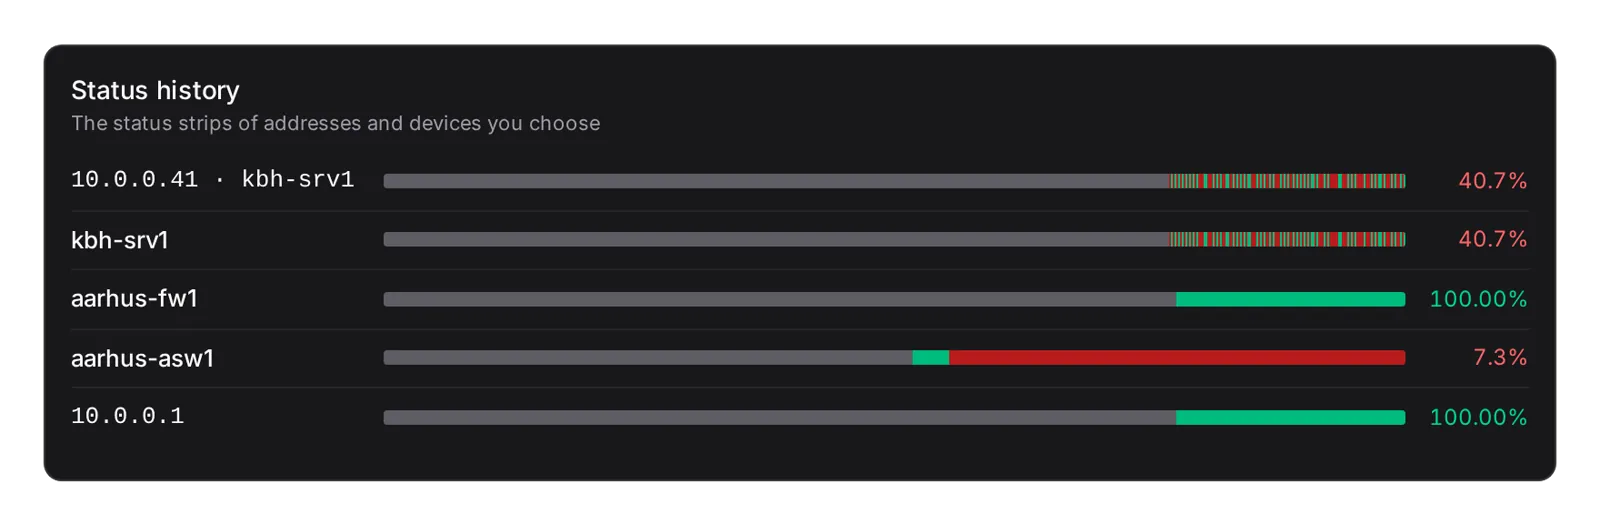 Status history: five picked targets, each drawn to scale, with availability at the end.
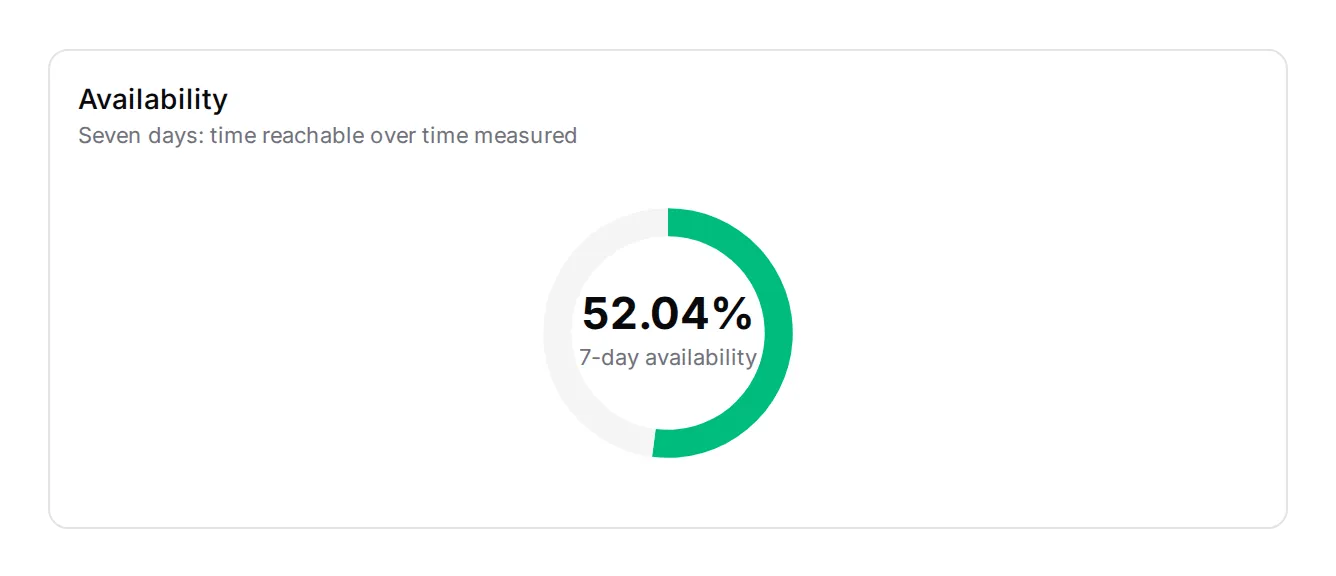 Availability: seven days, time reachable over time measured.
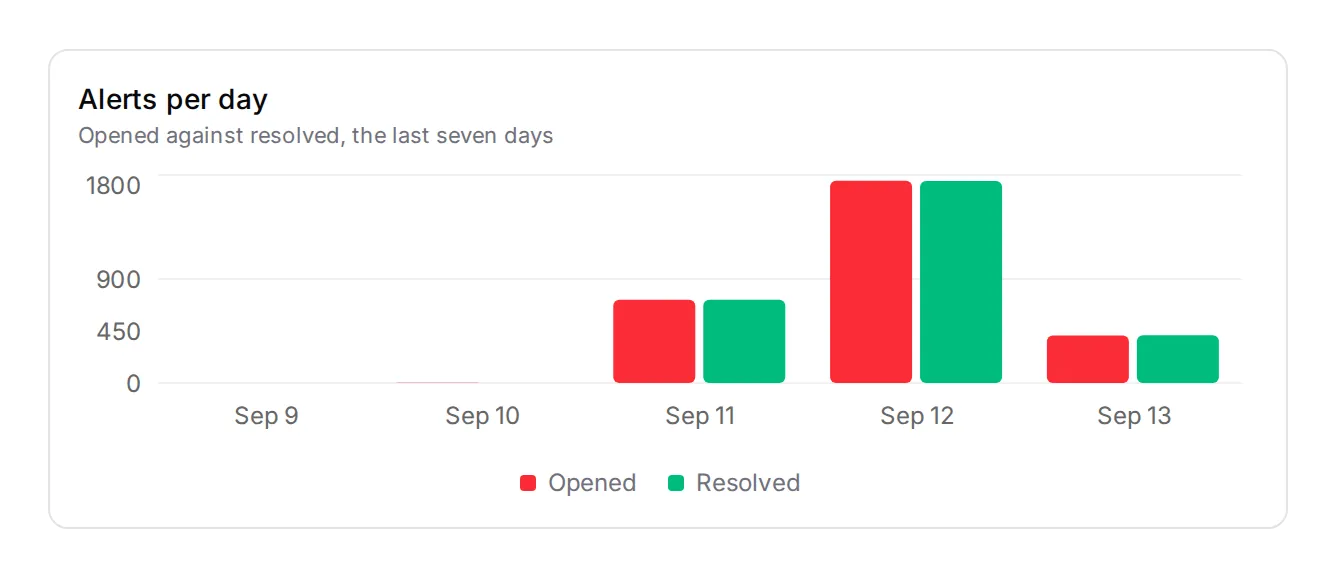 Alerts per day for the last week.
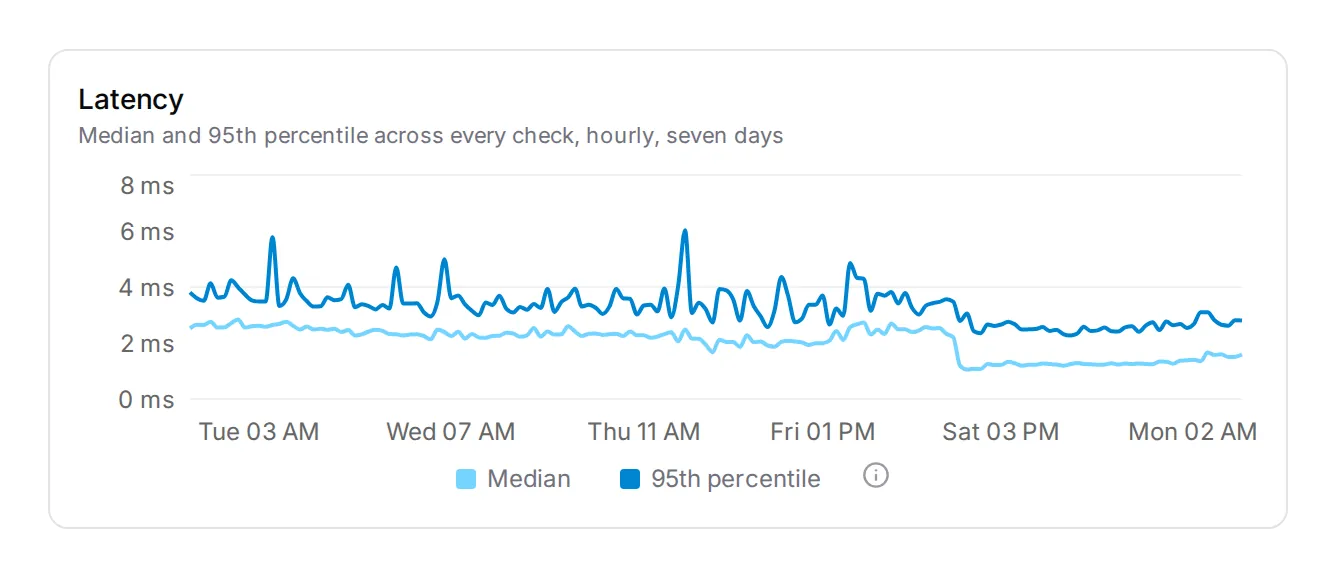 Latency, hourly median and 95th percentile over seven days.
For the technical reader, GET /api/monitoring/transitions/ reads status changes back, paged and filtered by anything an address is: state, source, engine, site, region, device, type, role, platform, prefix, VRF, VLAN, port, tag, a search, flapping=1, or a heatmap cell. One answer carries the rows, the facet counts, a bucketed series, the heatmap cells and the top changers, so one call feeds a rail, a chart and a table. The per-object variants pin it to one address, device or prefix, and …/timeline/ returns the status-over-time segments the strips are drawn from, per check and rolled up.
GET /api/monitoring/transitions/?site=<id>&to_status=down,degraded&source=outpost&hours=36&page_size=100
GET /api/monitoring/devices/<id>/timeline/?hours=72
Sub-second checks: the fast lane
Until now the minute beat set the floor for everything Danbyte monitored. Nothing ran faster than once a minute, and every run was a row in the database. That is fine for a printer and wrong for a core switch, a firewall pair or an uplink, where a three-second outage matters and a sixty-second blind spot does not. 0.16.0 adds a second lane for those few things.
Pick 200 ms, 500 ms, 1, 2, 5, 10 or 30 seconds as the interval on a check definition or in Add check, and the check moves to the fast lane. Rise and fall, alert rules, silences, channels, history and flapping all stay as they were. The floors are 200 ms for ICMP and 1 s for anything that opens a connection; only ICMP goes below a second. Picking a fast interval reveals Record every, default 1 minute, which is the one knob that changes what the check costs. The check keeps an ordinary interval too, shown as Interval (s) in the per-check overrides. That is its fallback cadence on the minute beat, used whenever the lane is not running or an older Outpost holds the check.

 Three ICMP checks on one address: Fast ping at 1 s with the lightning badge, a plain Ping on the minute beat, and subsec at 200 ms. The fast rows were last checked 1s and 0s ago, Ping 4m ago.
The lane is a new long-lived process, danbyte-fastlane, that holds the tenant's fast checks in an in-memory schedule and probes them at their cadence, without booting a job per run. Every probe goes through the same hysteresis the workers use. When rise or fall is crossed, the status change is written at once, with the probe that caused it and everything a change sets off: alerts, notifications, history, flapping. Every other probe is folded into one aggregated result per Record every, carrying the window's probe count, packet loss and min, average and max latency. The individual probes are not stored. A one-second ping therefore costs the database what a one-minute one does, and an outage is still seen in interval × fall: three seconds for a 1 s check with the default fall of 3.
flowchart LR
  A[Sub-minute check<br>200 ms to 30 s] --> B[In-memory schedule<br>danbyte-fastlane, or the Outpost]
  B --> C[Probe]
  C --> D{Rise or fall<br>crossed?}
  D -->|yes| E[Status change, now<br>alerts, notifications, history, flapping]
  D -->|no| F[Fold into the window<br>min / avg / max / loss]
  F -->|every Record every<br>default 60 s| G[One aggregated result]
  E --> H[(Database)]
  G --> H
  C -.->|newest 600, at most 10 min, watched addresses only| I[Recent probes<br>Redis]
You can still watch the probes that are not stored. An address's Monitoring tab now updates over a WebSocket while it is open; a Live badge beside the Checks title says the socket is up, and without one the tab polls every 15 s instead. Only addresses somebody is looking at are pushed, so an estate nobody has open costs nothing. Under a fast check's latency chart, Recent probes shows the last ten minutes of raw probes, one line per probe, newest first, capped at 600. That is ten minutes of a 1 s check and the last two minutes of a 200 ms one. It lives in Redis for the addresses being watched and is gone ten minutes after the last look, so it is a window on the lane rather than history. A recorded result row opens to its figures, and the latency chart draws a fast check the same way it draws a slow one, the average as a line, each bucket's min and max as a band, loss as bars.
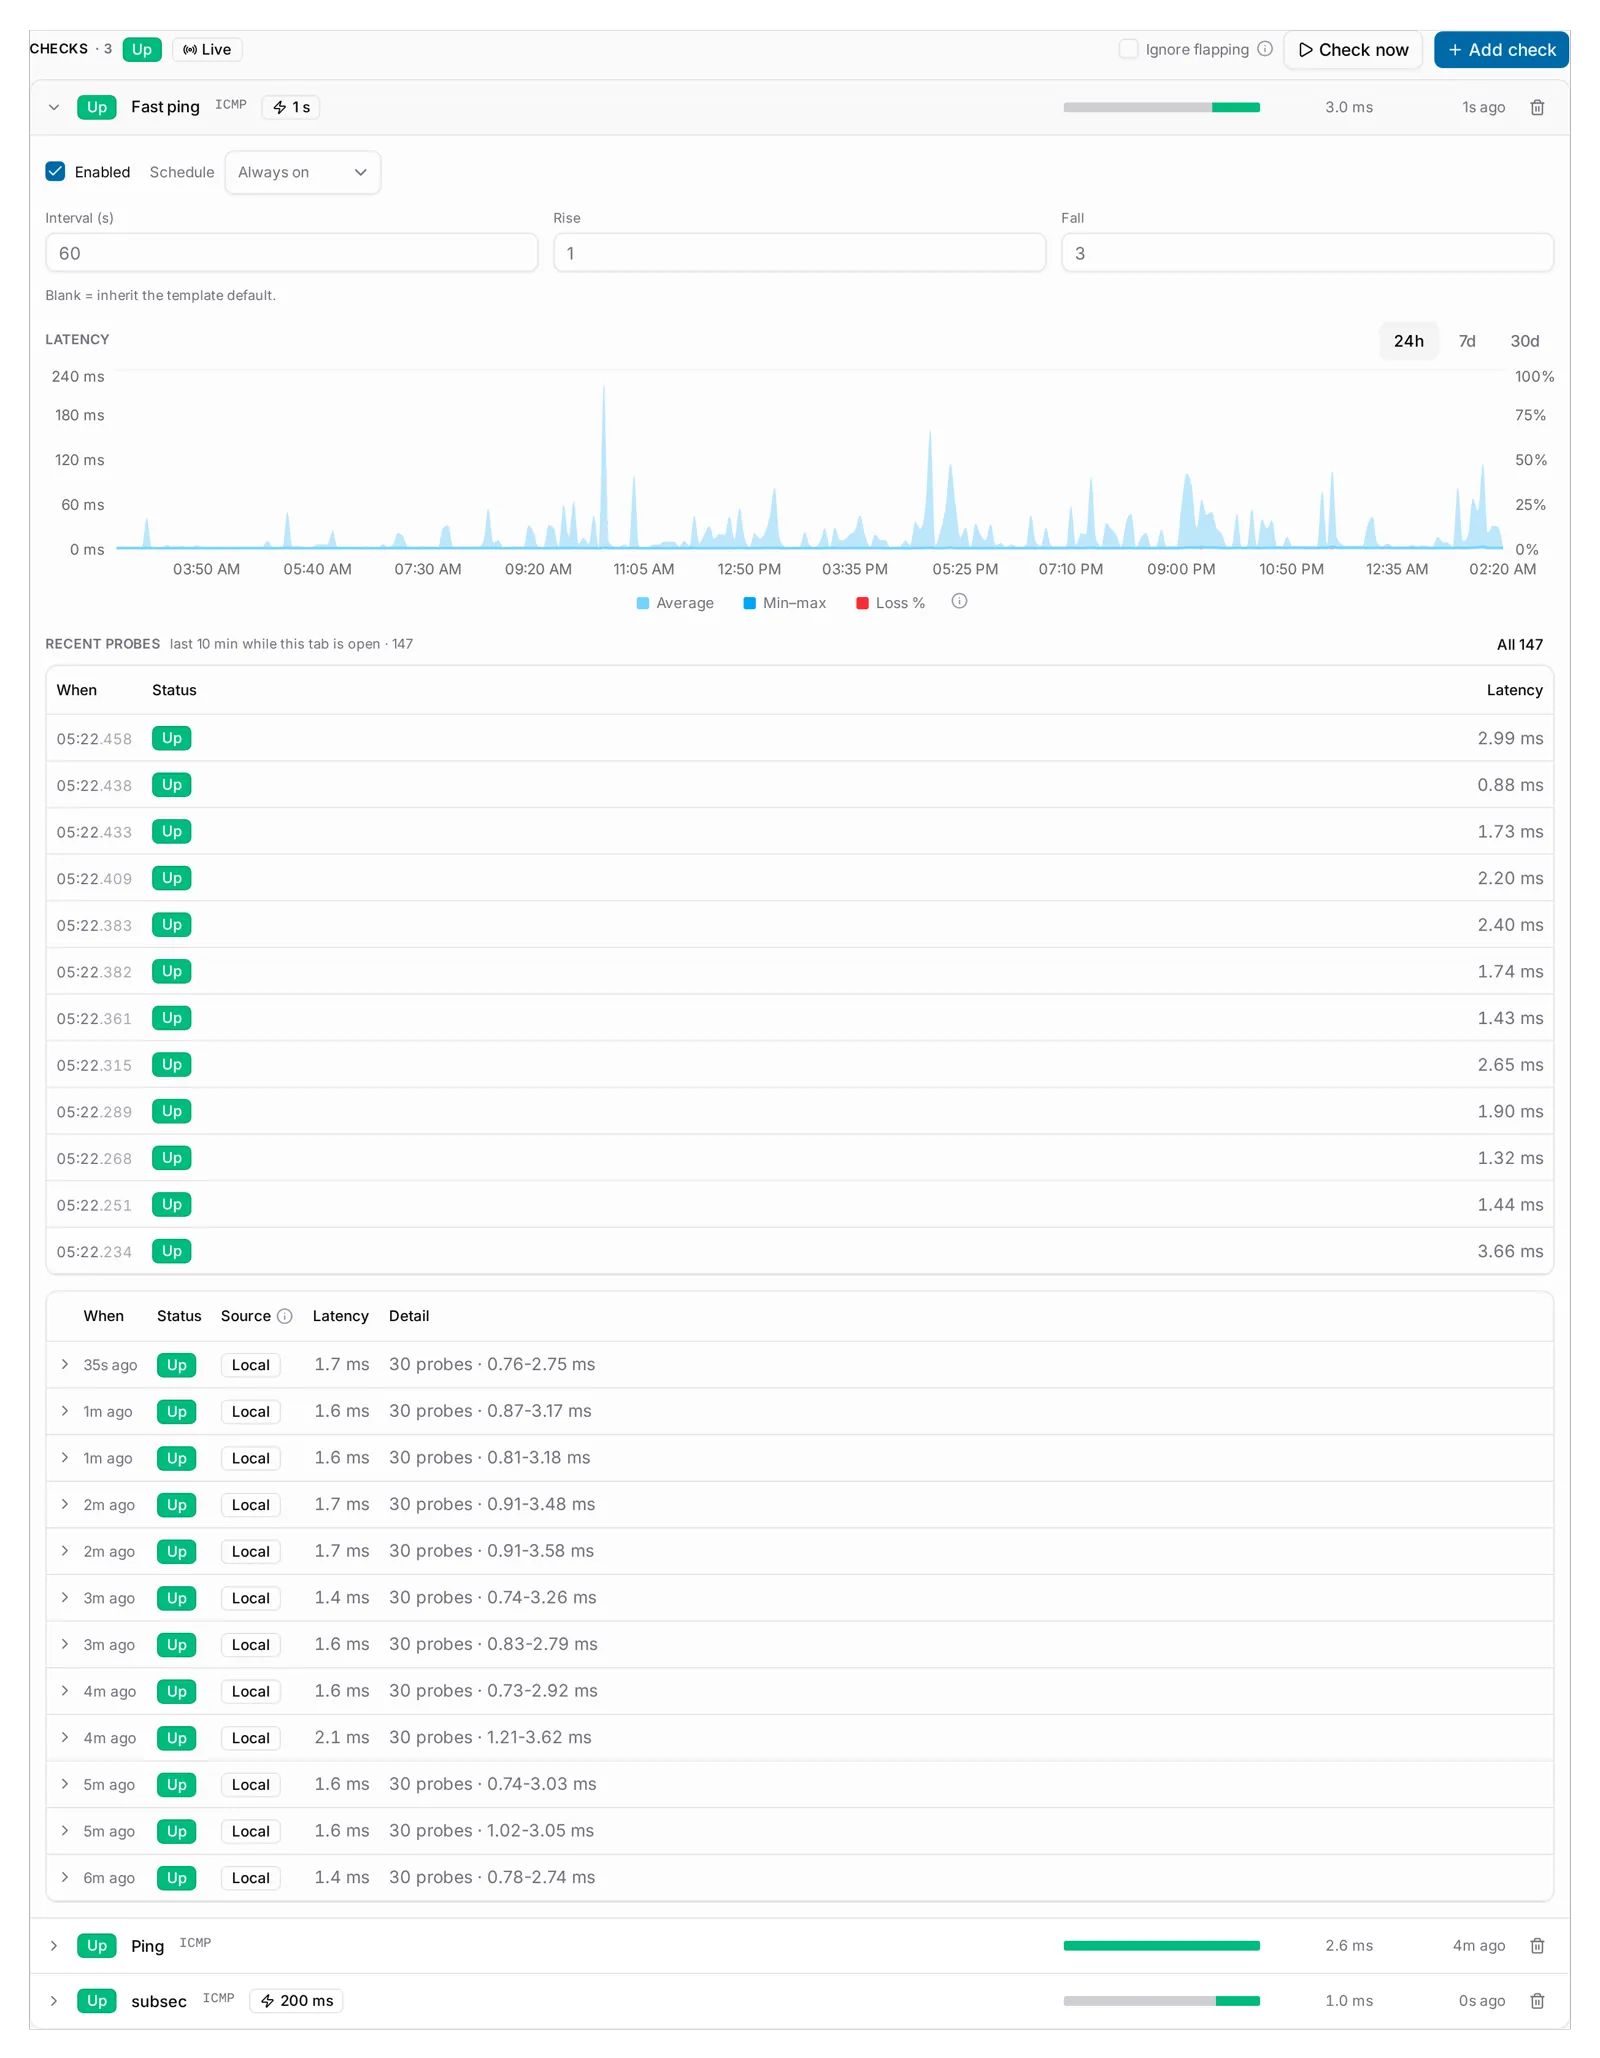 Fast ping at 1 s expanded: the fallback interval in the overrides, the latency chart, 219 probes in Recent probes, and one recorded row every 30 seconds, each folding 30 probes.
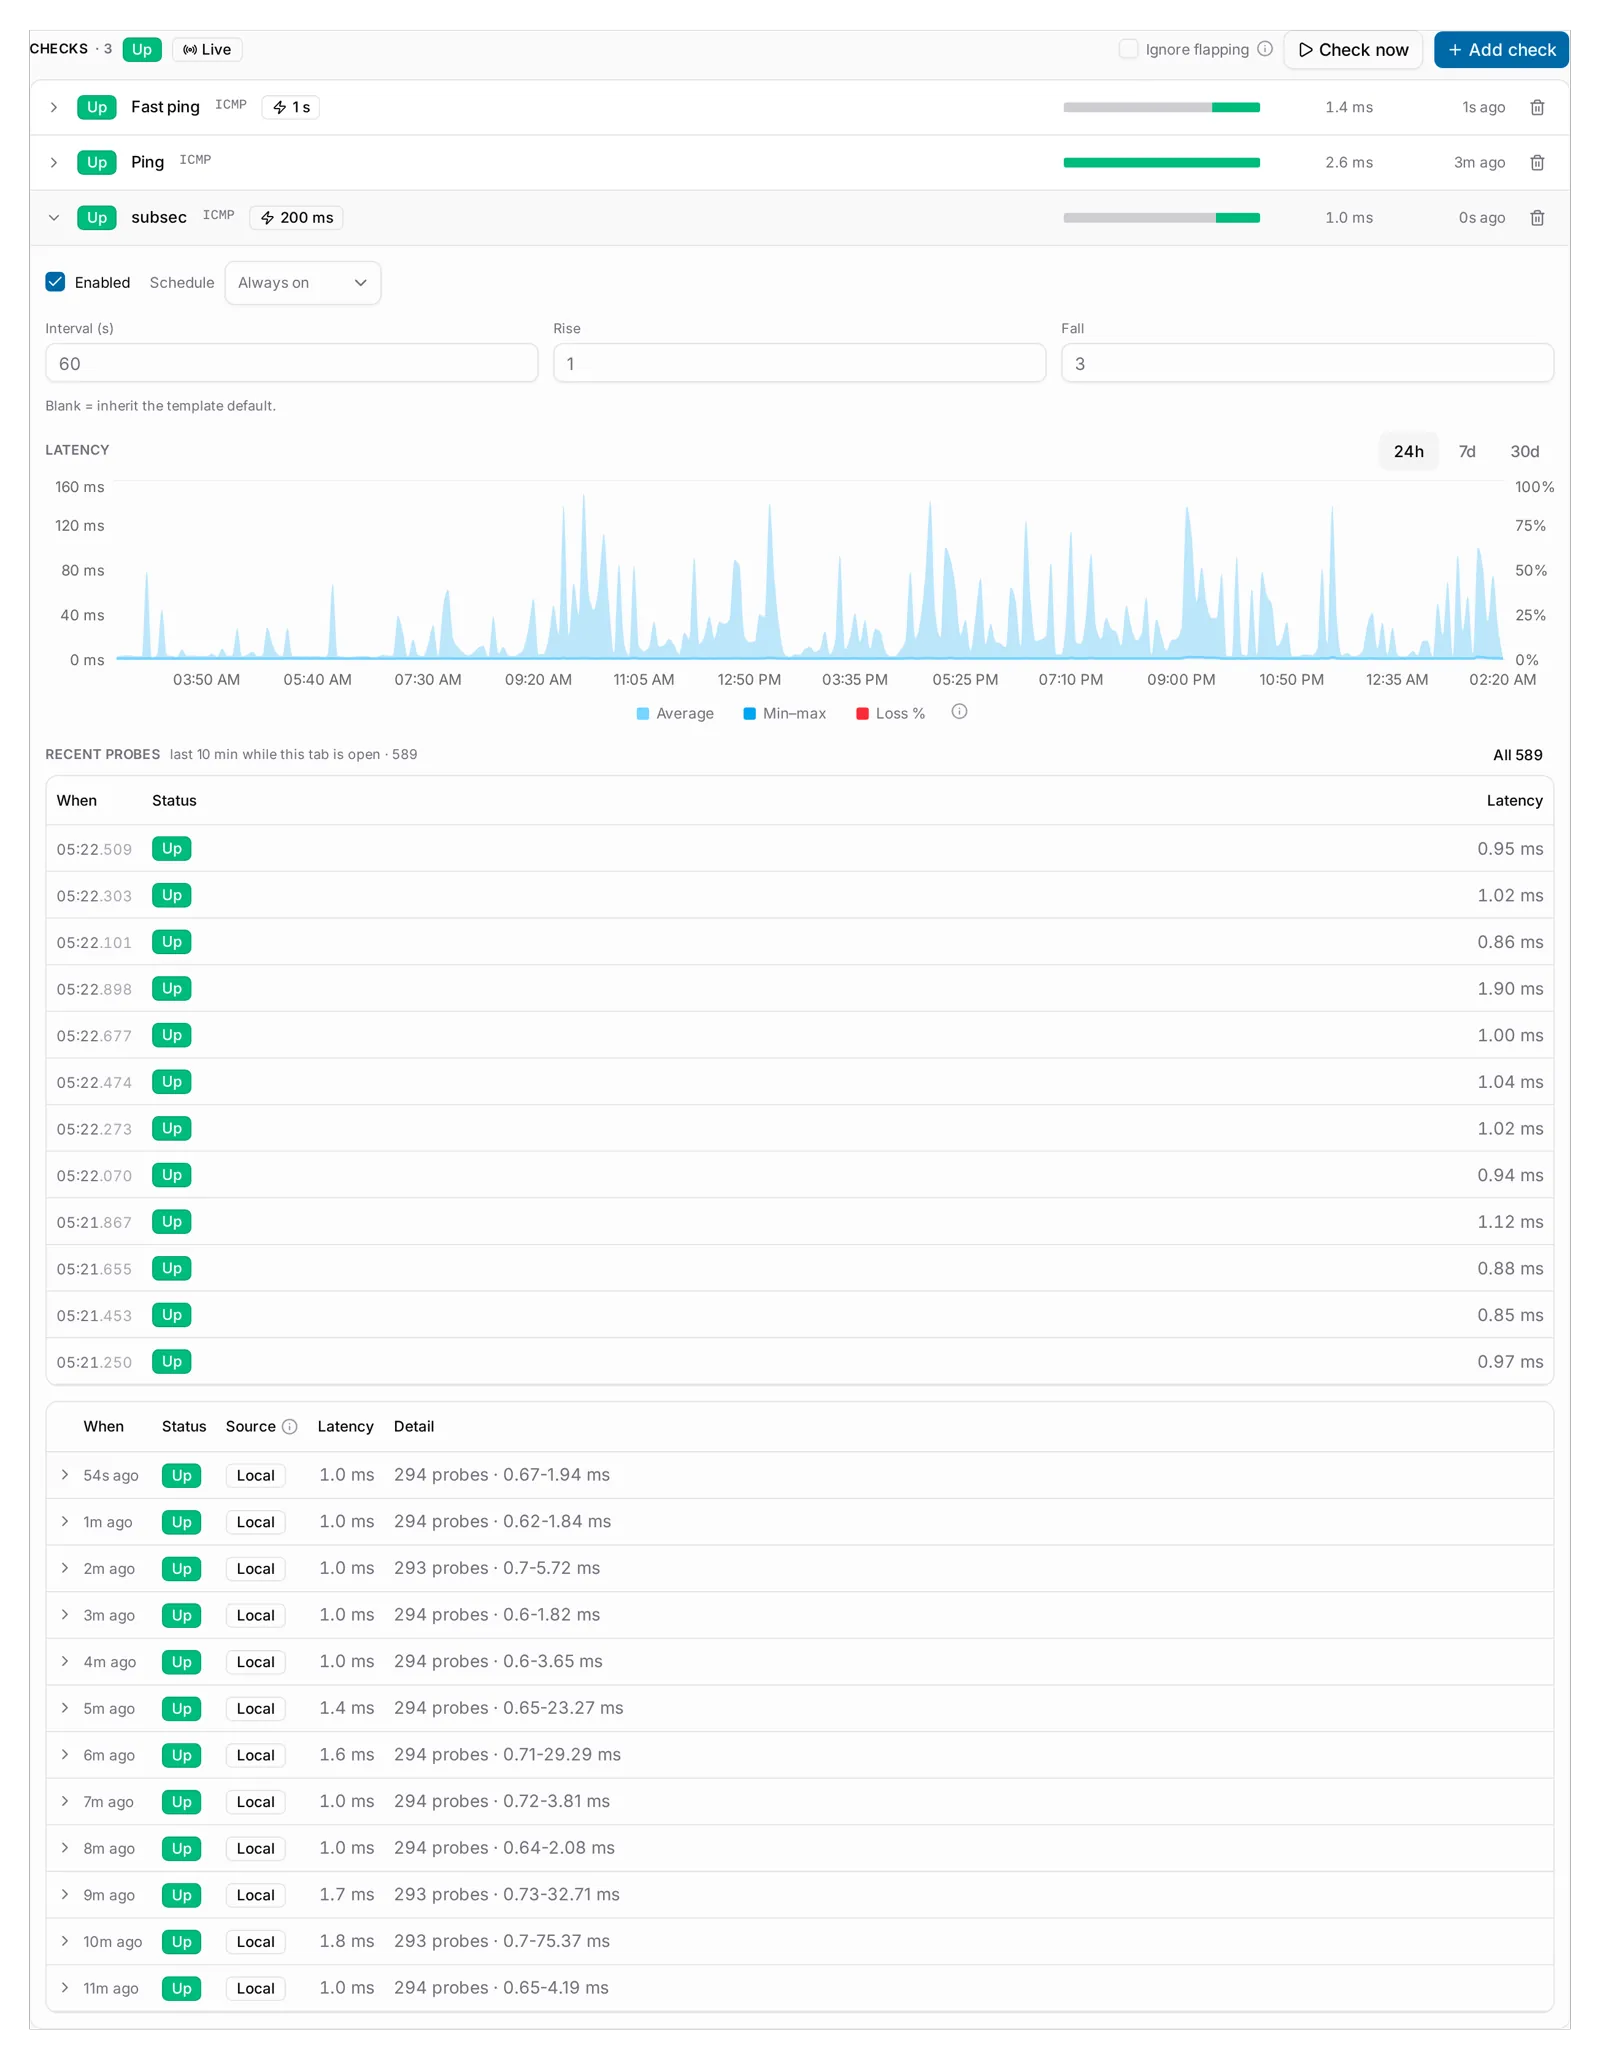
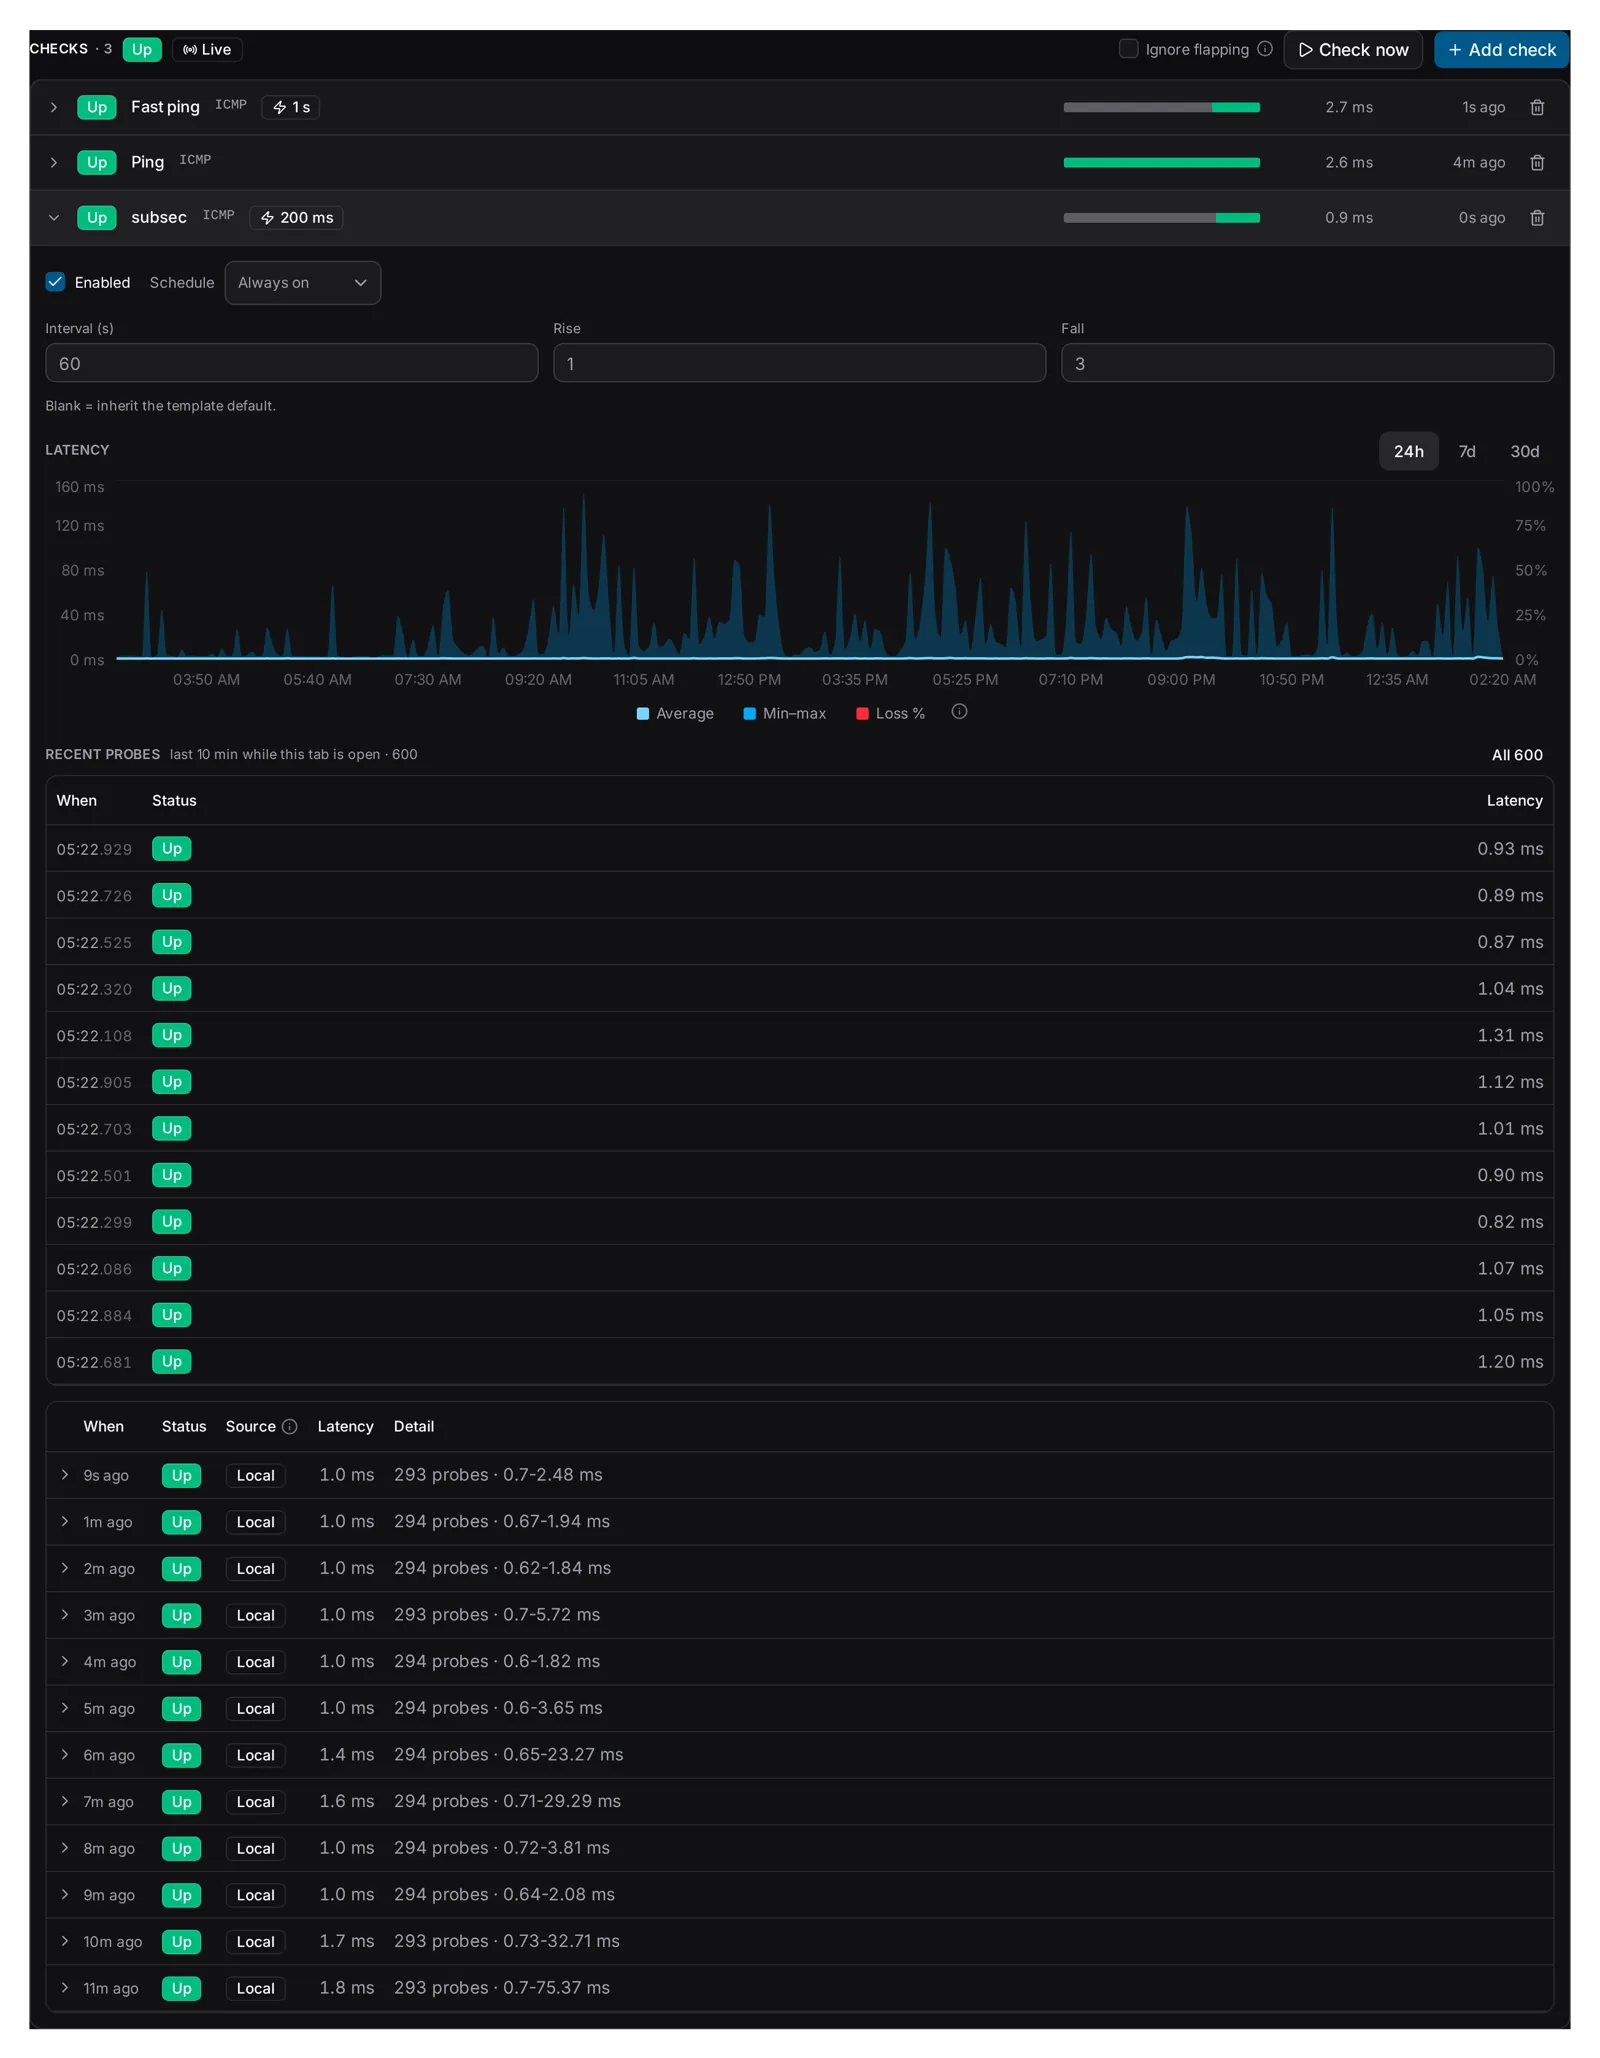 subsec at 200 ms: Recent probes at the ring's cap of 600, and one recorded row a minute folding 293 to 294 probes each.
An Outpost running agent 0.8 runs the same lane at the edge. It says fast: true in its hello, pulls its set of sub-minute checks every 15 s, probes from its own in-memory schedule and reports buffered probes back on its poll interval, or at once when a probe's reachability differs from the last one reported, so a drop at the edge does not wait for the next poll. The core folds the batch through the same rise and fall it applies to its own lane, so status, history and alerts come out identical whichever side did the probing. The branch office does its own sub-second probing and the WAN carries a summary. An agent older than 0.8 keeps working; its sub-minute checks are handed out on the minute beat at their fallback interval until it is upgraded.
The cap and the fallback
A thousand one-second pings is something an admin should have decided on, so each tenant has a ceiling, Sub-minute checks under Settings, Monitoring, 500 by default; checks over it run on the minute beat, and 0 turns the lane off. The lane writes a heartbeat to Redis. When it has been missing for 45 s the minute beat takes the fast checks over at their fallback interval, a red strip at the top of the Monitoring pages says so, and the lane gets them back when it returns. A stopped lane falls back to what every check did before this release; nothing goes quiet. The Overview's stat cards gain a Fast lane card with the number of fast checks and the lane's pace, 7.8 probes a second here, and the host console reports the same figure with Django up or down.

 The Overview's stat cards, with the new Fast lane card: 6 checks at 7.8 probes a second. The availability figure is a lab where ports are opened and closed to make the pictures.
Flapping is a state
Before this release a host that bounced between up and down showed up as a list you had to go and ask for, and the alert side counted its own flaps. Now flapping is something a check is. A sweep runs every minute and flags a check that goes bad five times inside thirty minutes (both numbers are settings; 0 turns it off). The flag shows as a pill beside the status badge wherever the status is drawn: prefix, device and VM lists, the address and its Monitoring tab, the device's tabs, every row of the Checks list and every change of a flagged check on the History tab. It covers checks run by Outposts and by Zabbix too, because it is computed from the status-change log, not by the engine.

 The Checks section on 10.0.0.41: the split badge, the Flapping pill and the Live badge in the header, then Confirm not flapping, the Ignore flapping checkbox, Check now, Notify me and Add check. The flapping port is Up but flagged, and its strip shows the alternation.
The flag does not go away on its own. A check that stops bouncing is still marked flapping until an operator presses Confirm not flapping, on the address, on the device, or in bulk on the Flapping tab. "It stopped bouncing" and "it is fine" are different claims, and the second one now belongs to a person, on the record: the confirmation is written to the address's change log with the checks it covered, and only bad changes after that moment count towards flagging it again. Confirming needs change permission on the address. It clears the flapping mark; acknowledging the alert is a separate action.
stateDiagram-v2
    [*] --> Normal
    Normal --> Flapping: 5 bad changes in 30 min
    Flapping --> Normal: Confirm not flapping (change log)
    Flapping --> Normal: Auto-clear after 30 quiet min (if on)
    Flapping --> Normal: Ignore flapping or excluded status
    Normal --> Flapping: 5 new bad changes after the confirm
The Flapping tab appears in the Monitoring page's tab row only while something is flagged, with the count in its label. It is the Checks list pinned to flagged checks, with the last 24 hours drawn to scale instead of seven days, because there the alternation itself is the picture and it is the evidence for the confirm decision: settling alternation looks different from steady bouncing. Select rows and a floating bar offers Confirm not flapping for the lot, which is how a maintenance window that bounced fifty ports gets cleared in one gesture.
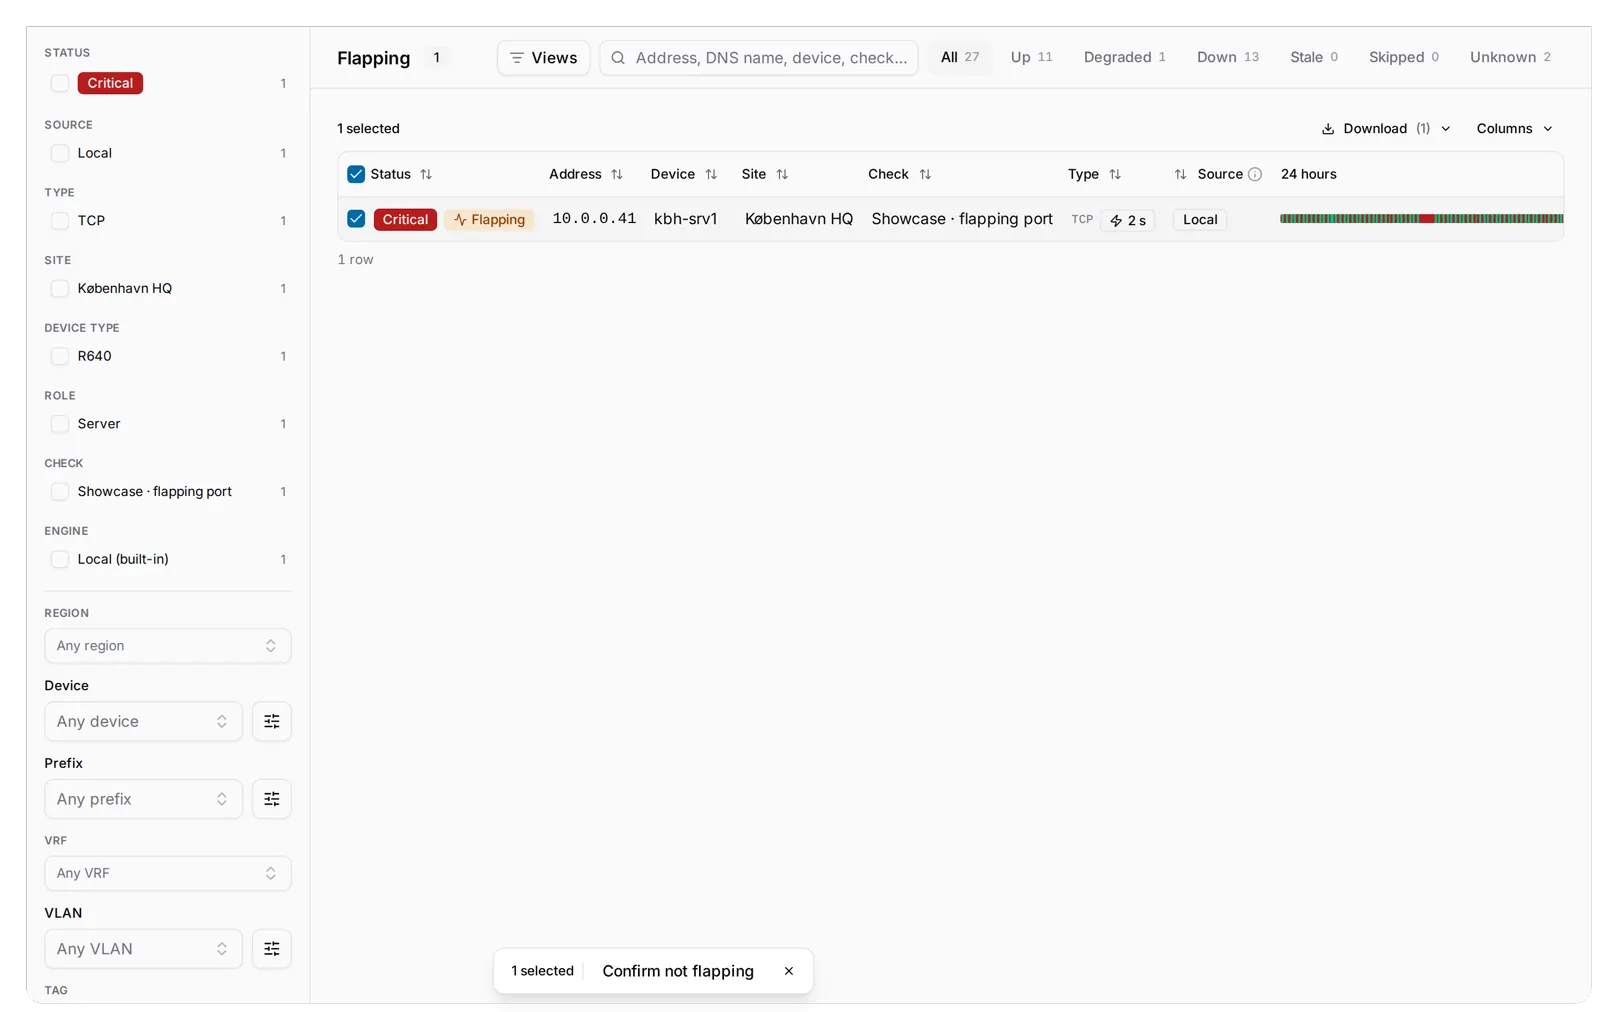 The Flapping tab with its one row ticked and the floating bar reading 1 selected · Confirm not flapping.
The widget, and the knobs
A Flapping dashboard widget lists the same checks, noisiest first, each with a chip reading bad changes over the window, 36 in 30 minutes here against a threshold of 5, and how long it has been flagged. It links to the tab; confirming happens there.
A tenant that would rather not be asked can tick Auto-clear flapping in Settings, Monitoring, with Quiet for defaulting to 30 minutes: a flagged check clears when it is both under the threshold and has been quiet that long. It is off by default, and an automatic clear writes no change-log entry; only an operator's confirm does. For churn that is expected, tick Ignore flapping on one address, or exclude whole IP statuses (a DHCP scope, say) from the flapping monitor in settings. Confirm says "we looked"; ignore says "we know". Excluded addresses still run their checks, keep their history and can still alert.
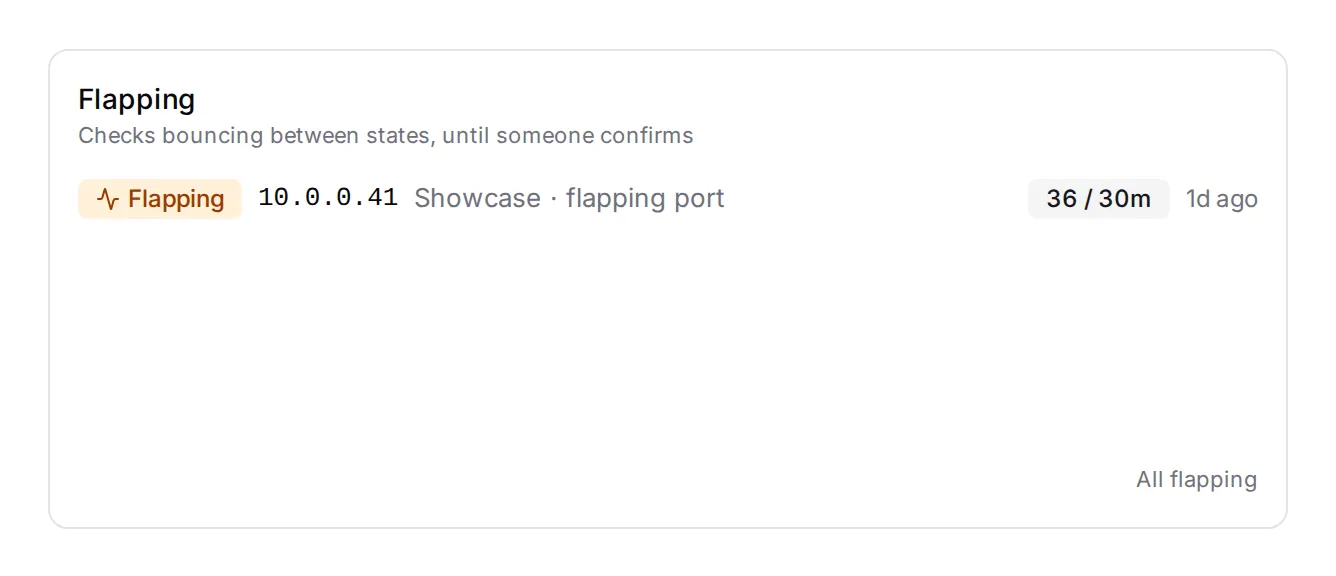
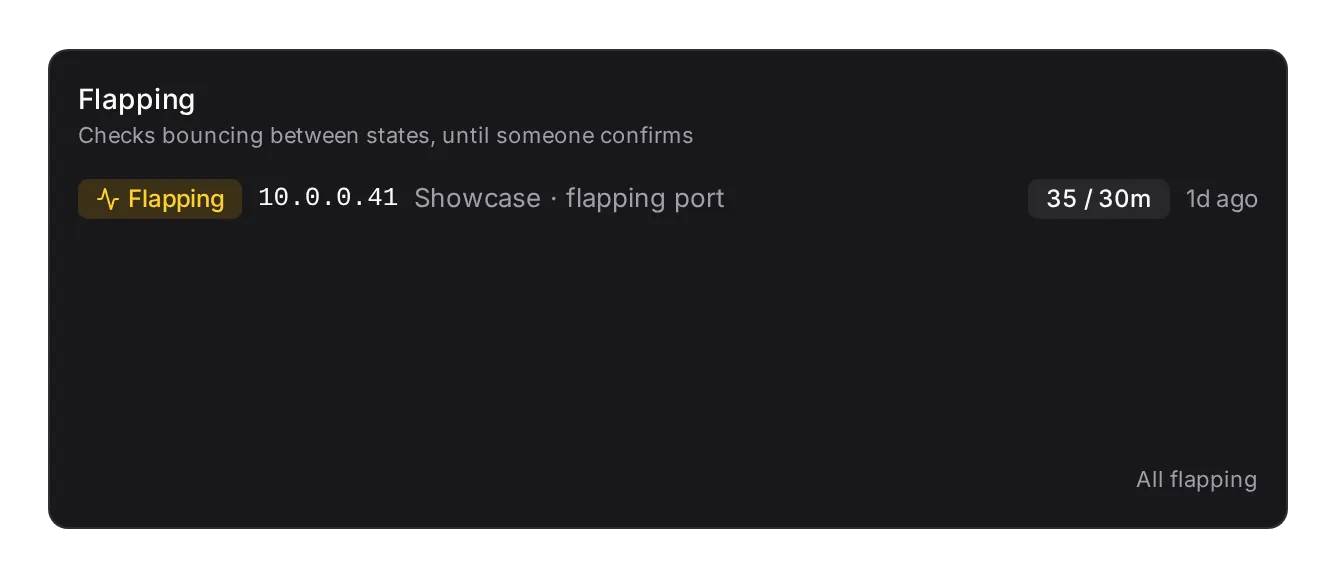 The Flapping widget: one row, 36 bad changes in the 30-minute window, flagged for a day.
The alert side reads the same state. An alert whose check is flapping is marked so and left alone by Renotify and Escalate until the check is confirmed clear or clears itself under Auto-clear. It stays firing and visible, it just stops re-sending, and the first notification is never suppressed. There is no second flap counter on the alert side to keep in step.
One more thing in the same header. Notify me on a prefix, an address or a device subscribes you, your account address, to that object's status changes with no channel to set up; the button reads Notifying you from then on, and a second click turns it off. The device-page button was broken; it sent an empty scope and was refused. It names the device now, and a device scope covers every address assigned to it.
Zabbix as a monitoring engine
Most estates that would consider Danbyte already run a Zabbix, and the two answer different questions. Danbyte knows what the estate is: devices, roles, sites, addresses, SNMP profiles. Zabbix knows what it is doing. 0.16.0 joins them without making either a copy of the other. Nothing is on until somebody turns it on, and reading Zabbix is a separate decision from writing to it.
flowchart LR
  INV[Danbyte inventory] -- "Provisioning: hosts, groups, templates, SNMP interface" --> ZH[Zabbix hosts]
  ZH -- "Zabbix check: problems by severity" --> ST[Danbyte status, alerts, channels]
  ZH -. "Read host status: panel and chips, never the status" .-> DEV[Device and address pages]
  ZH -- "Adopt hosts" --> INV
One server, one connection
Settings, Integrations, Zabbix monitoring is the tenant switch, off by default. On, a Zabbix page appears under Integrations. Add connection takes a name, the frontend URL, a named API token from Zabbix's own Users, API tokens (a login is not accepted), a TLS switch and the engines that read through it. Test reports the Zabbix version and how many hosts the token can see, so a token scoped to nothing is visible at once. Zabbix 6.0 or newer is required, and a Zabbix on an internal address has to be added to the outbound allow-list under Settings, Security first. Every switch on the card is readable without opening the form, and a second Zabbix server is a second card that never answers for the first.
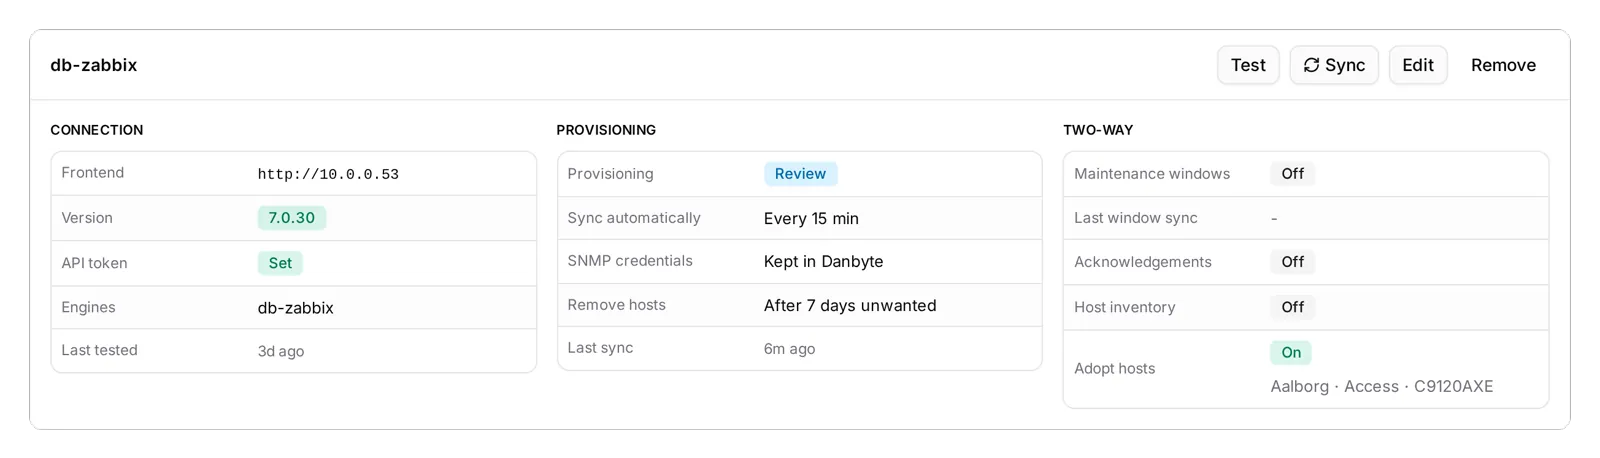 The connection card for db-zabbix: Connection, Provisioning and Two-way in three columns, every switch readable without opening the form.
Zabbix is a monitoring engine of kind Zabbix, alongside the built-in Local engine and Outposts. Create it under Governance, Monitoring engines, link it to a connection, and bind it to a device, a location or a site exactly as you would an Outpost. The device binding is new. Resolution per address runs device, location and its parents, prefix, site, tenant default, Local, and the most specific binding wins, so one switch can be Zabbix's while the rest of the building stays on Danbyte's workers. There is no "Zabbix mode". A driver engine answers its own kind only. A Zabbix engine claims Zabbix checks; an ICMP, SNMP, TLS or port check on a Zabbix-bound device still runs on Danbyte's workers.
"I want Zabbix watching this" is a check of kind Zabbix on an address, from a template and a policy or by hand. It is an ordinary check with an interval, history, hysteresis, alert rules and silences; the only Zabbix-specific thing is where the verdict comes from. Each poll matches the address to a Zabbix host interface and reads that host's live problems. No unresolved problems is up; problems are mapped by severity, worst wins; a host disabled in Zabbix, in a maintenance window, unknown to Zabbix, or shared by two hosts is unknown. Unknown is never treated as down; a host Zabbix has never heard of is unmonitored, which is a different thing from off. The severity map is per connection, defaulting to Not classified and Information as up, Warning and Average as degraded, High and Disaster as down, and it shows Danbyte's states under the names your statuses give them. Results then go through the same path an Outpost's do: alert rules, silences, flapping, escalation, every channel, the site map, topology, faceplates and the dashboard.
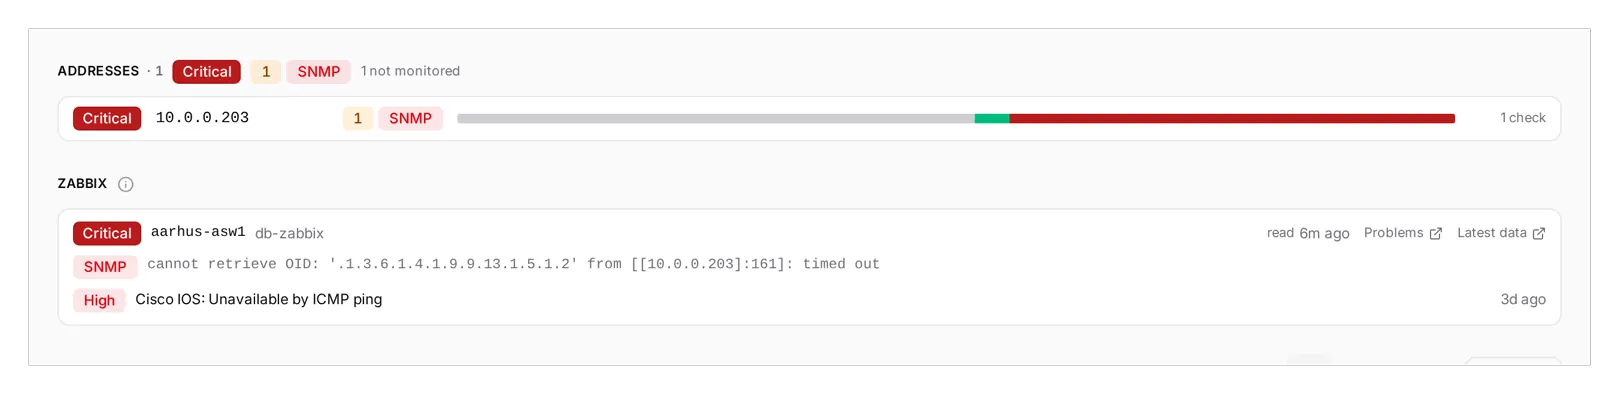 aarhus-asw1's Monitoring tab: the roll-up reads Critical with a problem count and a red SNMP chip, and the Zabbix card below carries Zabbix's own words: the SNMP OID that timed out, and the open High problem, Cisco IOS: Unavailable by ICMP ping.
That card is there whether or not a check exists. With Read host status on, the one thing in this integration that is on by default, Danbyte reads each linked host's open problems and per-protocol reachability every five minutes, two read-only calls per pass, and shows them on the device's Monitoring tab, on its addresses' tabs and as chips on the device Overview beside the roll-up badge. It never changes Danbyte's status; only a check does. A device can be Up in Danbyte because its ping answers and carry a High problem here, and both are shown. The SNMP line is the useful one: nothing in Danbyte's own view would tell you the community string is wrong.

 The Zabbix card on a broken host: the mapped severity, Zabbix's exact SNMP error, the open problem, and links to Problems and Latest data in Zabbix.
 The same card on a healthy address: Up, read 3m ago, No open problems. A row says only what it knows.
Provisioning, adoption and the review queue
Danbyte already knows every device's name, address, site, serial and SNMP profile; somebody has usually typed all of that into Zabbix by hand. Provisioning writes it for them, and writes little: name, interface addresses, host group, serial, and the templates your rules ask for. Items and triggers stay Zabbix's. It has three modes on the connection: Off, the default, where Danbyte writes nothing and does not read the host list; Review, where every change is proposed and nothing is written until approved; and Auto, the same planning pass, applied. What runs automatically is exactly what you would have approved.
Matching an existing host goes most reliable first and stops at the first unambiguous hit: a stored link, an interface address, the inventory serial, the exact name. Serial beats name because it survives both a rename and a re-addressing. Two candidates at a level is a decision for a person, raised as a row. Provisioning rules apply to a manufacturer, role, device type, platform, site or every device, and name the templates, host groups and proxy; rules stack, so a device gets the union of every matching rule, except the proxy, where the most specific wins. Danbyte only ever adds a template or group; a rule that stops matching strips nothing. When a device resolves to an SNMP profile its host gets an SNMP interface naming {$SNMP_COMMUNITY}, and a separate switch, off by default, writes the community or v3 passphrases as Zabbix secret macros, only where the macro is absent. The community string is never on the interface. Remove unwanted hosts is a third switch with a seven-day grace period, and it touches only hosts Danbyte itself created.
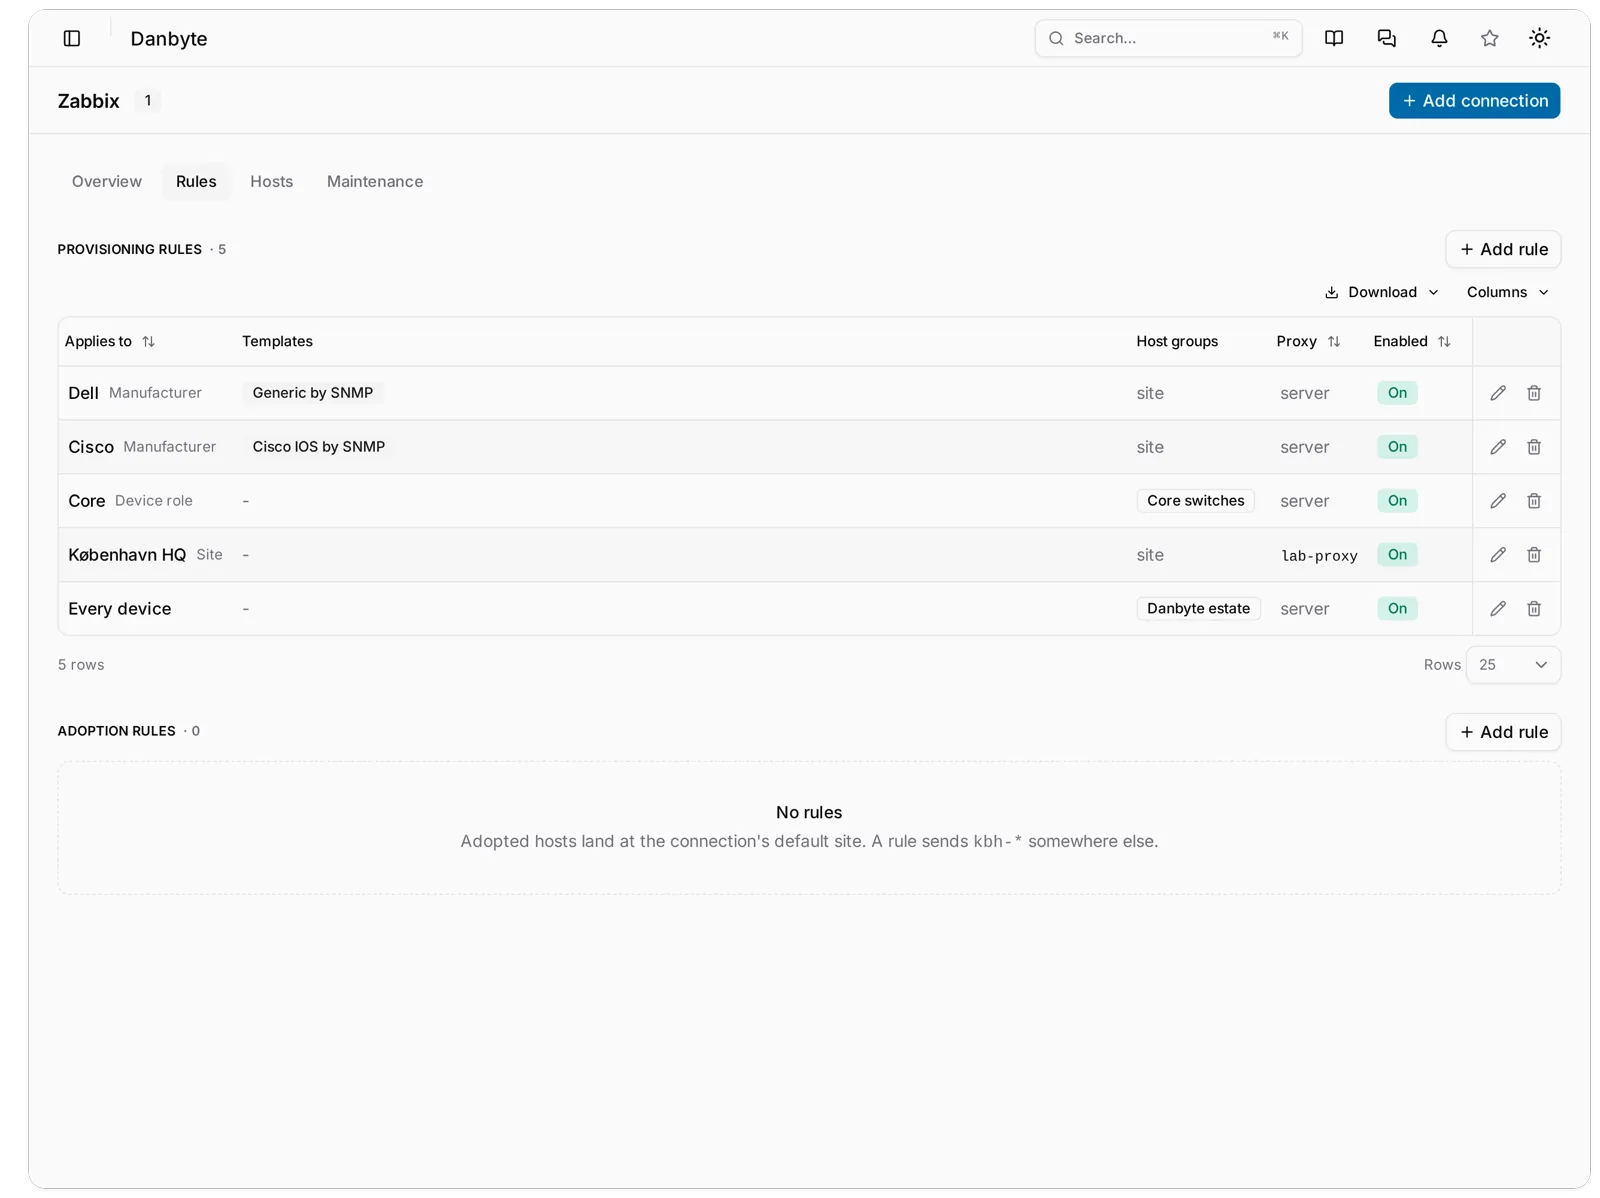 Five provisioning rules instead of one list per model: Dell and Cisco by manufacturer, Core by role, København HQ through lab-proxy, and Danbyte estate for every device. Adoption rules below, still empty.
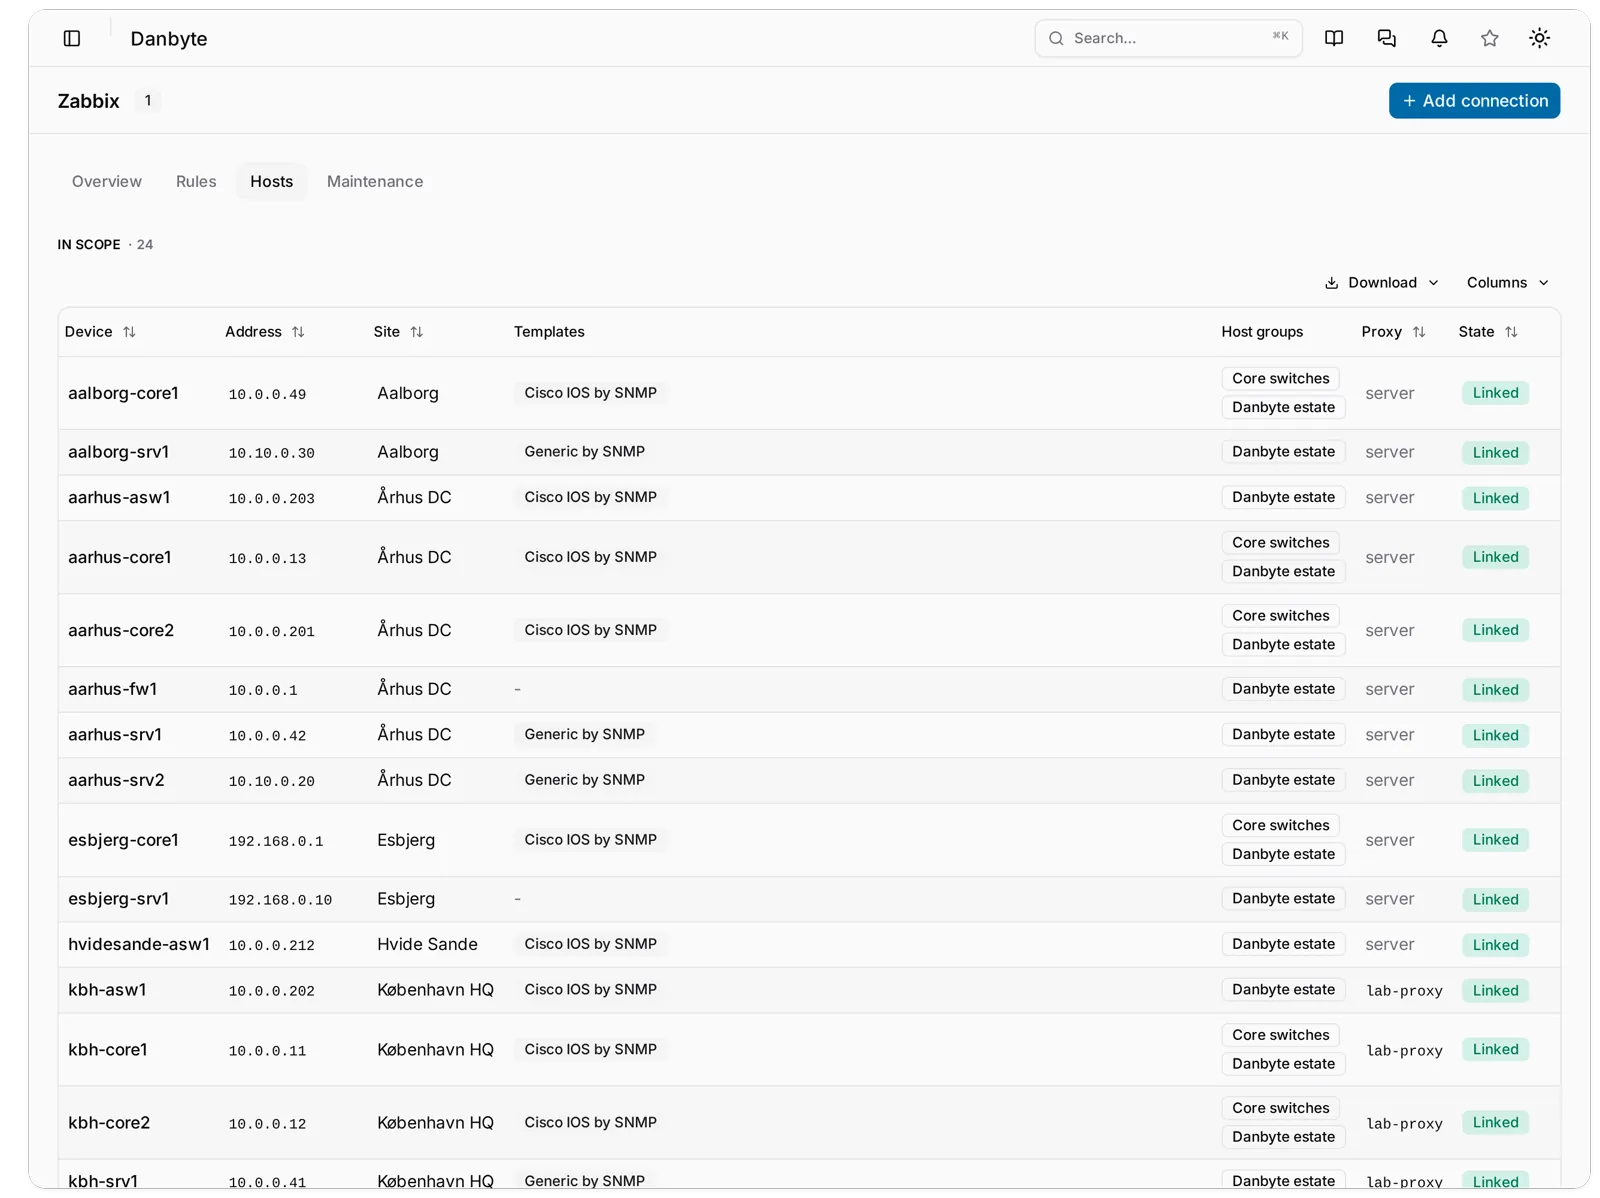 The Hosts tab: 24 devices in scope, with the templates, groups and proxy the rules resolve to for each. Derived state that nothing renders is state nobody can trust.
By default the scope follows the checks: anything with a Zabbix check is in scope, because the check is the statement that you want Zabbix watching it. The other choice, Every device the rules match, is for the shop that trusts Danbyte's inventory and Zabbix's collectors: Danbyte keeps doing its own pinging, discovery, TLS and port checks and simply keeps Zabbix's host list in step with the inventory. No special mode is needed for that hybrid, because a Zabbix engine claims only Zabbix checks.
Adoption is the other way in. With Adopt hosts on, a Zabbix host no device of yours answers to can become a device from the same review queue, with what the host says about itself: name, serial, the address from its SNMP interface, a site from the first host group naming one of yours, and the device type from the inventory model if you have one by that name. Adoption rules place hosts by name, group or address when one default site is not enough: kbh-* to København, regex:^odense- to Odense, a CIDR to a site, one rule each; first match wins and a rule sets only what it names. An adopted device is not automatically watched by Zabbix in Danbyte; that is still a check on its address.
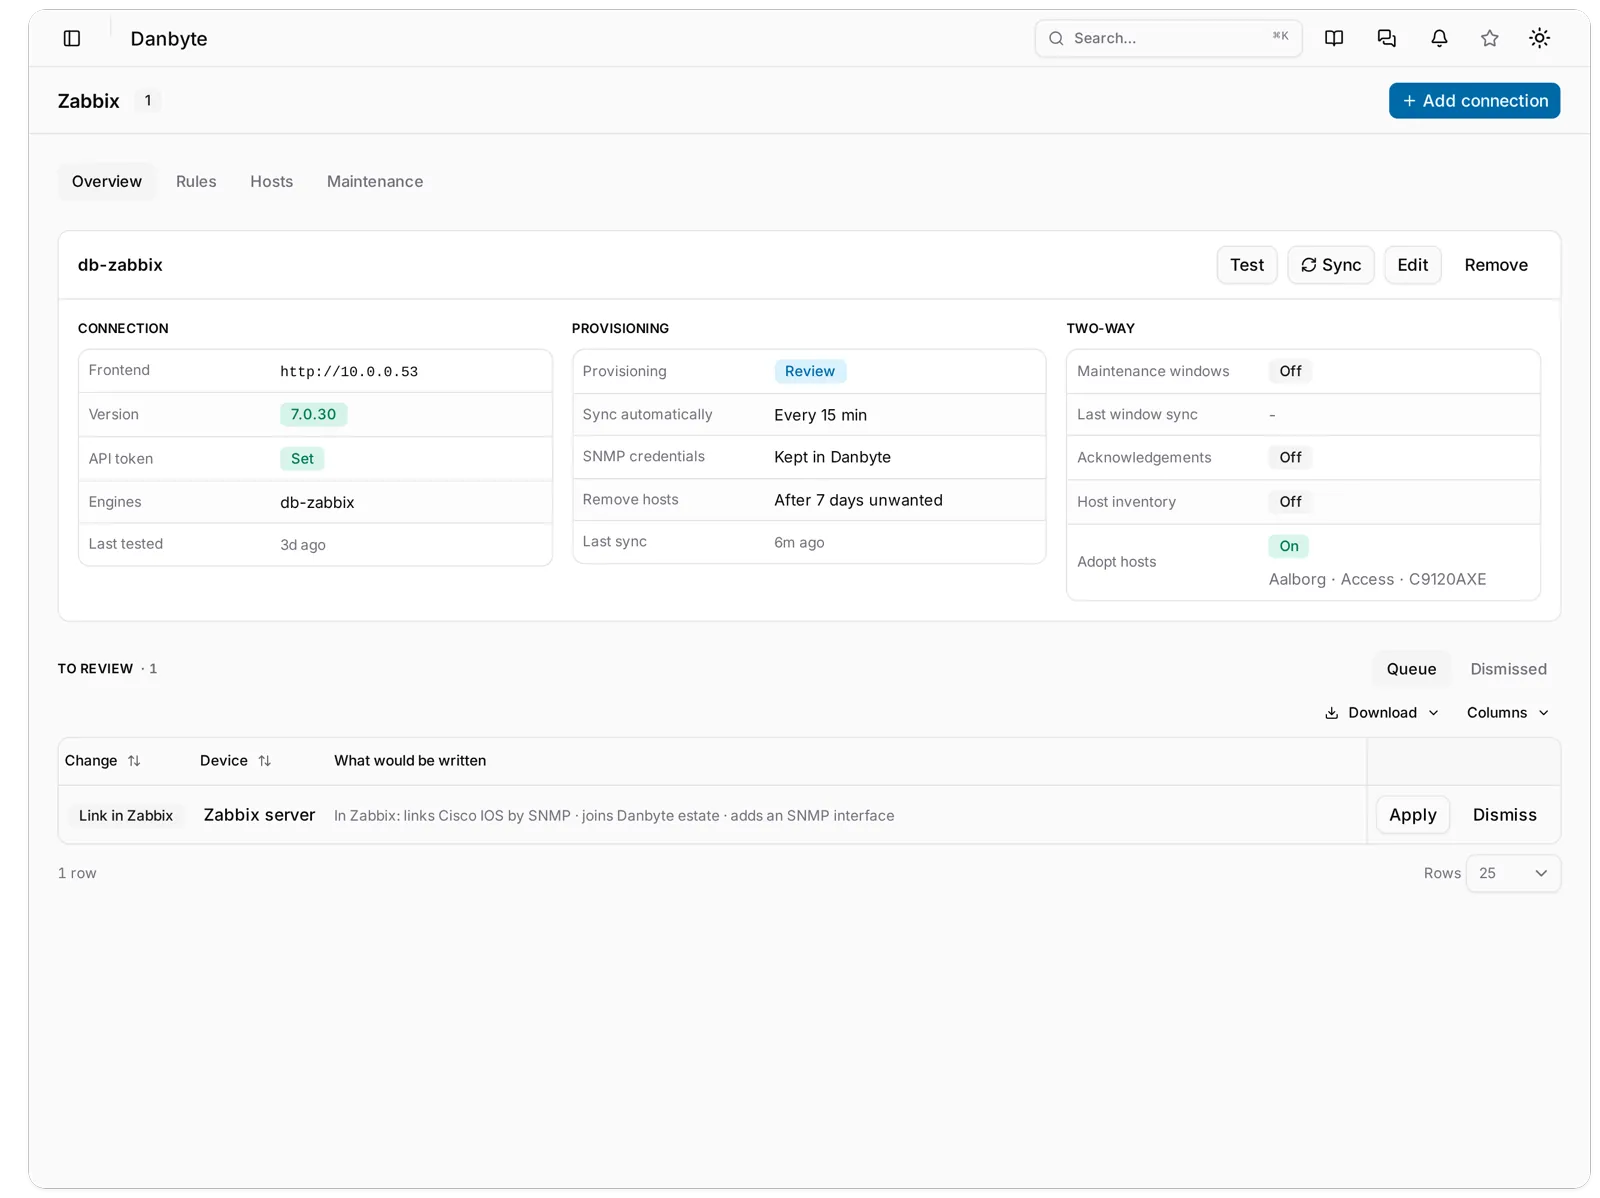
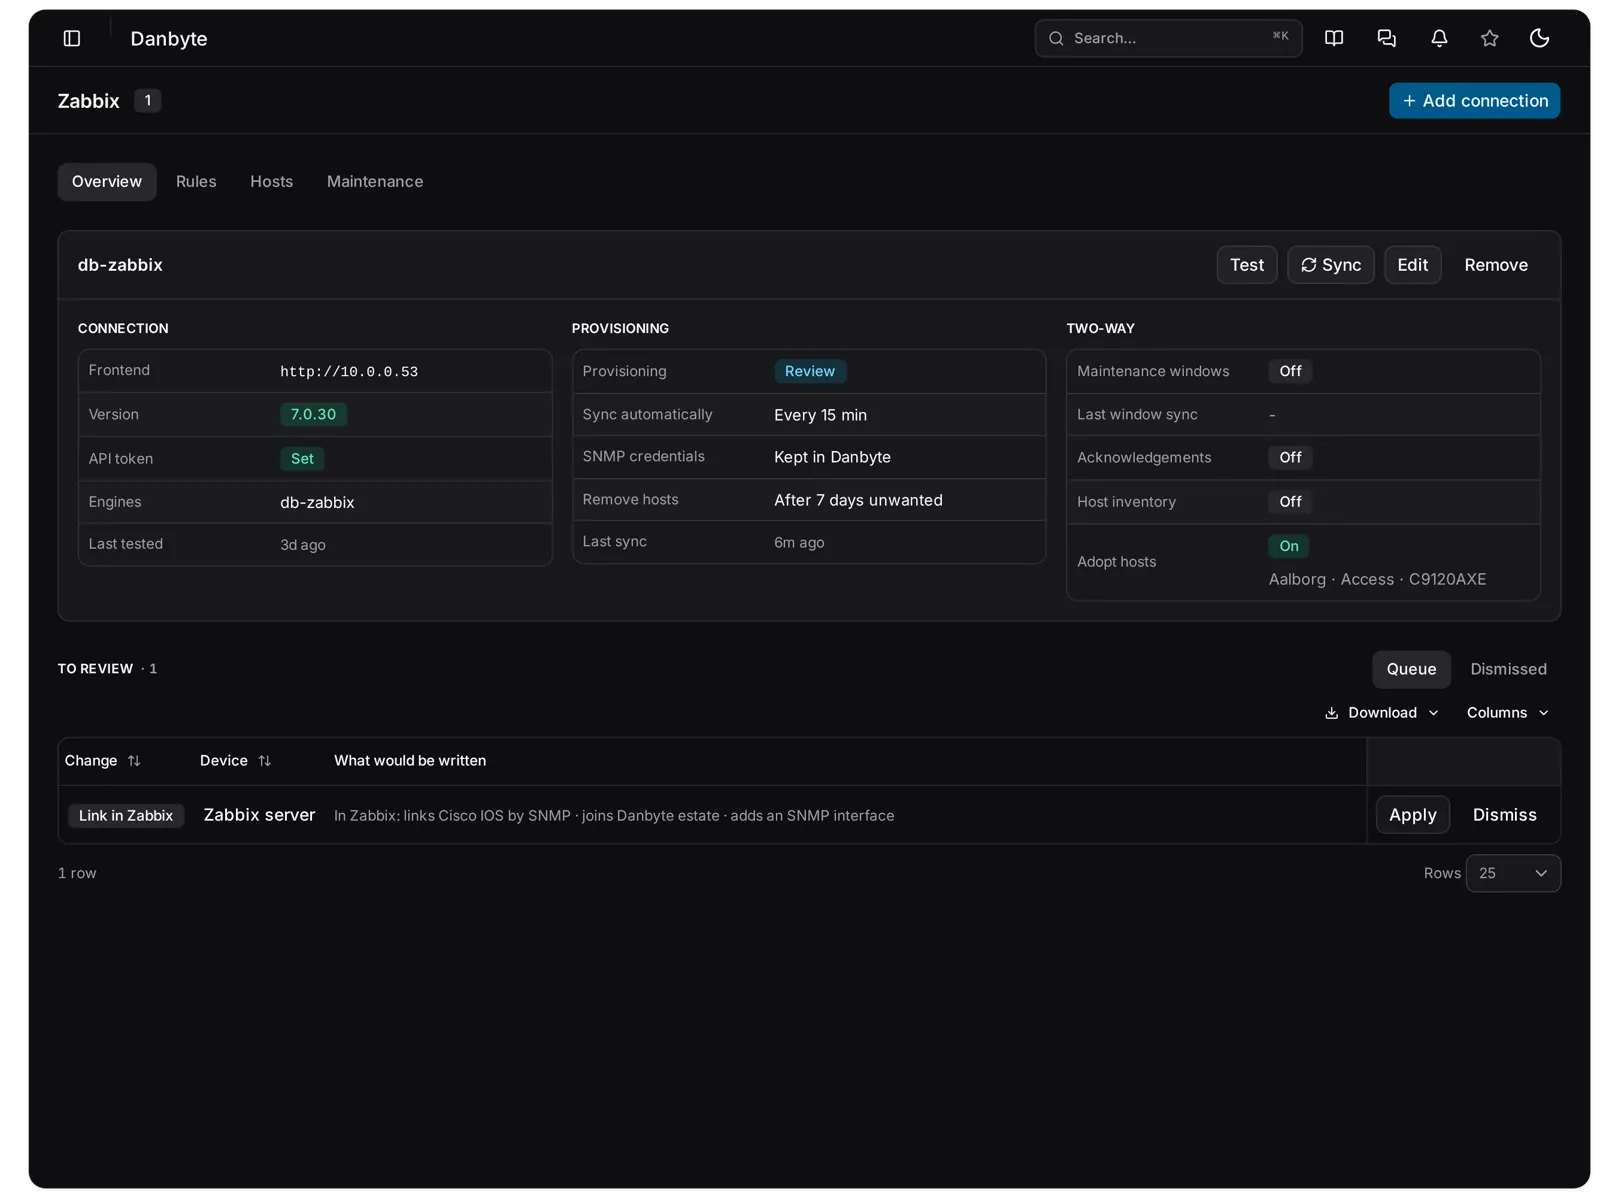 The Zabbix page in Review mode: the db-zabbix connection card, and under it one proposal, Link in Zabbix for the device Zabbix server, spelled out as links Cisco IOS by SNMP, joins Danbyte estate, adds an SNMP interface, with Apply and Dismiss.
Every proposal names the system that changes, because a host group called Danbyte estate beside a bare Create host read as creating something in Danbyte. The kinds are Create in Zabbix, Update in Zabbix, Link in Zabbix, Needs a decision, Remove from Zabbix and Adopt into Danbyte. Apply does that one write; Dismiss keeps it from being raised again and can be restored; applying a Remove from Zabbix asks first, because it deletes the host, its items and its history in Zabbix. Unlink on the Linked hosts list is the one manual act and touches nothing in Zabbix. Danbyte is not a Zabbix frontend: no graphs, no item history, no trigger editor. It reads the verdict, and it writes only what you told it to.
Routing, modelled
Request #28 was the oldest open issue on the tracker: BGP objects with group-level inheritance and a device page that shows them. 0.16.0 closes it, and goes a fair bit further. Danbyte now models how a device forwards: static routes; BGP instances, address families, peer groups and sessions; OSPF, IS-IS and EIGRP with the interfaces enrolled in them; the policy objects every protocol shares (prefix lists, communities, community lists, AS-path lists, routing policies, keychains, BFD profiles); and the EVPN/VXLAN overlay on top of the L2VPNs that already existed, as a VTEP per device carrying VNIs. All of it lands in the device's config template as a routing block, so one template renders the whole box, and it rides the Ansible inventory.
The pictures come from an opt-in demo fabric (make seed-fabric): two spines and four leaves in AS 65100 at a site called dc-fra-01, an IS-IS underlay, iBGP EVPN from every leaf to the two spine route reflectors, three L2VNIs and one L3VNI for the VRF TENANT-A.
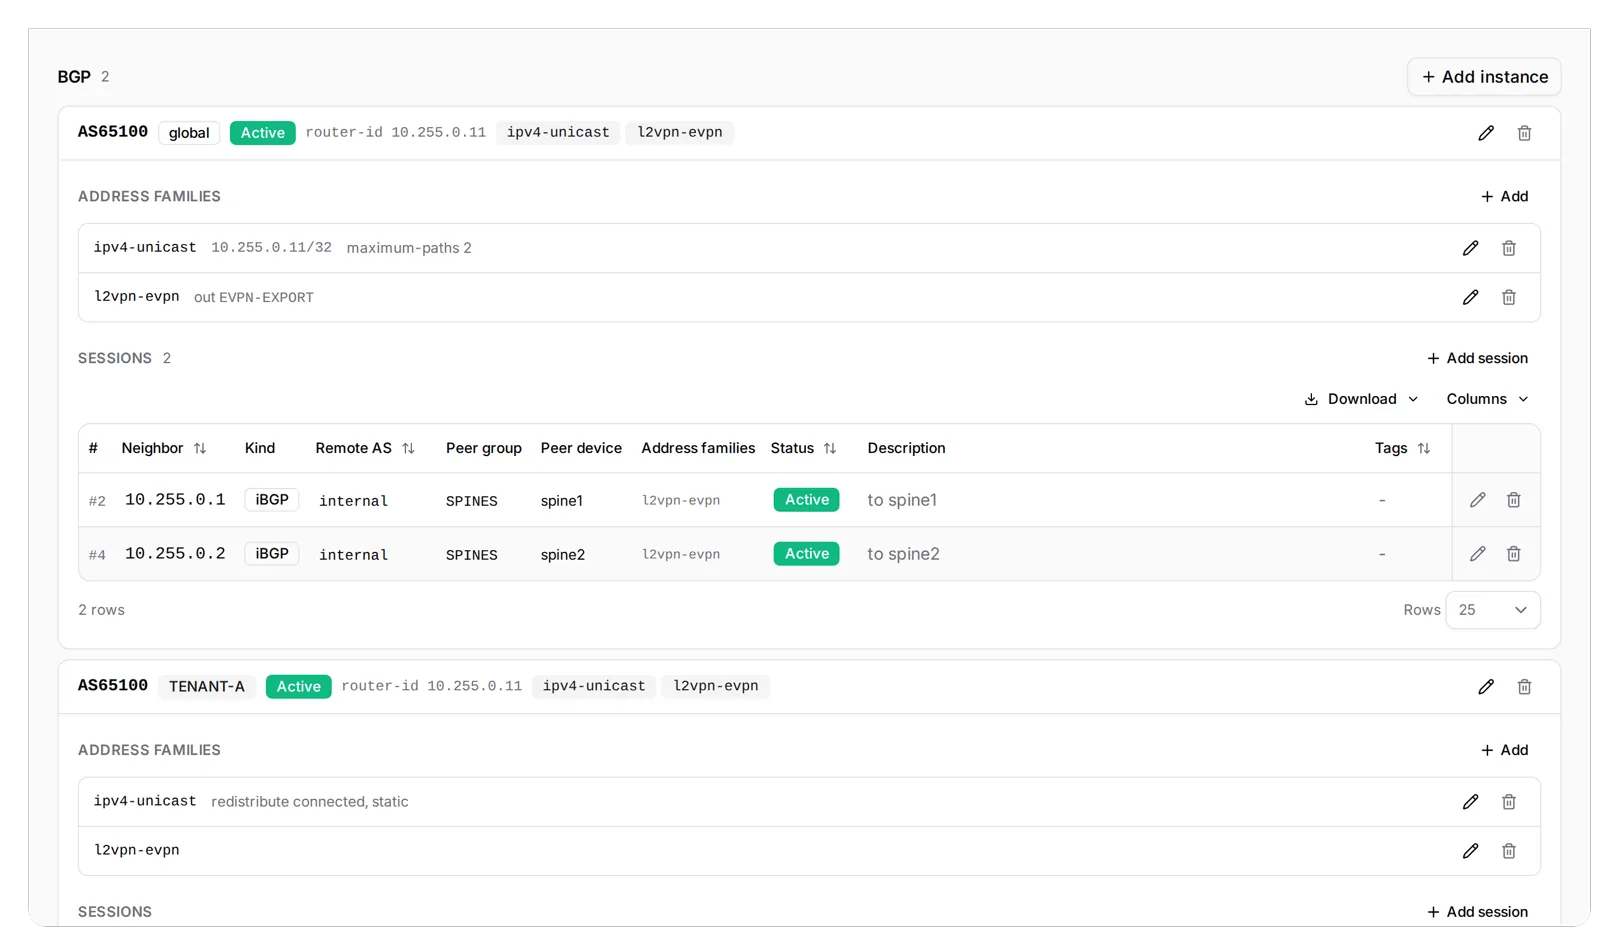
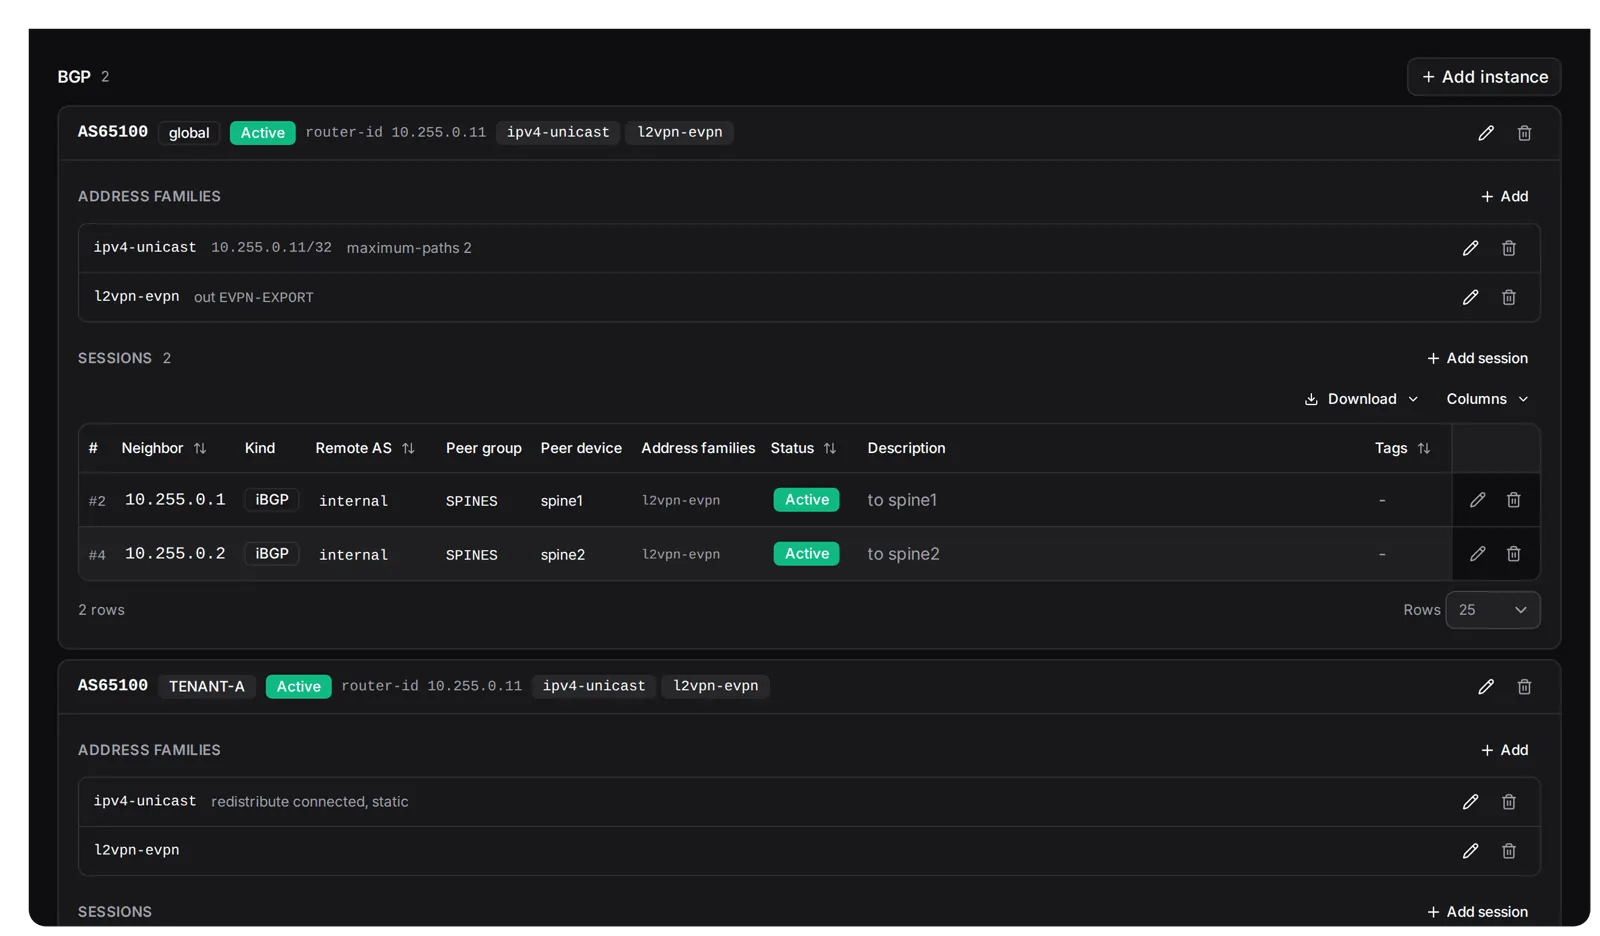 leaf1's Routing tab: two BGP cards, one for the global table and one for VRF TENANT-A, each with its address families and its sessions to spine1 and spine2 through the peer group SPINES.
Routing is a new top-level category in the sidebar, grouped by protocol: BGP, OSPF, IS-IS, EIGRP, EVPN / VXLAN, Static, Policy and Profiles. Every list is fleet-wide with the usual filters, saved views, CSV import and export and bulk delete. Catalogs are tenant-wide and instances are device-bound: a policy, a prefix list, a keychain, a BFD profile, a peer group or an OSPF area is defined once per tenant, while a protocol instance, a session, an enrolled interface, a static route or a VTEP belongs to one device and is site-scoped through it. A device's Routing tab carries everything on that box, and you add from there, a session, an address family, an interface, a VNI, without leaving the device.
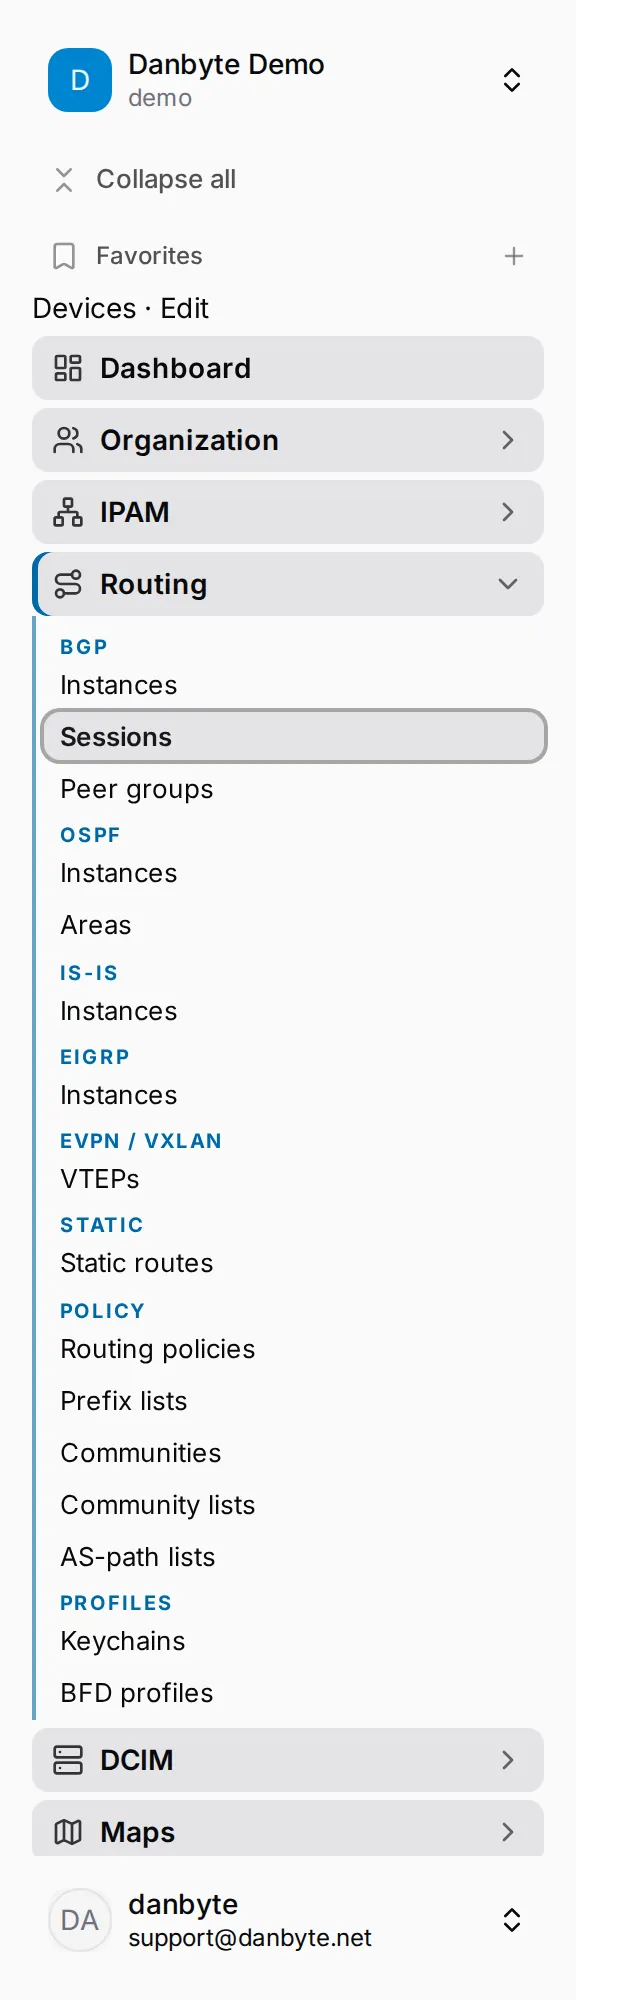 The sidebar with Routing open: BGP, OSPF, IS-IS, EIGRP, EVPN / VXLAN, Static, Policy and Profiles.
Sessions inherit, and the page shows what wins
A BGP session's knobs are all nullable: address families, import and export policy, BFD and its profile, eBGP multihop, next-hop-self, route reflector client, send-community, timers, keychain, default-originate, maximum-prefix, allowas-in, AS override, remove-private-AS, soft reconfiguration. A blank one comes from the peer group, and a blank one there comes from the instance. The API returns the stored values and an effective block, and the session page shows both side by side, with Inherit where nothing is set locally. What the box will run is on the page instead of being implied by three levels of settings. Every session also knows whether it is iBGP or eBGP from its two ASNs.
flowchart LR
  I[BGP instance<br/>AS · VRF · router-id] --> G[Peer group<br/>SPINES]
  G --> S[Session<br/>10.255.0.1]
  S -. blank knob .-> G
  G -. blank knob .-> I
  S ==> E[Effective settings<br/>what the template renders]
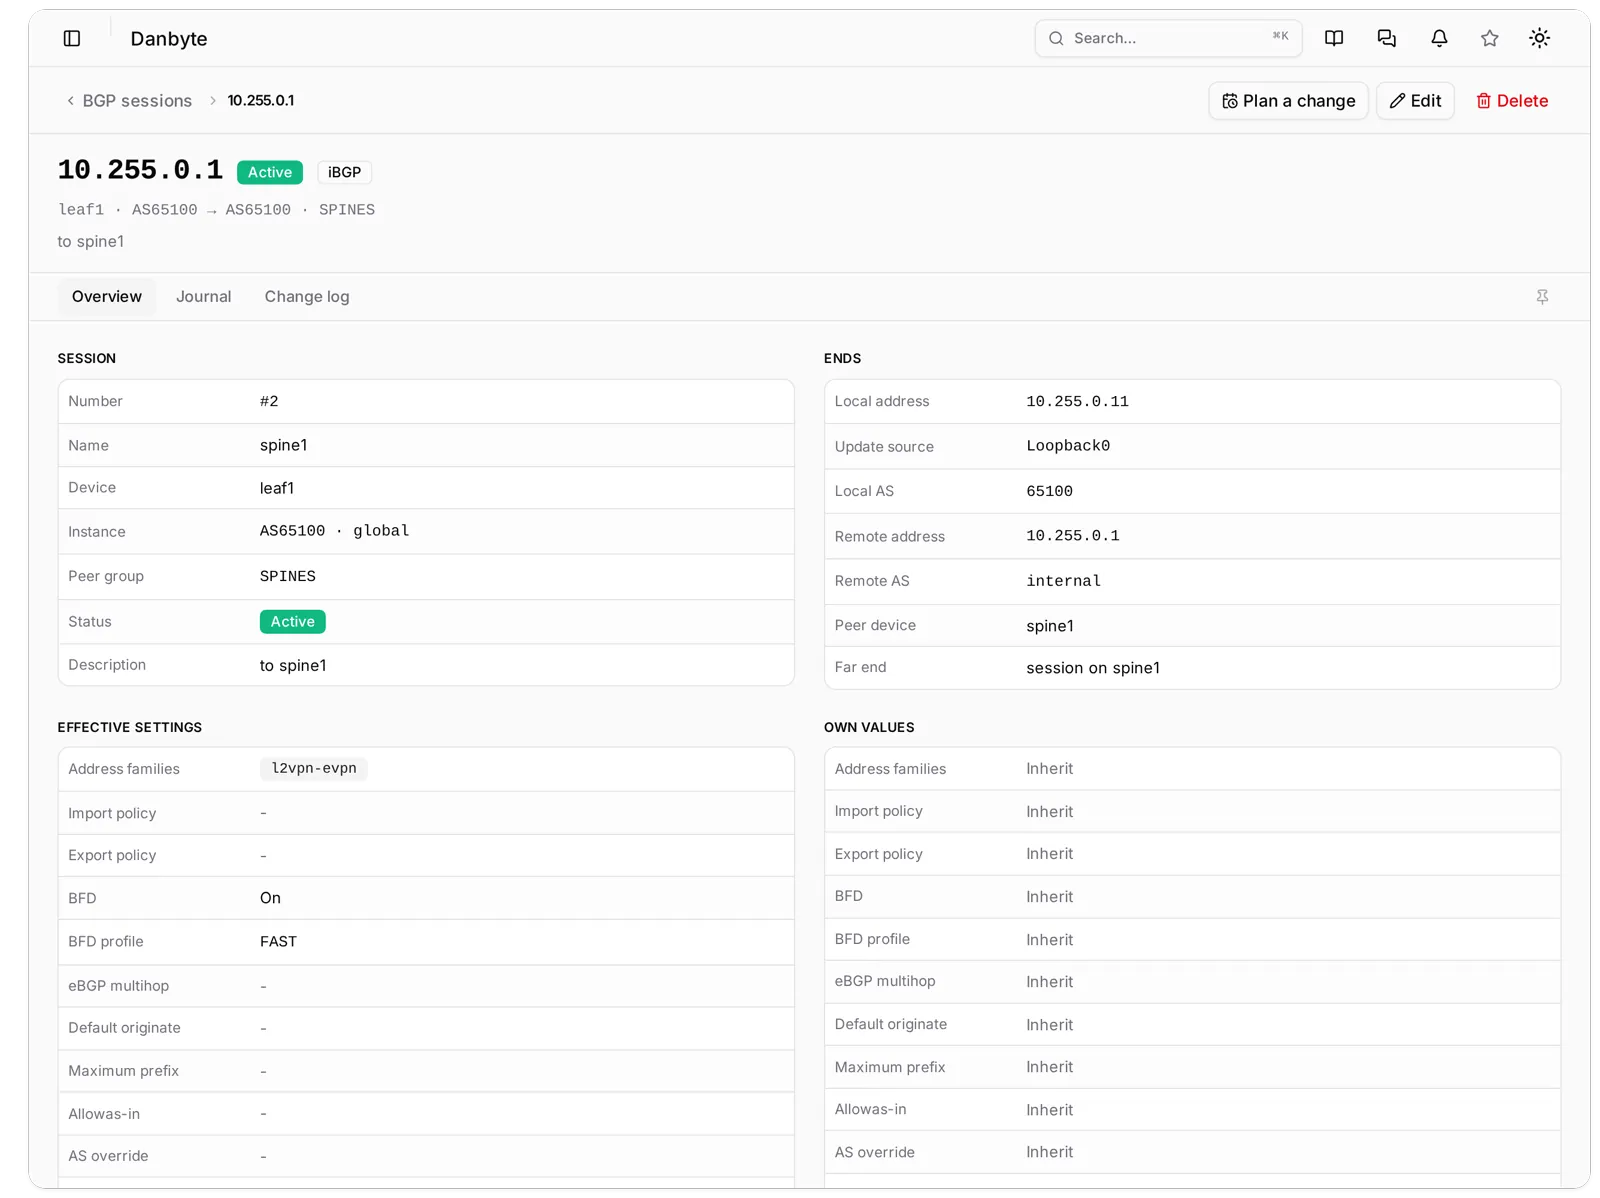
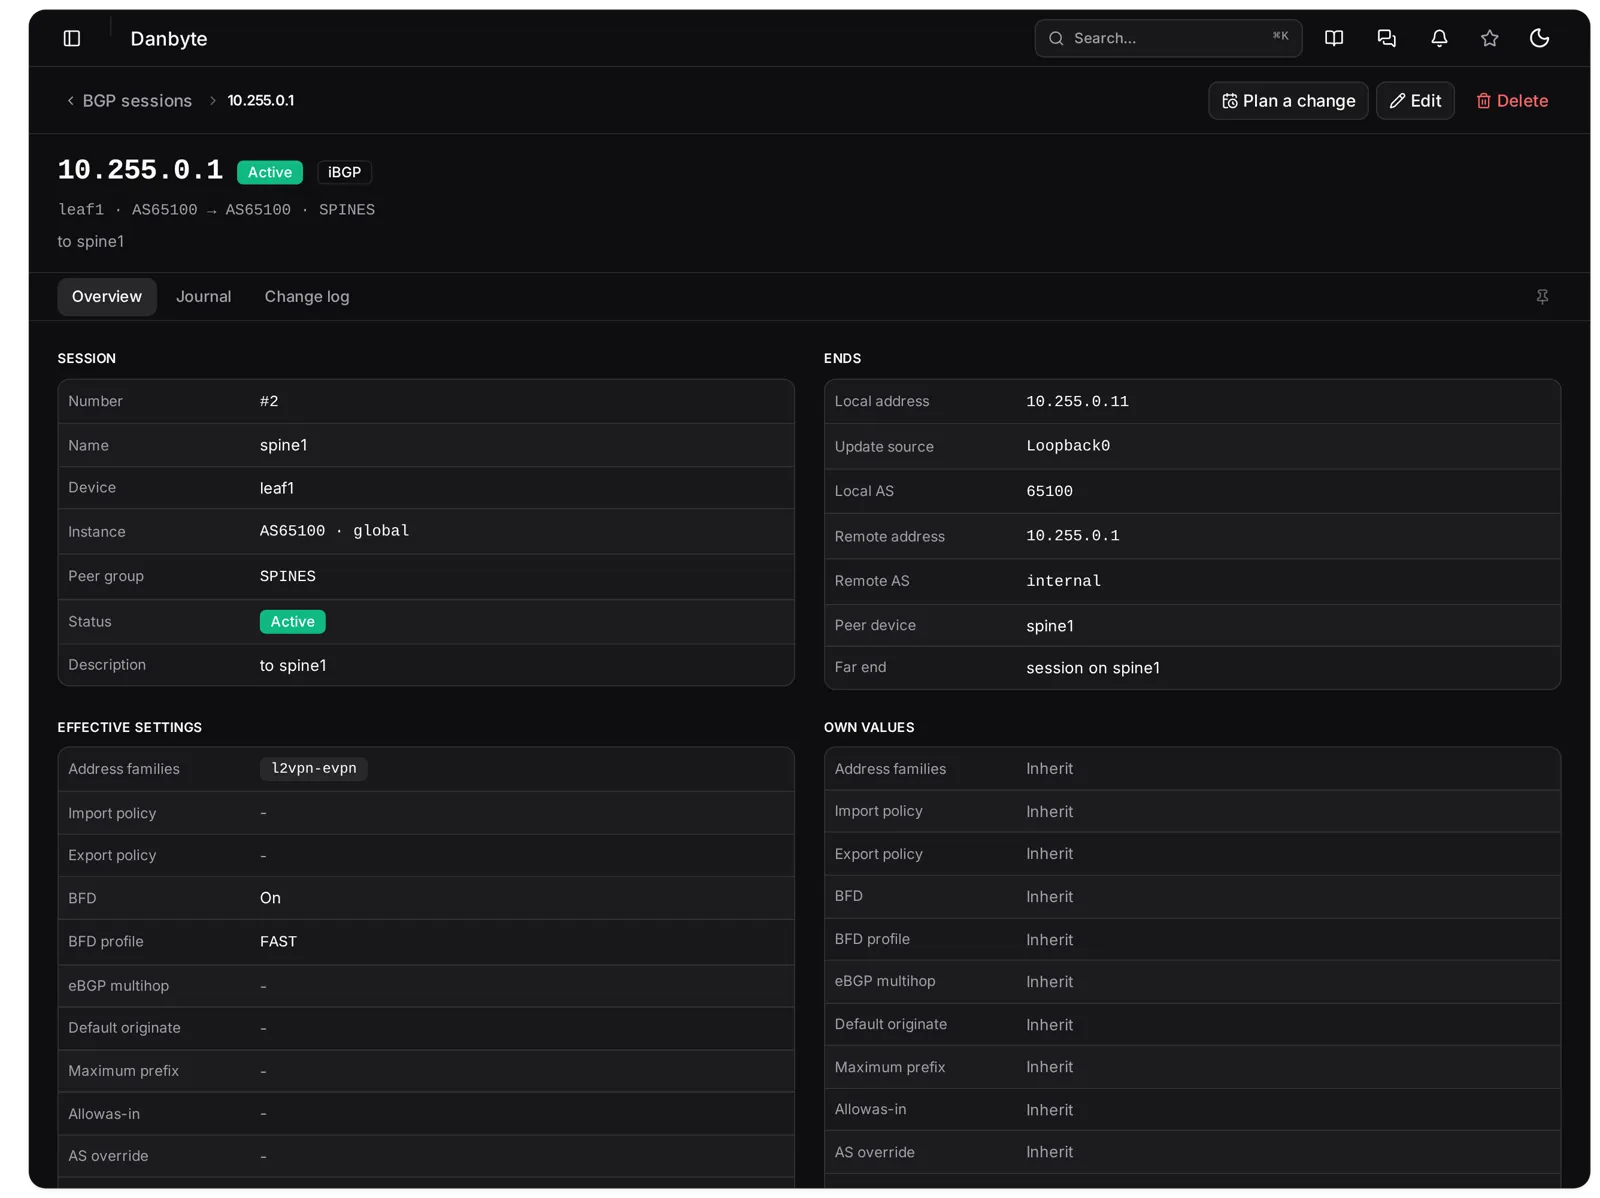 The session leaf1 to spine1: Session and Ends on top, then Effective settings (l2vpn-evpn, BFD on with the FAST profile) beside Own values, where every row reads Inherit.
On a session with a peer device, Create the far end writes the mirror session on the other box, addresses and ASNs swapped, links the two in one transaction, and both pages then point at each other. A session can be an interface rather than an address, for unnumbered peering in the FRR style. Peer groups carry the shared settings, and a peer group's page has a Sessions tab listing everything that inherits from it.
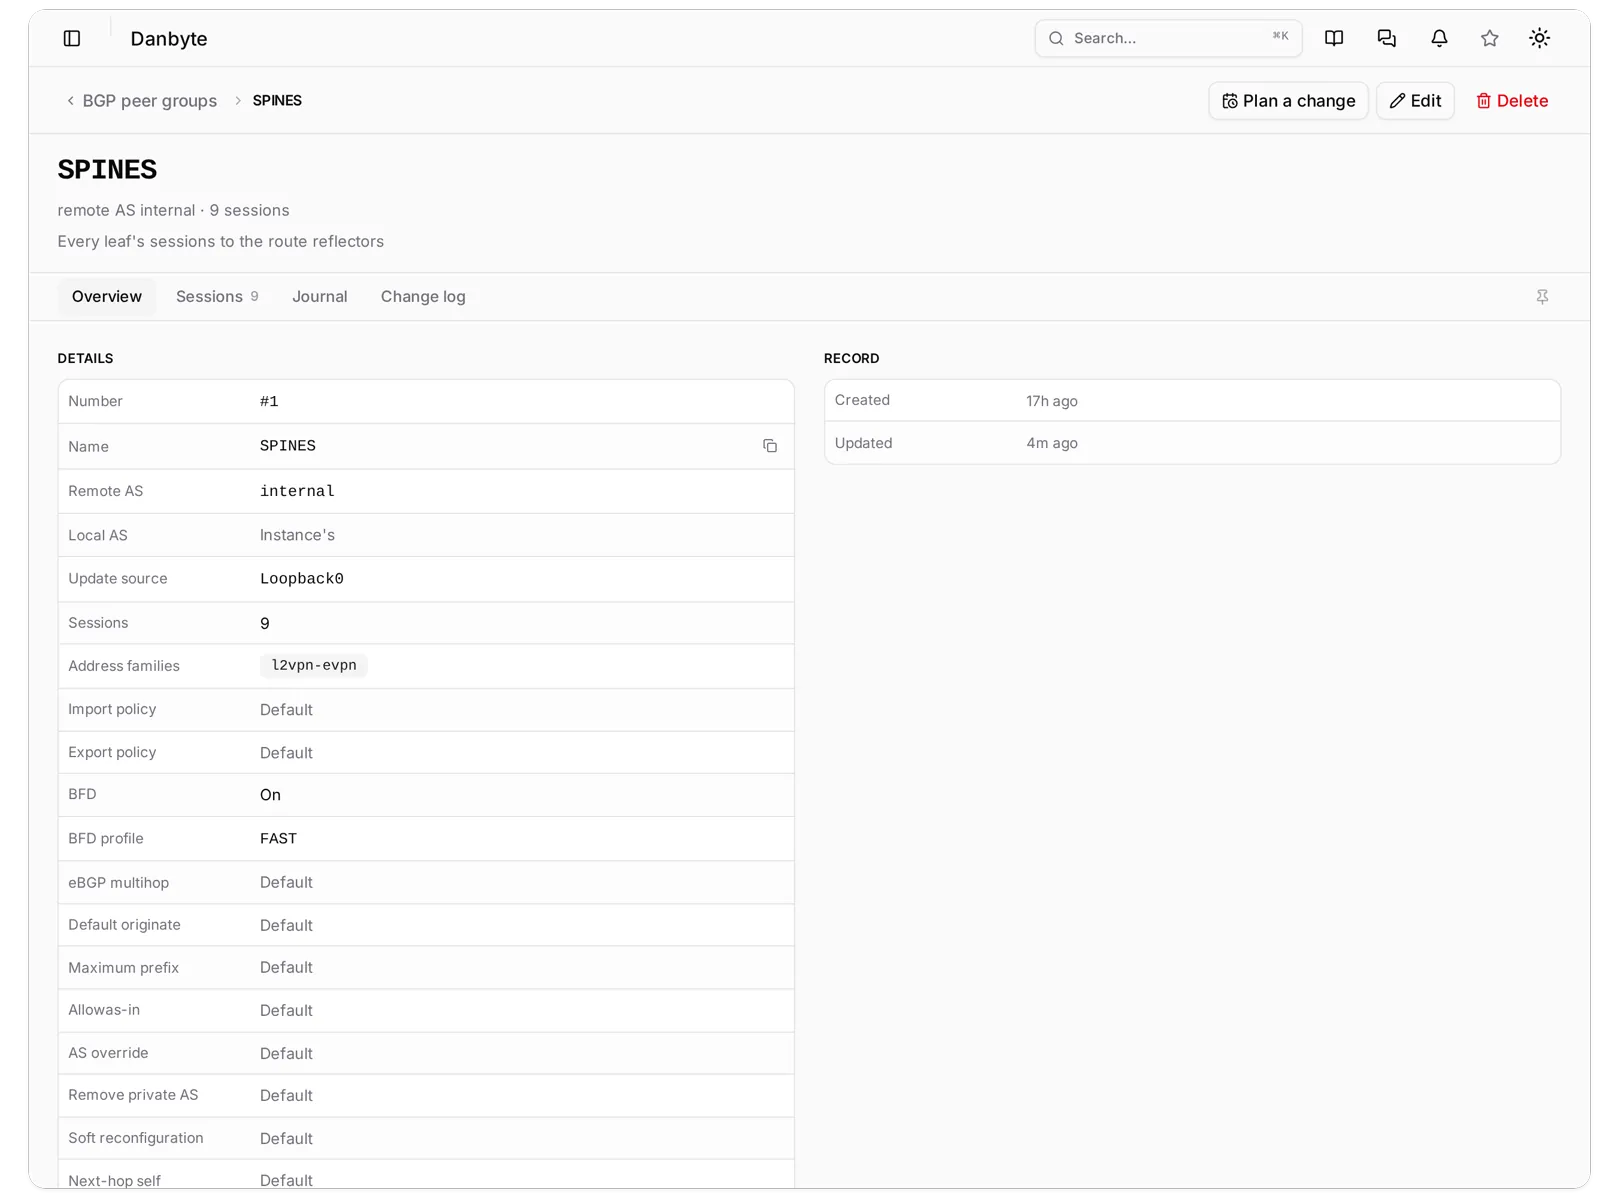
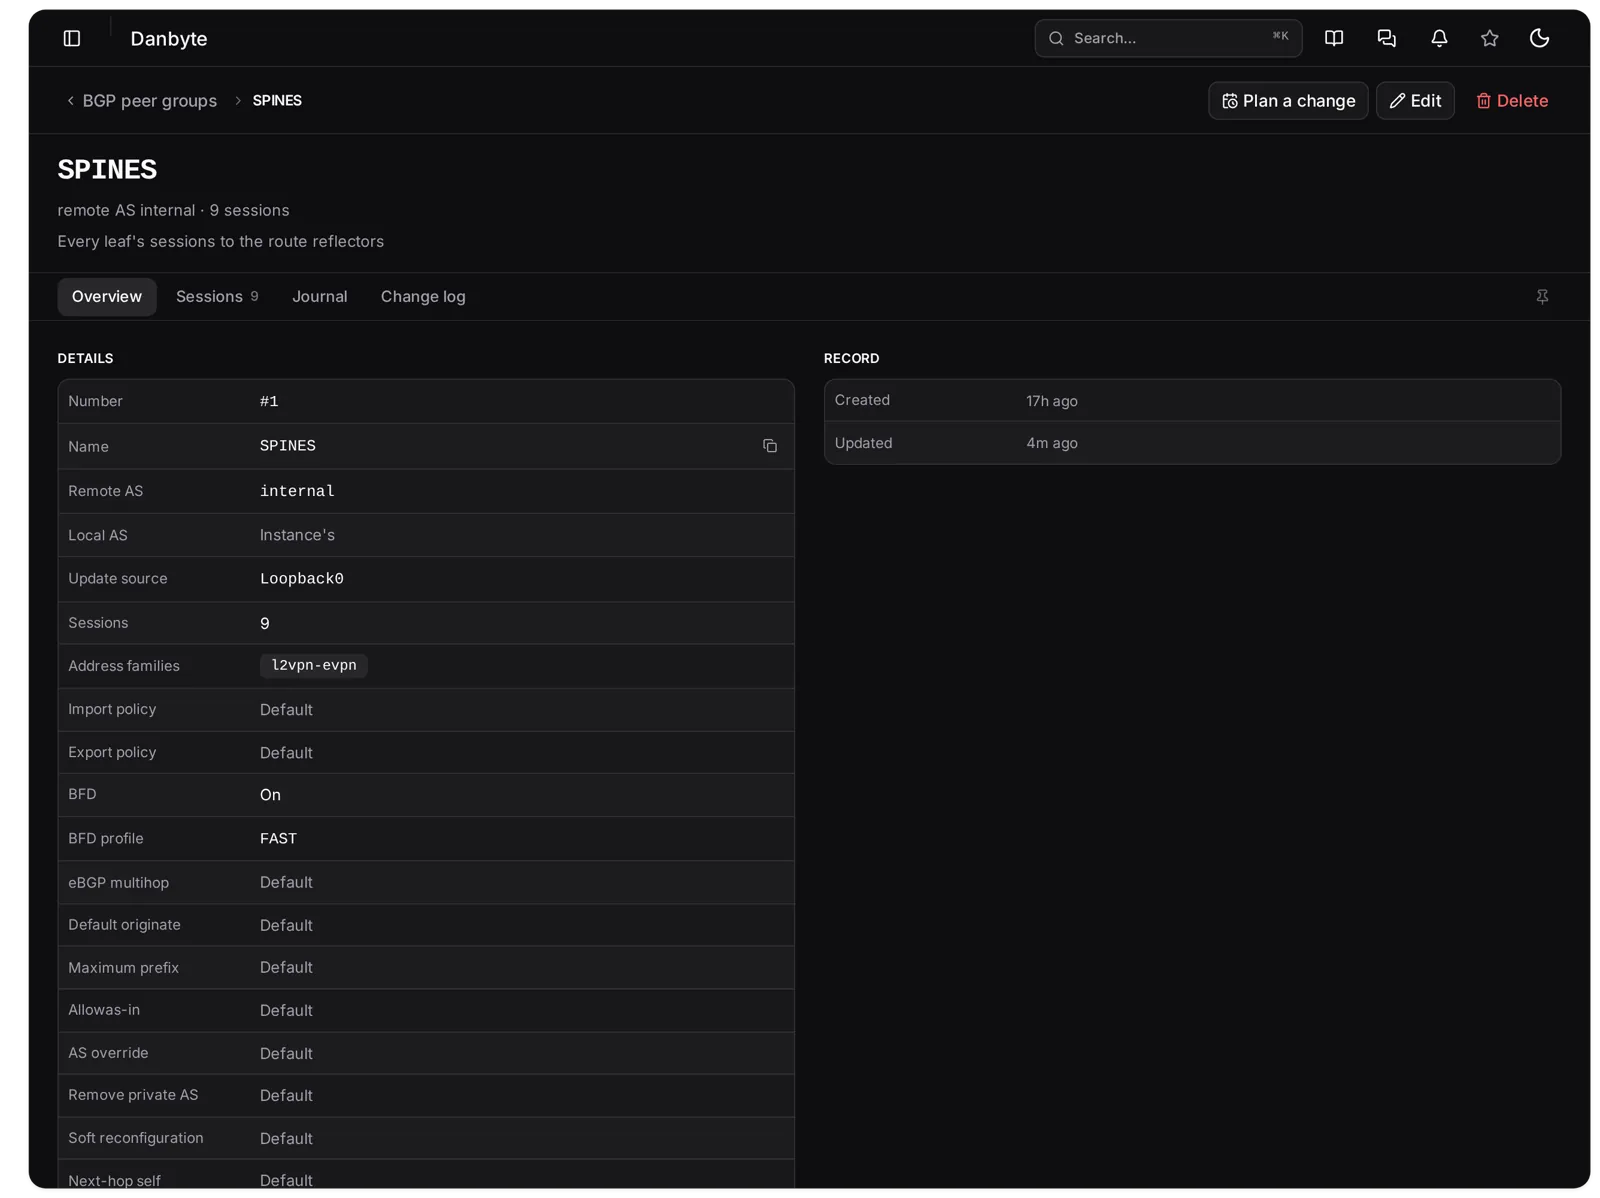 The peer group SPINES: remote AS internal, l2vpn-evpn, BFD on with FAST, send-community both, and a Sessions tab with the eight sessions that inherit from it.
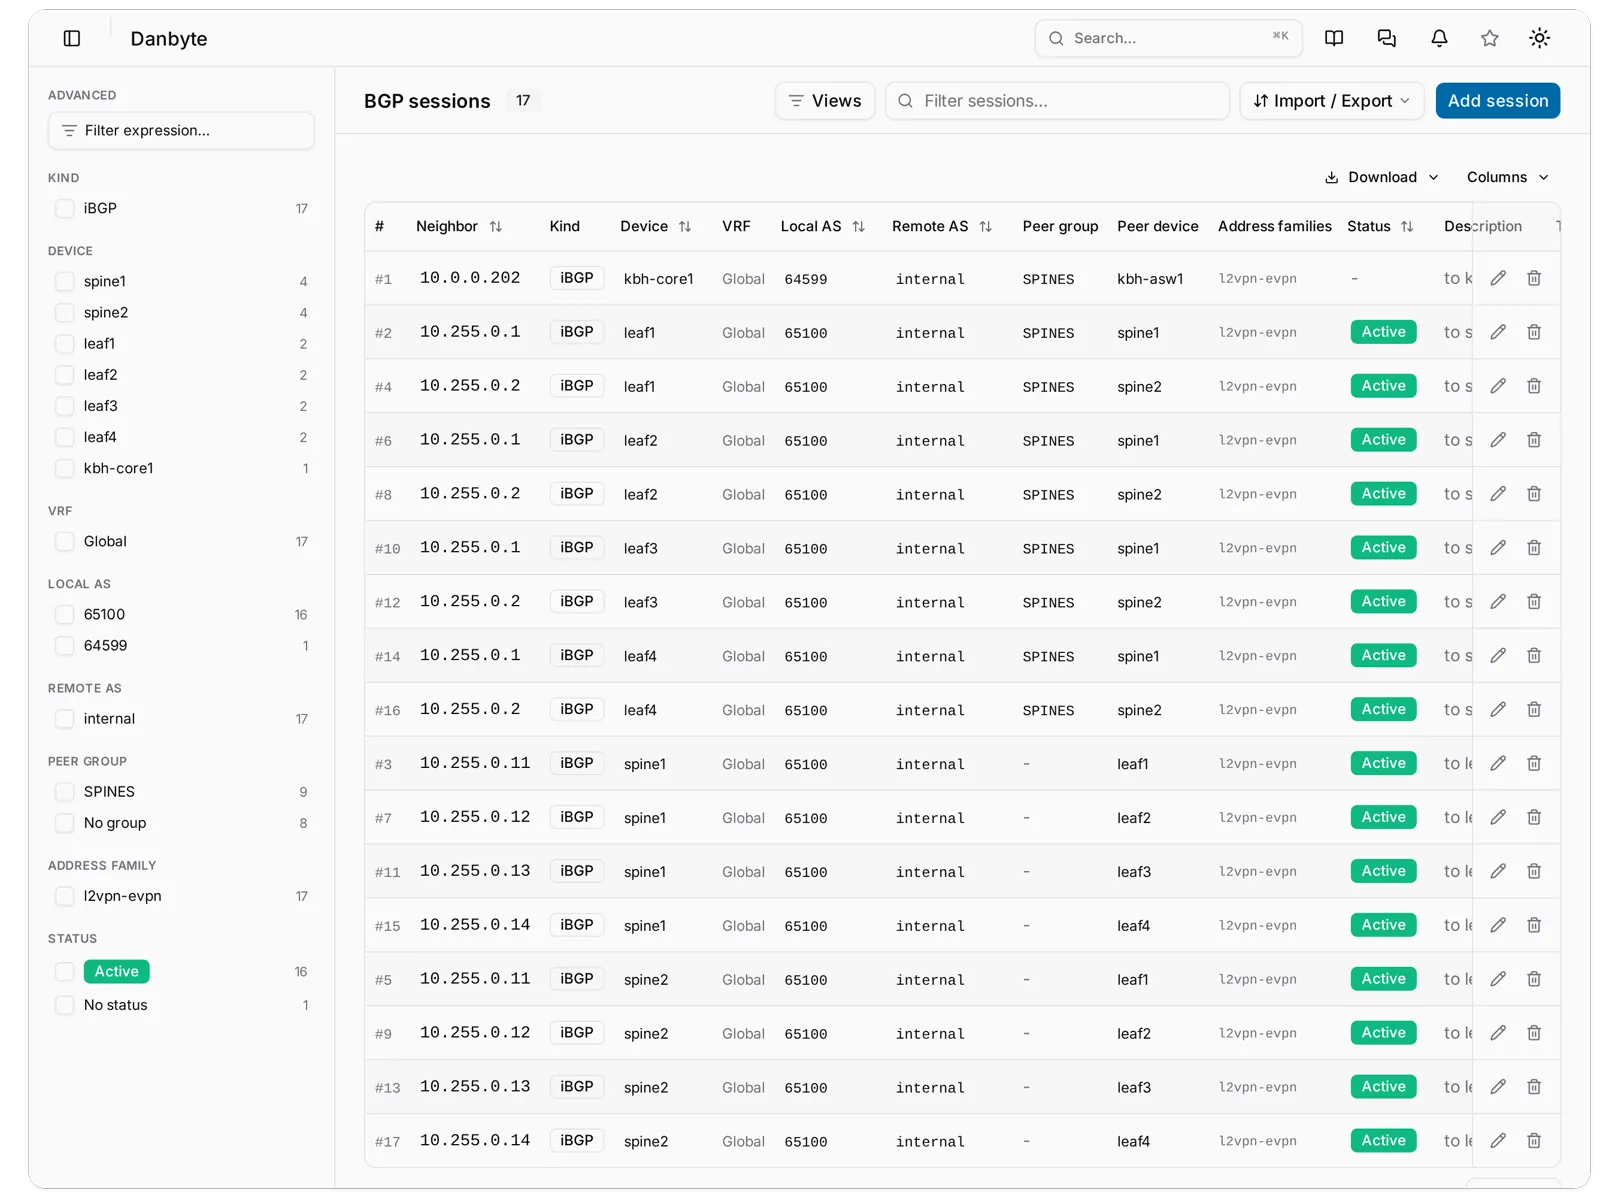
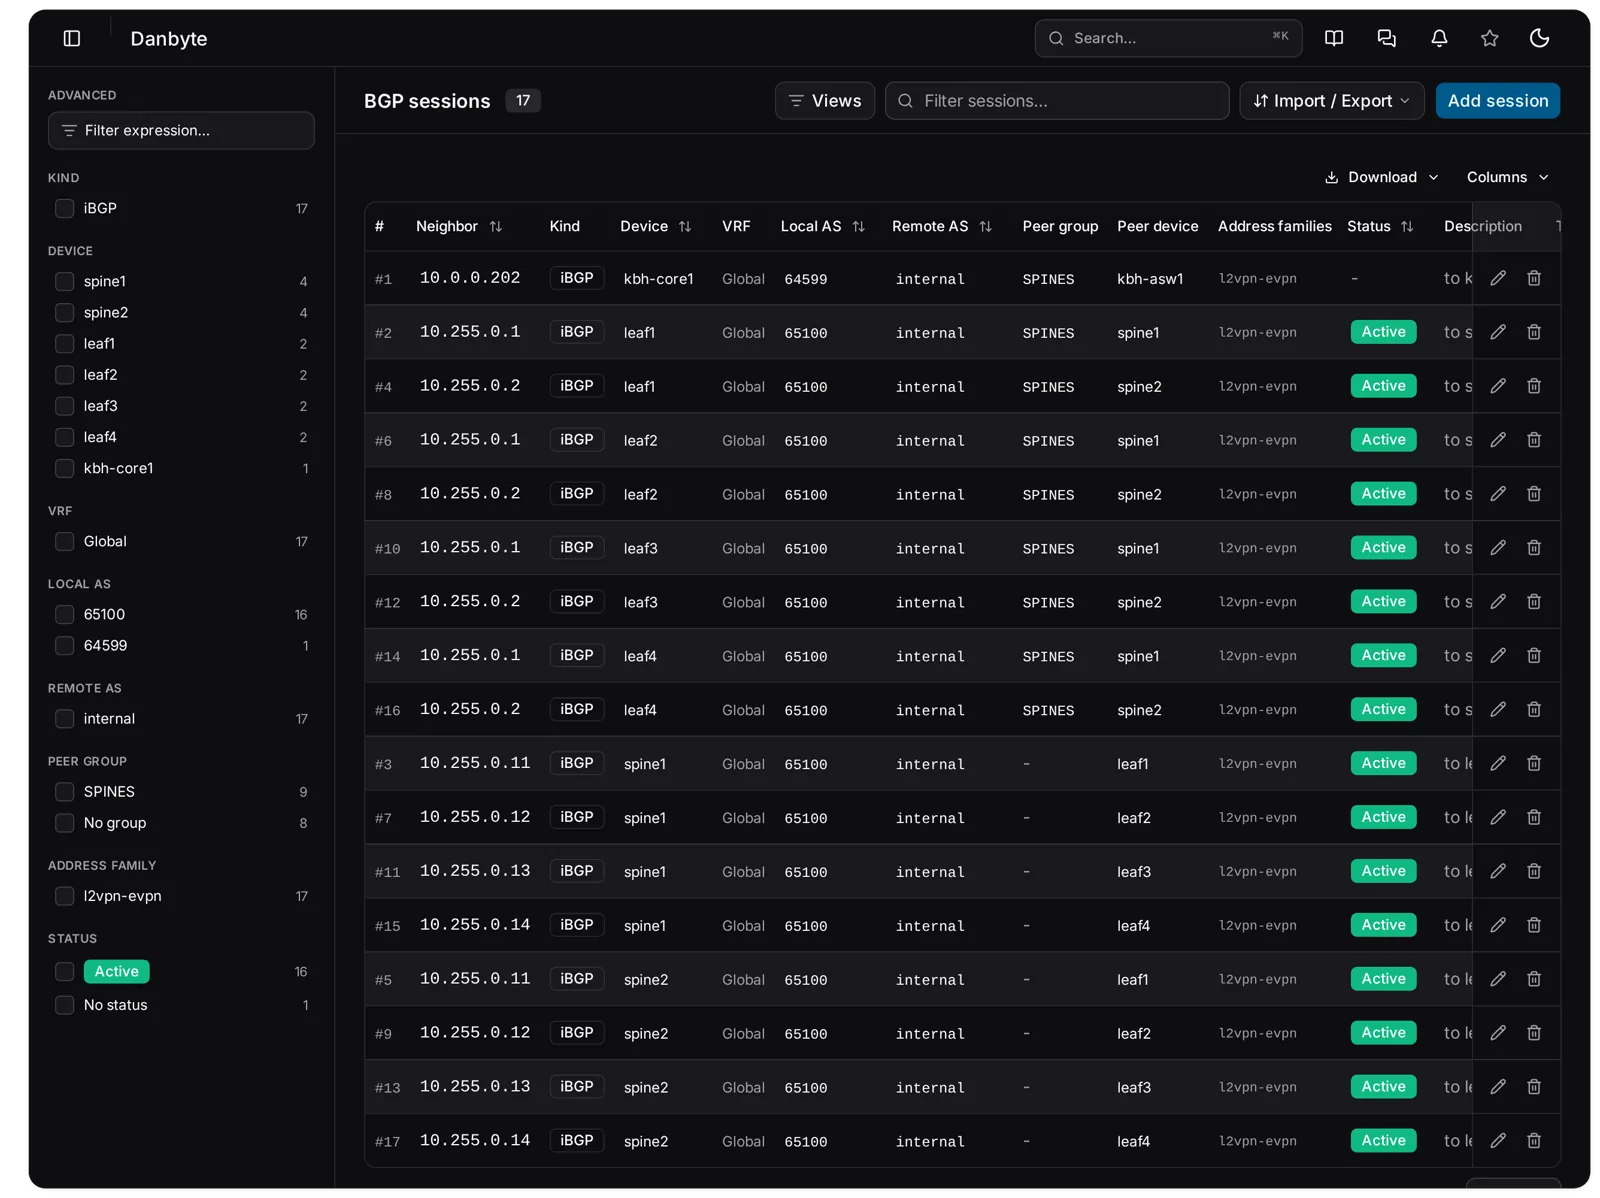 Routing, BGP, Sessions across the fleet: eight rows, each leaf to each spine, with kind, ASNs, device, peer group, peer device, address families and status, and the facet rail on the left.
IGPs, policy and keys
OSPF instances are v2 or v3, a named process per VRF, with areas from a catalog. IS-IS instances carry the NET, level and metric style. EIGRP is classic ASN or named mode, with K values, variance, maximum paths and stub. Each has an interface row per enrolled port with cost or metric, network type, passive as a tri-state that can inherit the instance default, timers, BFD, and authentication through a keychain. A port can be enrolled from its own page too: its Overview has a Routing card with an Enrol in button per instance on its device.
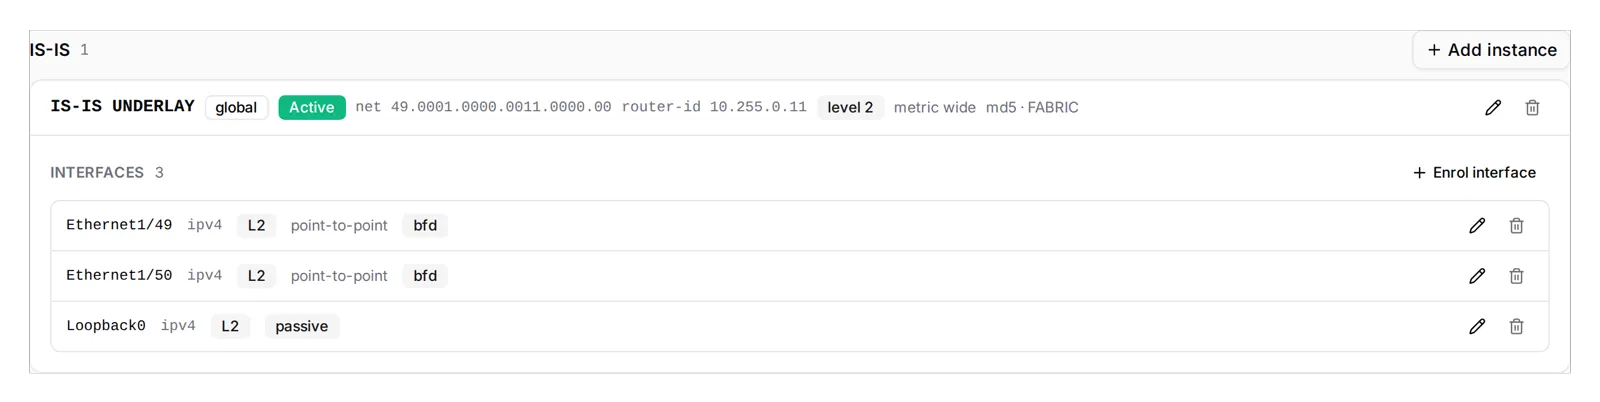 leaf1's IS-IS section: the instance UNDERLAY with its NET, level 2, wide metrics and BFD FAST, and the enrolled interfaces, Ethernet1/49 and 1/50 point-to-point, Loopback0 passive.

 The Routing card on leaf1's Ethernet1/49: enrolled in IS-IS UNDERLAY, point-to-point, with Enrol in for EIGRP 100.
BFD profiles are a catalog of min TX, min RX, multiplier and echo. Wherever BFD can be switched on, an instance, a session, a peer group, an interface row, the same field pairs the switch with a profile, and the effective value follows the same inheritance as everything else. A prefix list is rules with sequence, permit or deny, prefix and ge/le, validated so that ge is at most le, both at least the prefix length, and the family matches the list. A routing policy is rules with a match (prefix lists, community lists, AS-path lists, next hop), a set (local preference, MED, weight, origin, next hop, AS-path prepend, communities additive or not, metric type) and an optional continue. Rules are edited as a block on the object's edit page and upserted by sequence.
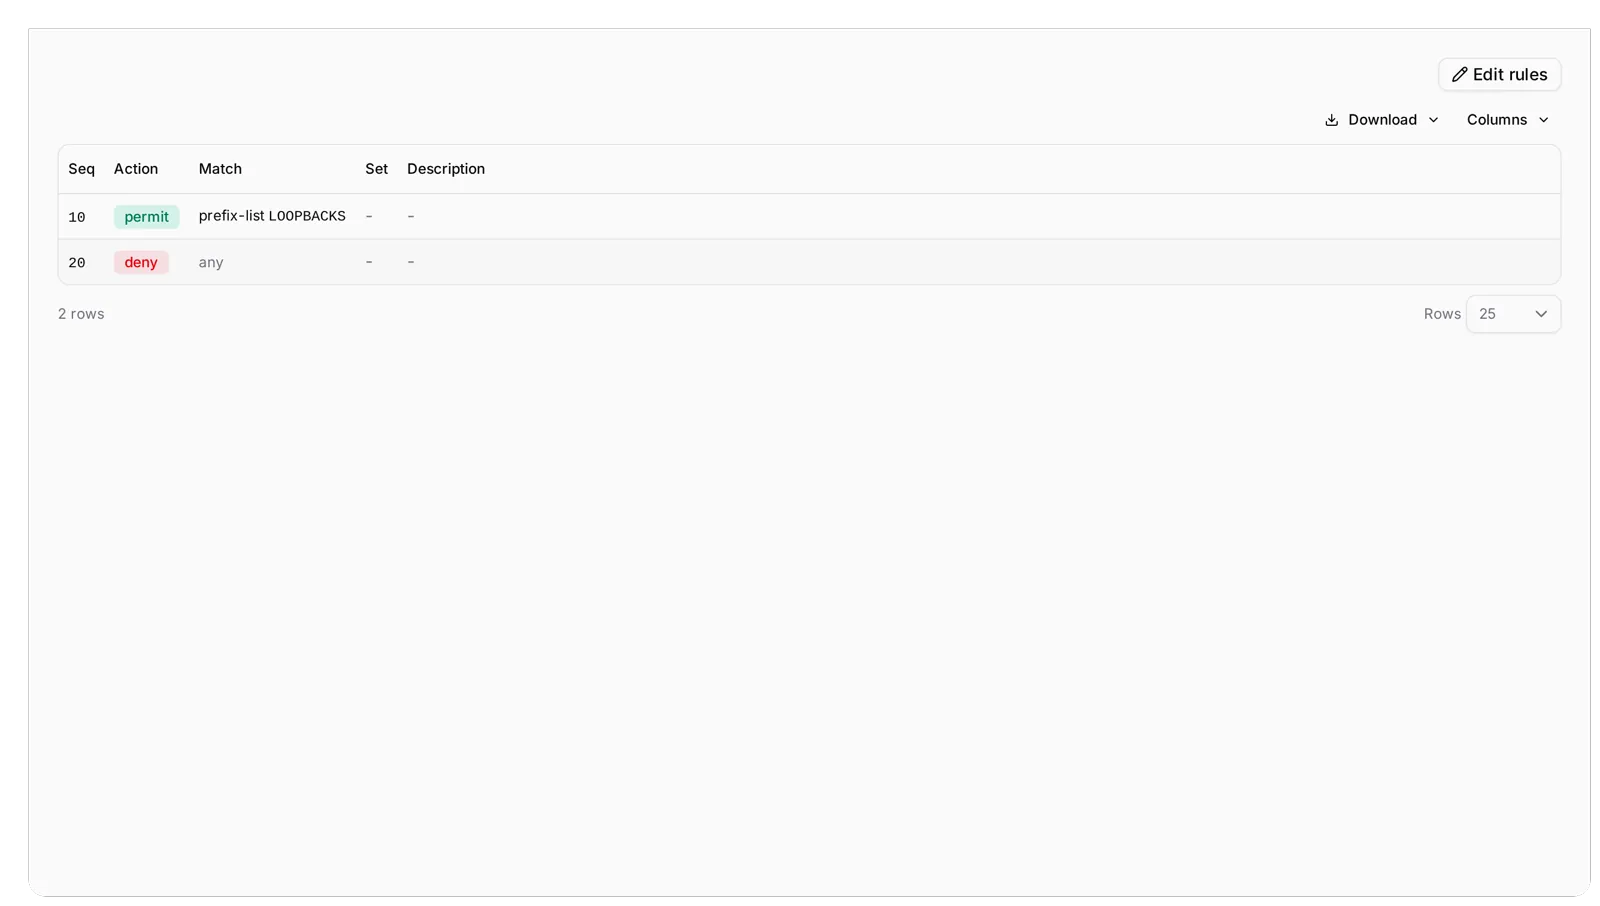
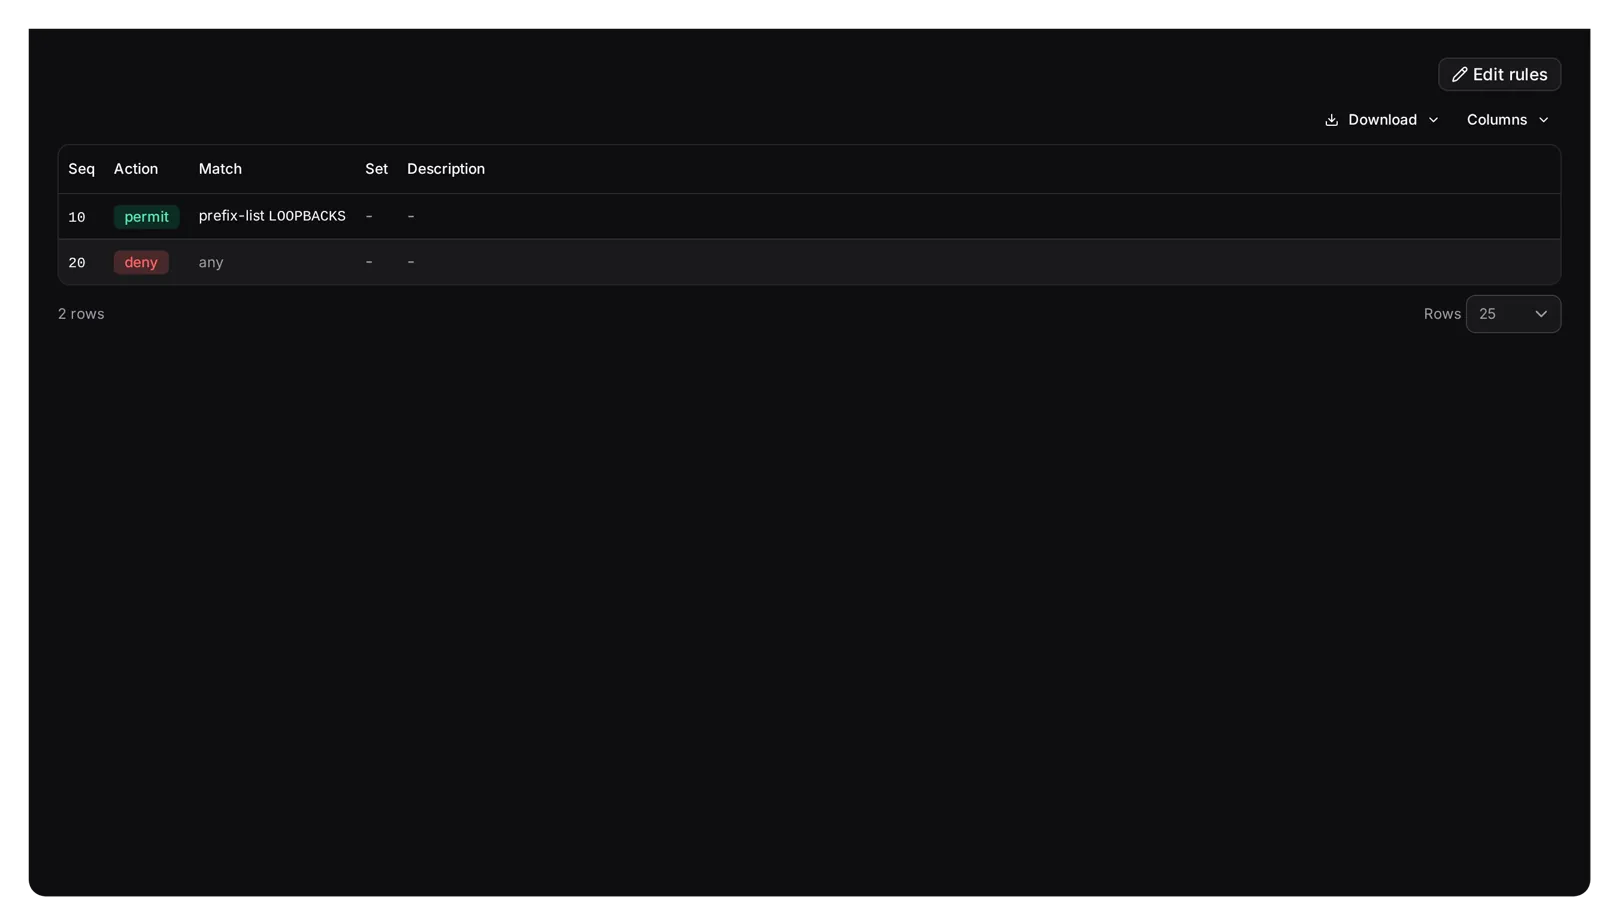 EVPN-EXPORT's rules: 10 permit prefix-list LOOPBACKS, 20 deny any. Only the loopbacks leave the underlay.
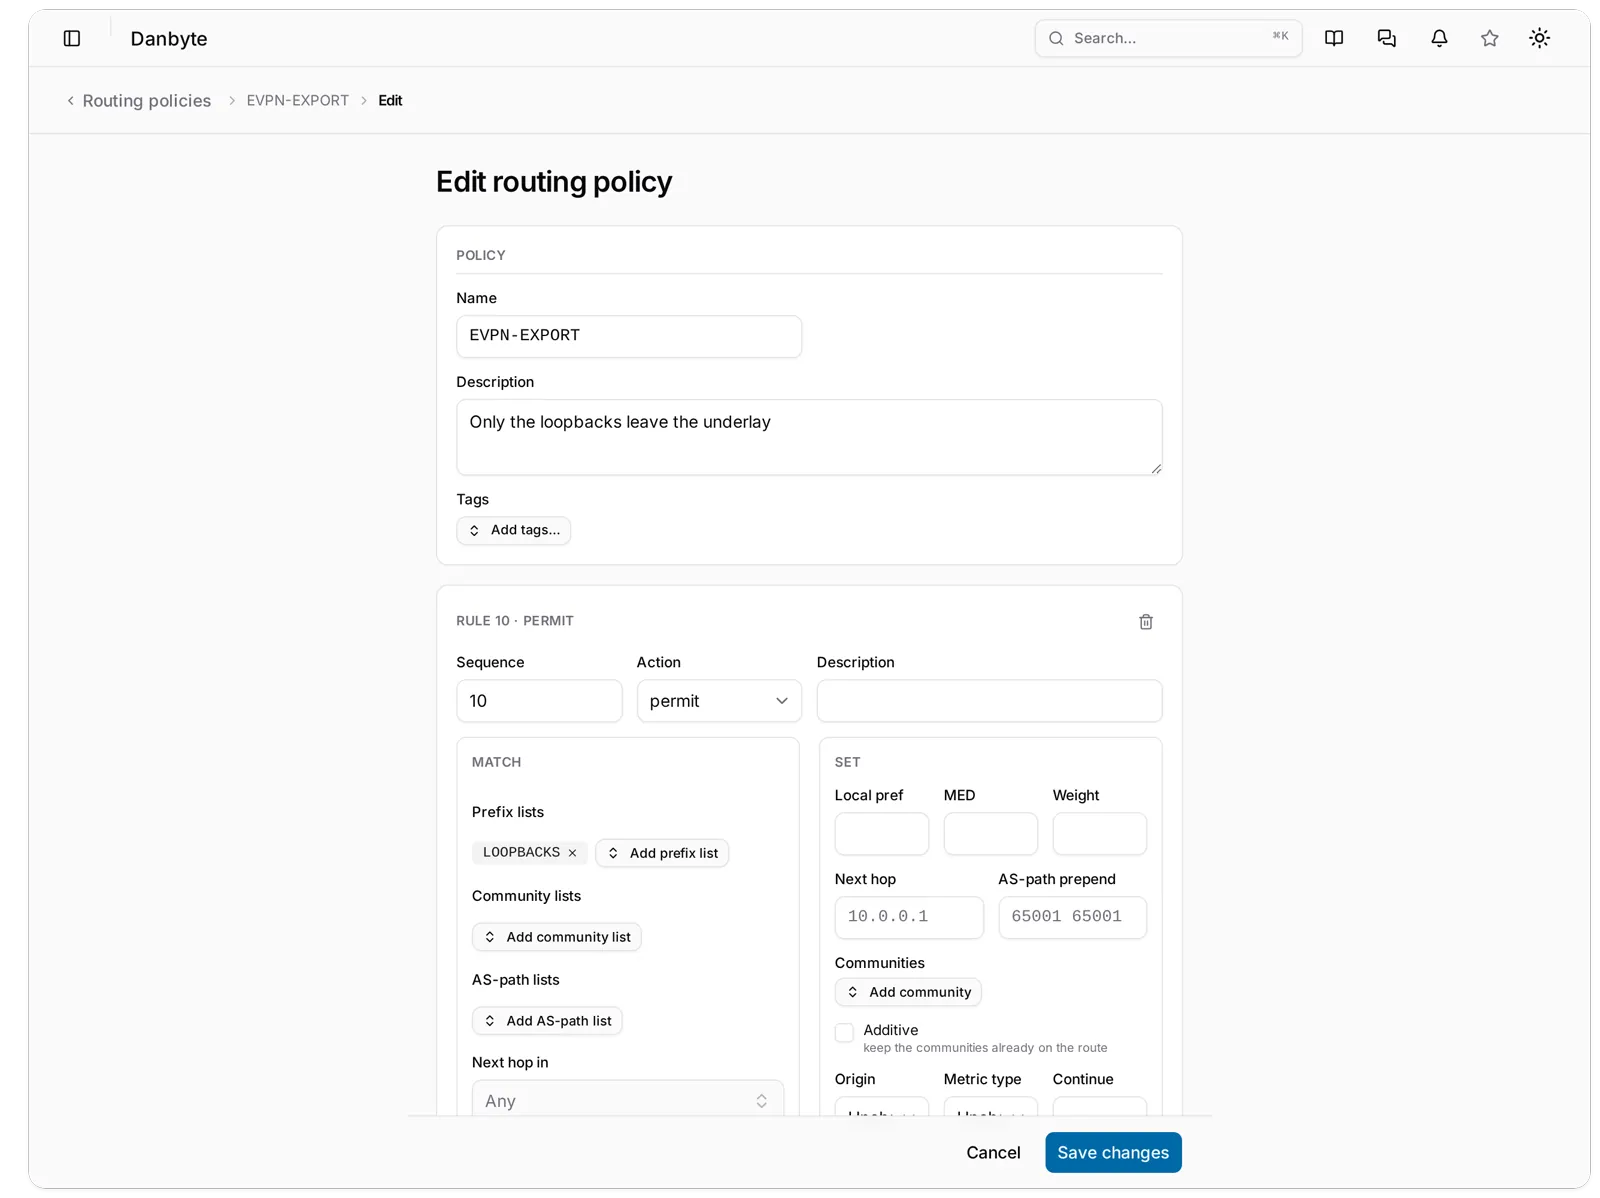 The rules editor on a routing policy: one row per rule with sequence, action, the match pickers and the set fields.
Keychains are the one secret type. BGP passwords and OSPF, IS-IS and EIGRP authentication all point at a keychain, and the key lives in the secret store: written in, read back only through an audited reveal, refused when no store is configured. Templates never see the key; they see the keychain's name and whether a key is set, and a runner asks for the key itself.
The overlay
An EVPN L2VPN that names a VRF is that VRF's L3VNI, and a VNI is unique per tenant for the VXLAN types. A device gets a VTEP with its source loopback, source IP, anycast IP and gateway MAC and ARP suppression, carrying the VNIs it serves. Each membership resolves to a VLAN, its own or the L2VPN's single termination VLAN at the device's site. The FHRP group protocol list gained EVPN anycast gateway, so the anycast SVI is an ordinary virtual interface with an FHRP assignment and the render hands an SVI loop its gateway. The L2VPN page has a VTEPs tab, and a VLAN page lists its L2VPN terminations with the VNI.
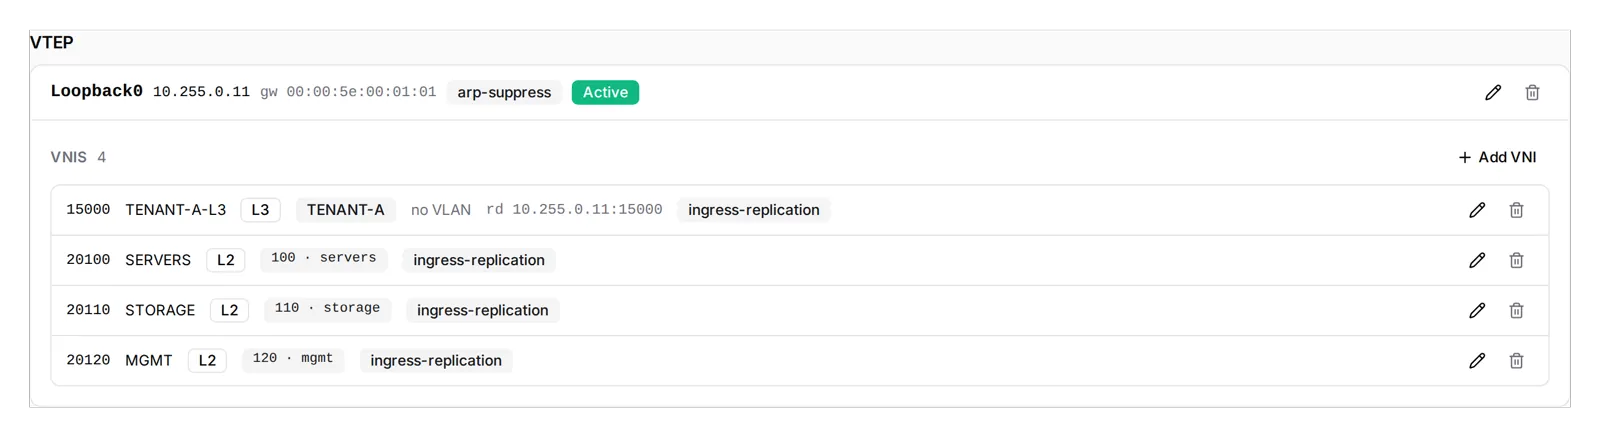
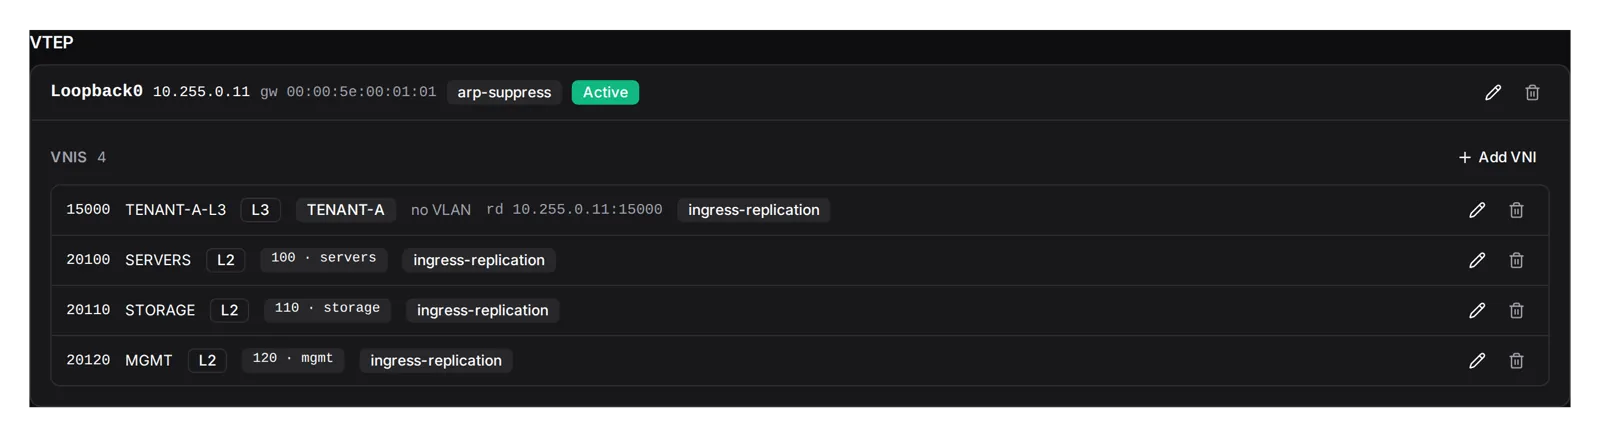 leaf1's VTEP: Loopback0, the anycast gateway MAC, ARP suppression, and four VNIs, the L3VNI 15000 for TENANT-A and the L2VNIs 20100, 20110 and 20120 with the VLAN each resolves to.
flowchart TB
subgraph Underlay
S1[spine1<br/>RR] --- L1[leaf1]
S1 --- L2[leaf2]
S1 --- L3[leaf3]
S1 --- L4[leaf4]
S2[spine2<br/>RR] --- L1
S2 --- L2
S2 --- L3
S2 --- L4
end
L1 -. iBGP l2vpn-evpn .- S1
L1 -. iBGP l2vpn-evpn .- S2
L1 --> V[VTEP Loopback0<br/>VNI 20100 · 20110 · 20120 · L3 15000]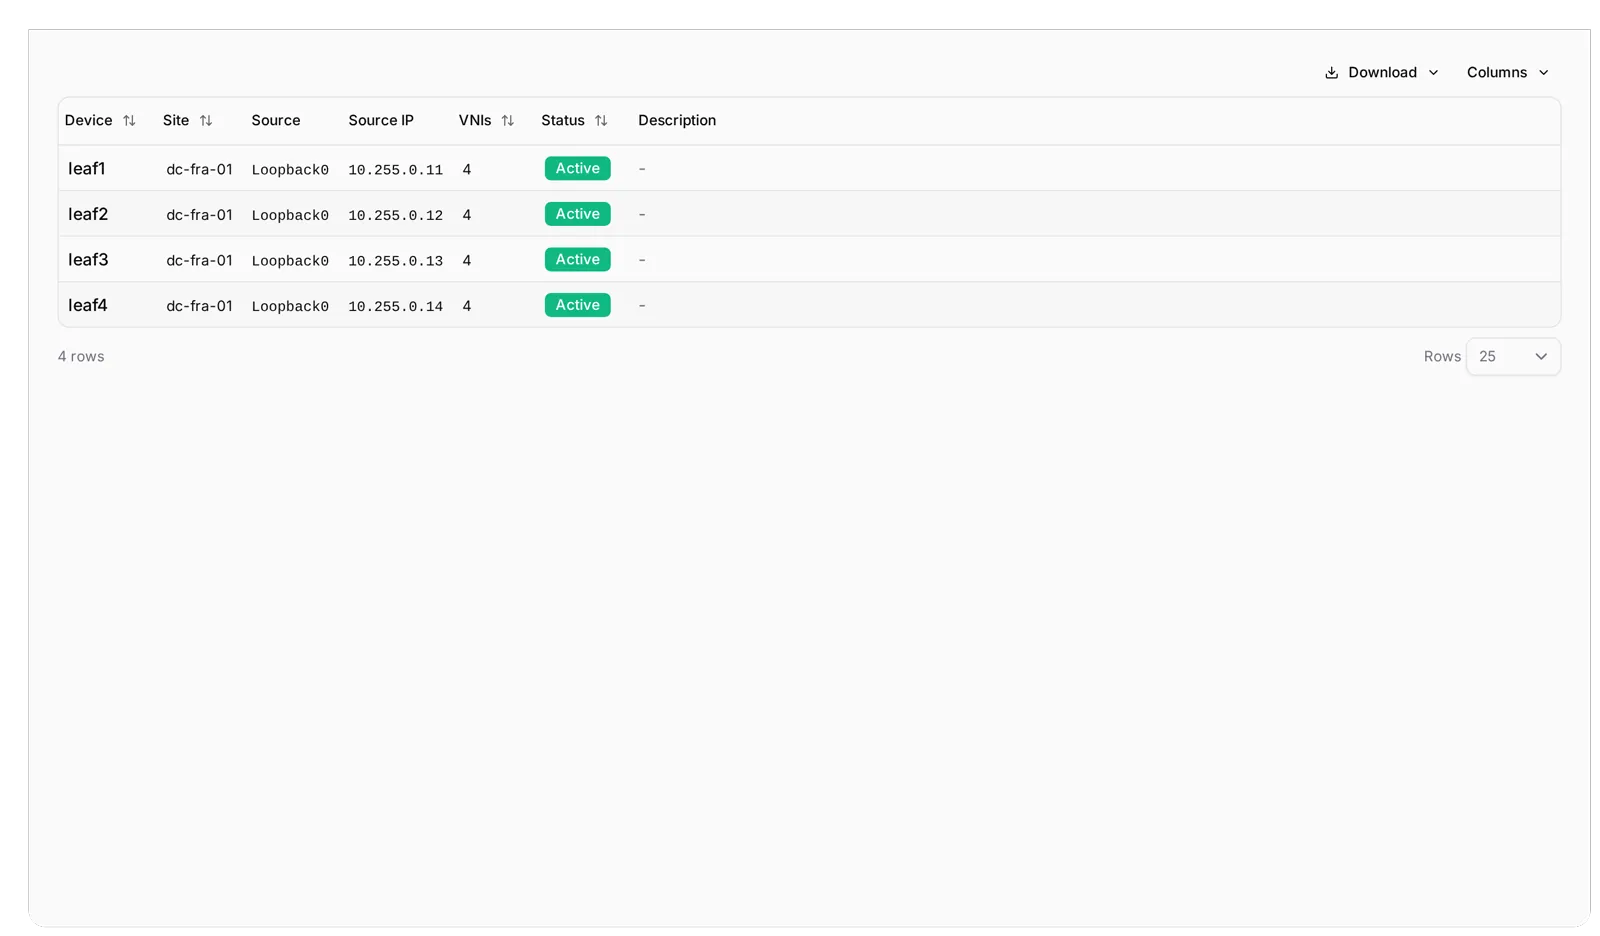 The L2VPN SERVERS, VNI 20100, and its VTEPs tab: four leaves, each with the VLAN the VNI resolves to on that device.
One template renders the box
routing_context(device) builds plain dictionaries for the template: vrfs with their L3VNI, static_routes, bgp with instances, sessions carrying their effective values and peer groups, ospf, isis, eigrp, by_interface (what each port runs: VRF, OSPF, IS-IS, EIGRP, FHRP, anycast gateway), vtep, the policy objects, and keychains as name and key_set, never the key. There are Jinja filters for addresses: cidr, host, prefixlen, netmask, wildcard, network, ipv4, ipv6. The order is deterministic, so config drift diffs stay quiet. The Ansible inventory carries the block behind ?routing=1, and always on the per-device inventory.
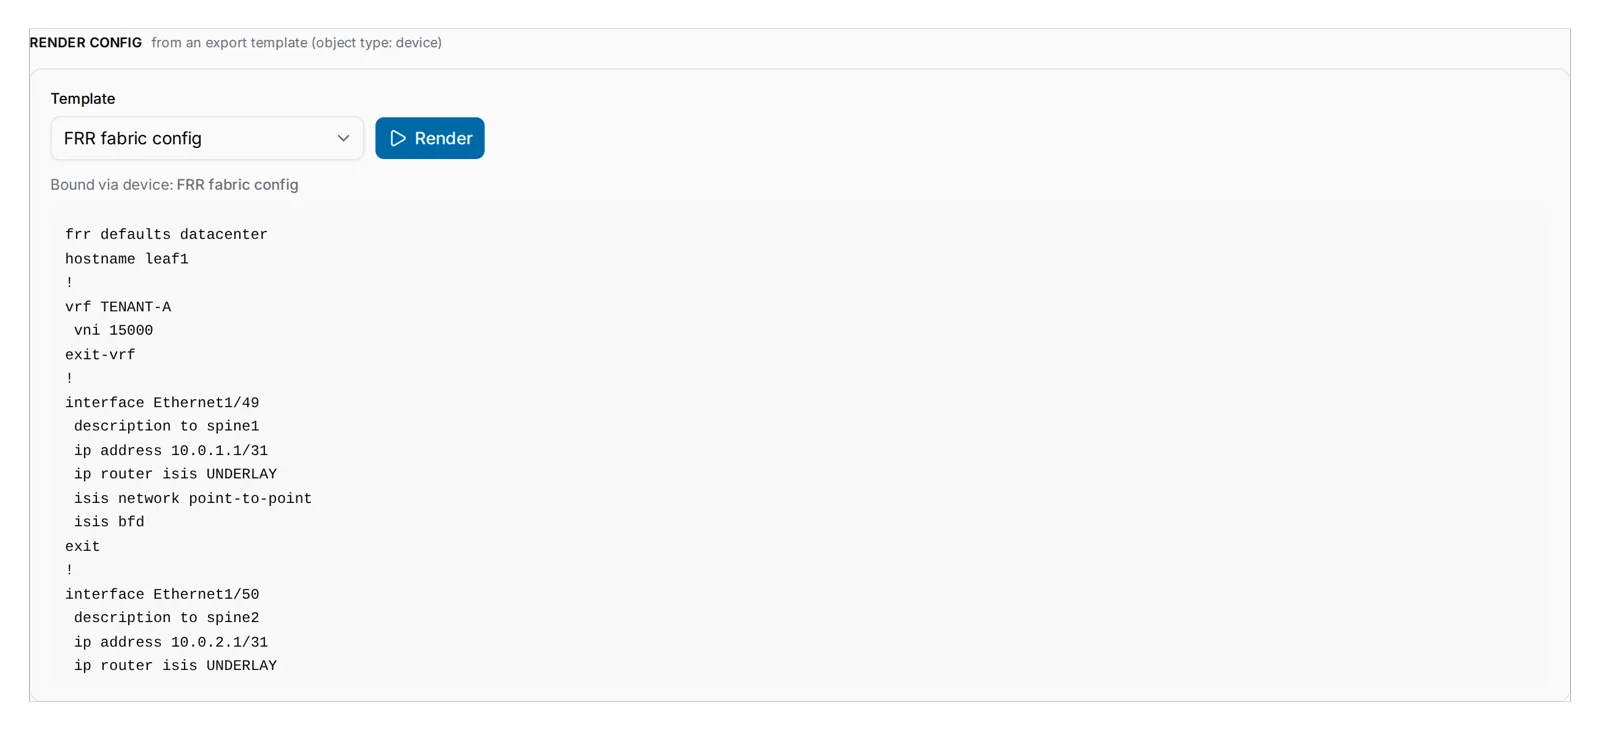
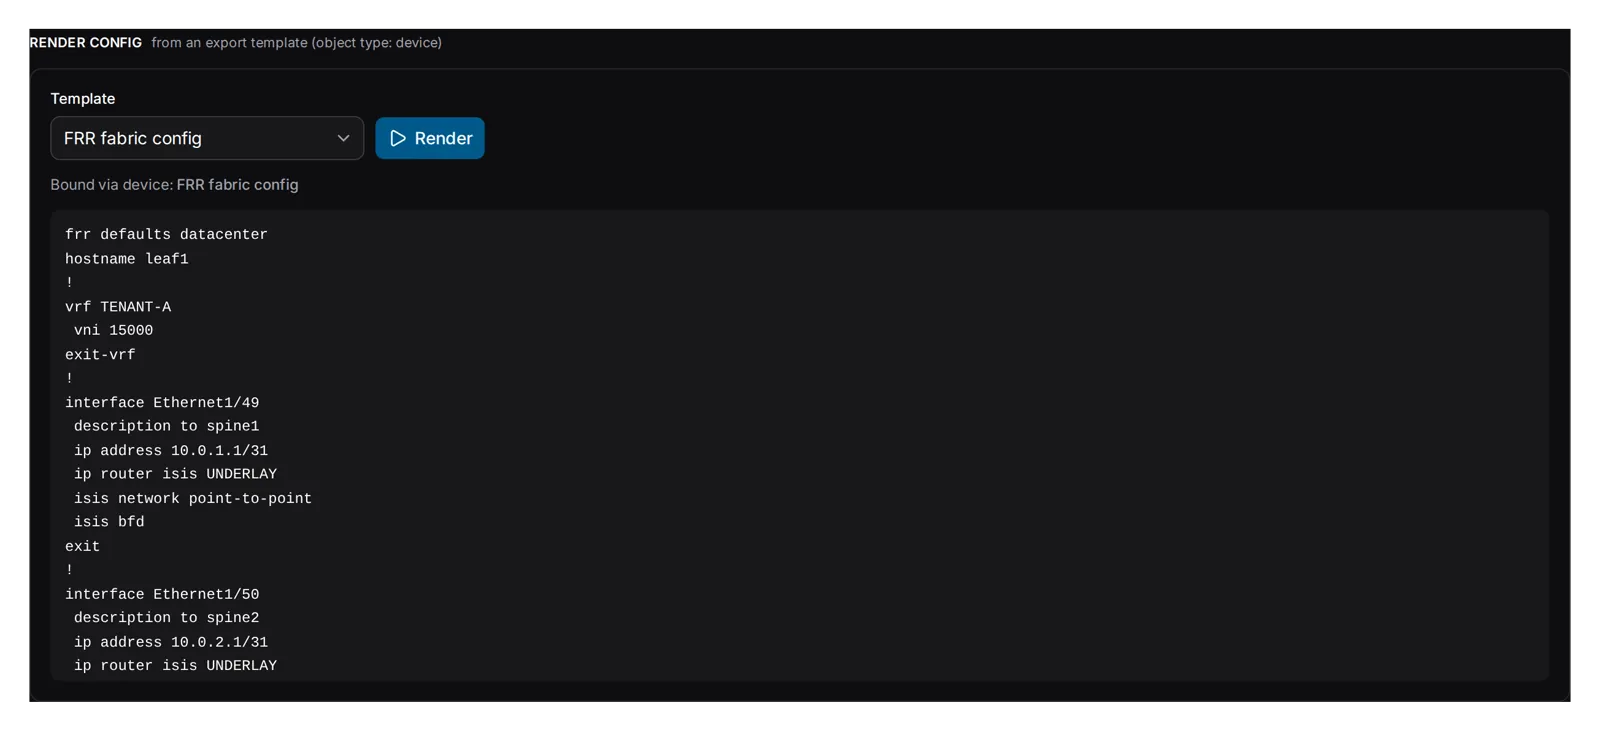 leaf1's Config tab rendering the FRR fabric config template: the VRF with its VNI, then the uplink interfaces with their addresses, IS-IS enrolment, point-to-point and BFD.
The docs carry two complete templates, one in the NX-OS style and one for FRR, rendered from the seeded fabric by the test suite; the FRR output loads in vtysh -f on an FRR 10 container. They are examples. Nothing vendor-specific ships as data, the templates are yours, and Danbyte does not push configuration to a router or read BGP state back from one. A session's Active is a catalog status, the same kind a device has; it says nothing about whether the peering is up.
Sessions on the map
BGP sessions are a link family on the topology map, like cables and LLDP: a faint dashed line centre to centre between the two routers, one line per pair and VRF however many sessions they have, named on hover, a click opens the session, a row in the legend, and an eye under Links in the On this map panel hides the family and keeps the cabling.
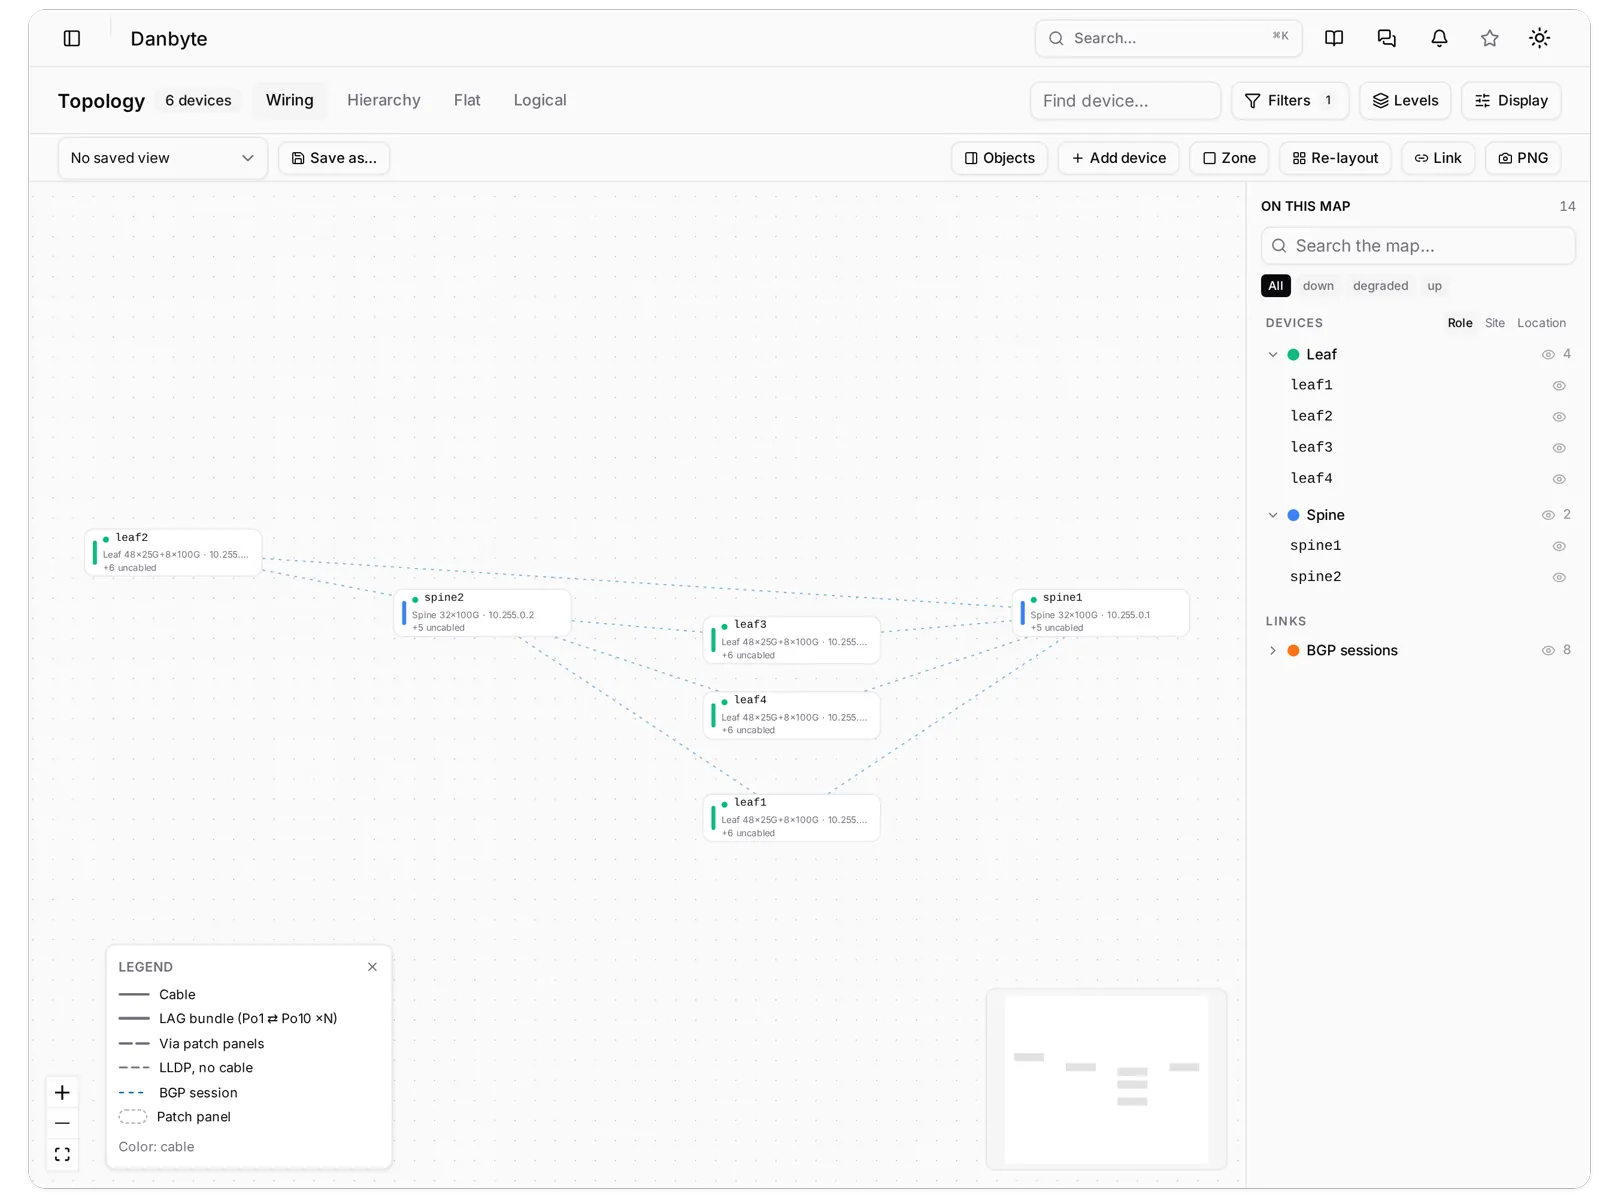
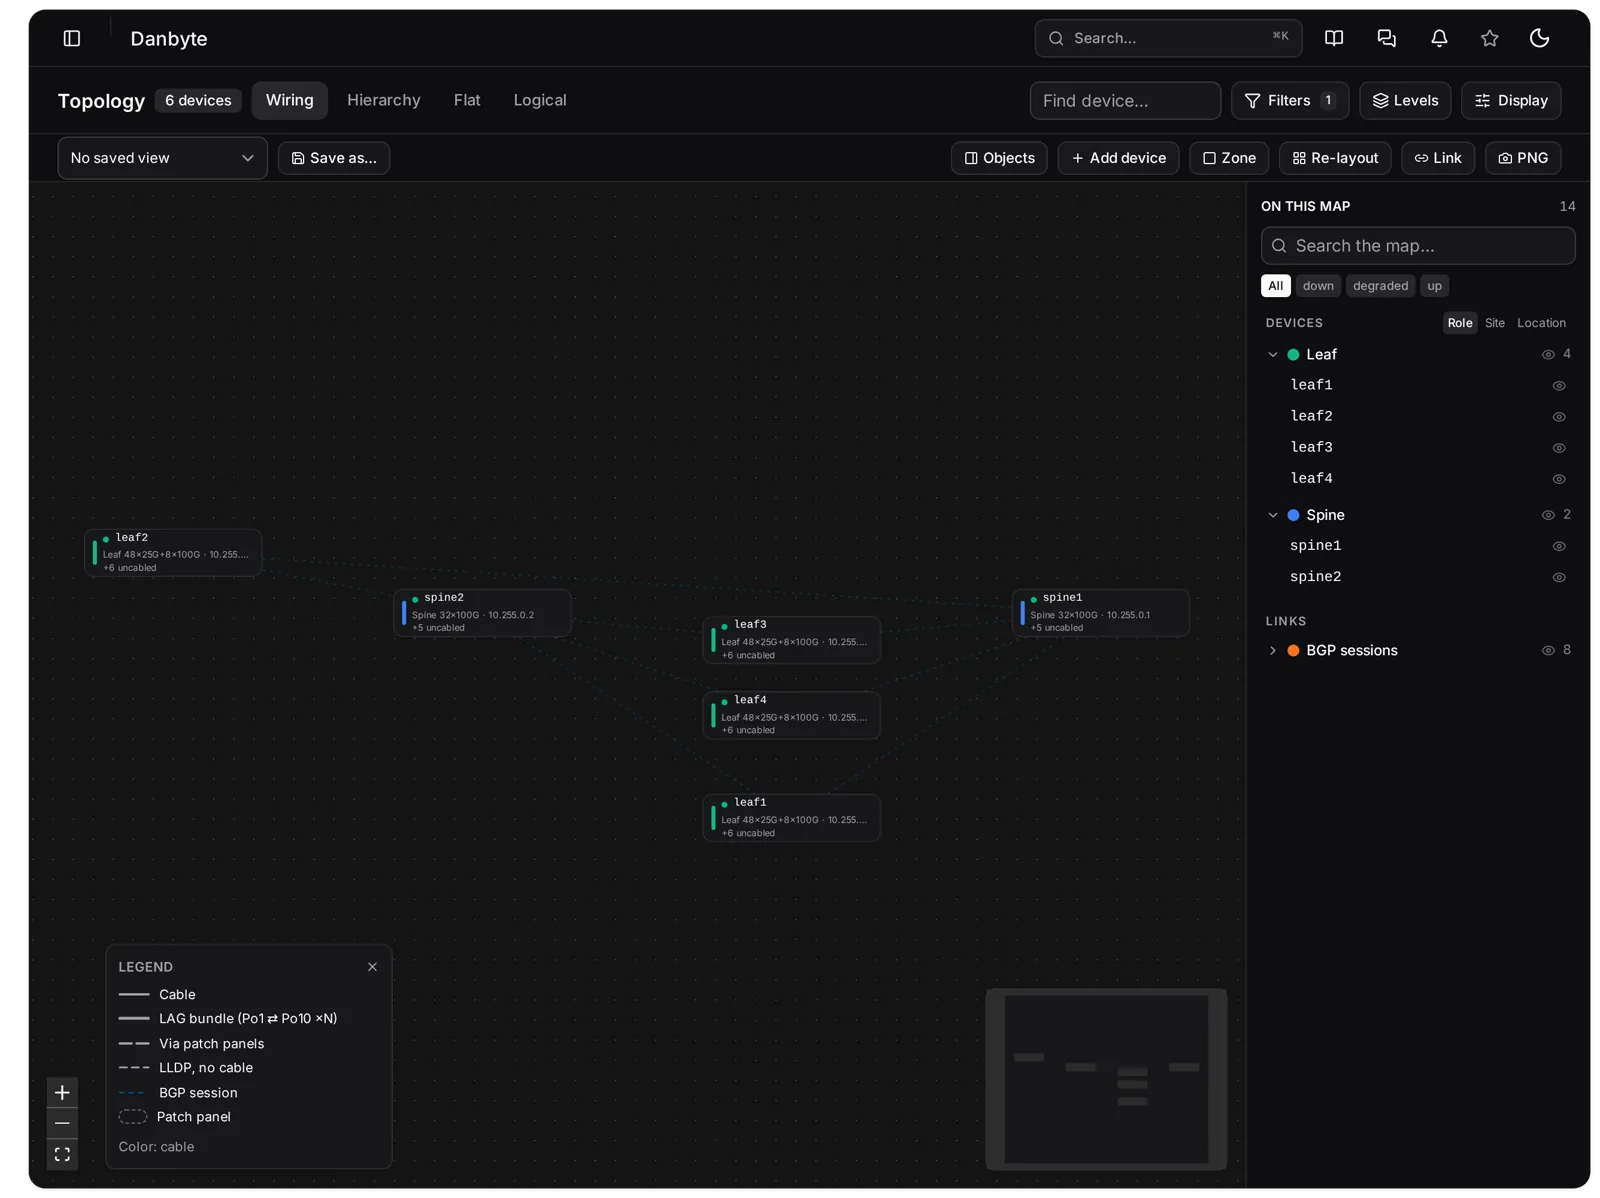 The fabric on the topology map: the leaf and spine cables, and faint dashed BGP lines from every leaf to both spines. The panel lists BGP sessions 8 under Links with an eye.
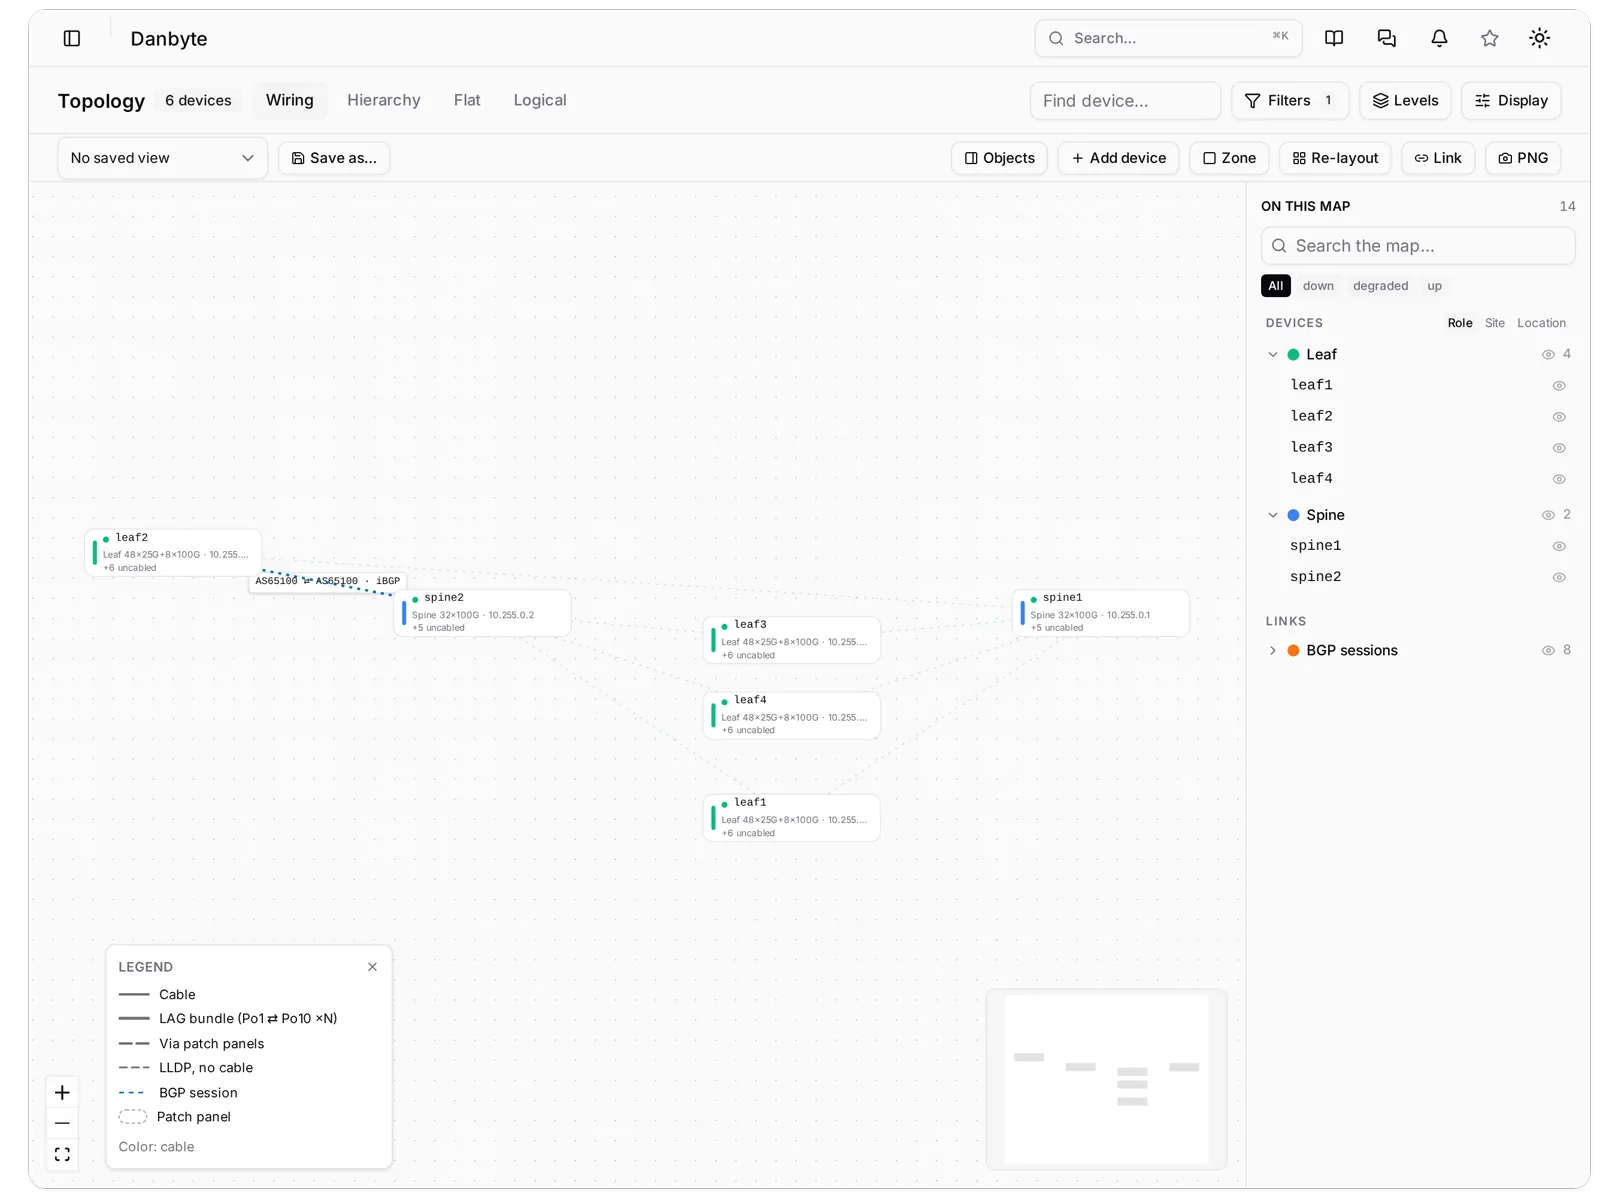 The pointer on the leaf2 to spine2 line: it draws solid and reads AS65100 ⇄ AS65100 · iBGP.
Find anything
One command palette, ⌘K or Ctrl+K anywhere, / outside a text field, or the top-bar box. It returns one ranked list across every object type instead of one box per type. Every hit carries its status and its context, site, rack, role, device, VRF or cluster, so similar objects tell apart. Accents and case are folded at the index: aarhus, arhus and Århus are the same word, and so are Næstved and naestved. A near miss ranks below the exact hits rather than vanishing; that is trigram similarity, not spell correction. An IP or CIDR also lists the prefixes containing it, most specific first, and an all-digit query matches the short id printed on labels.
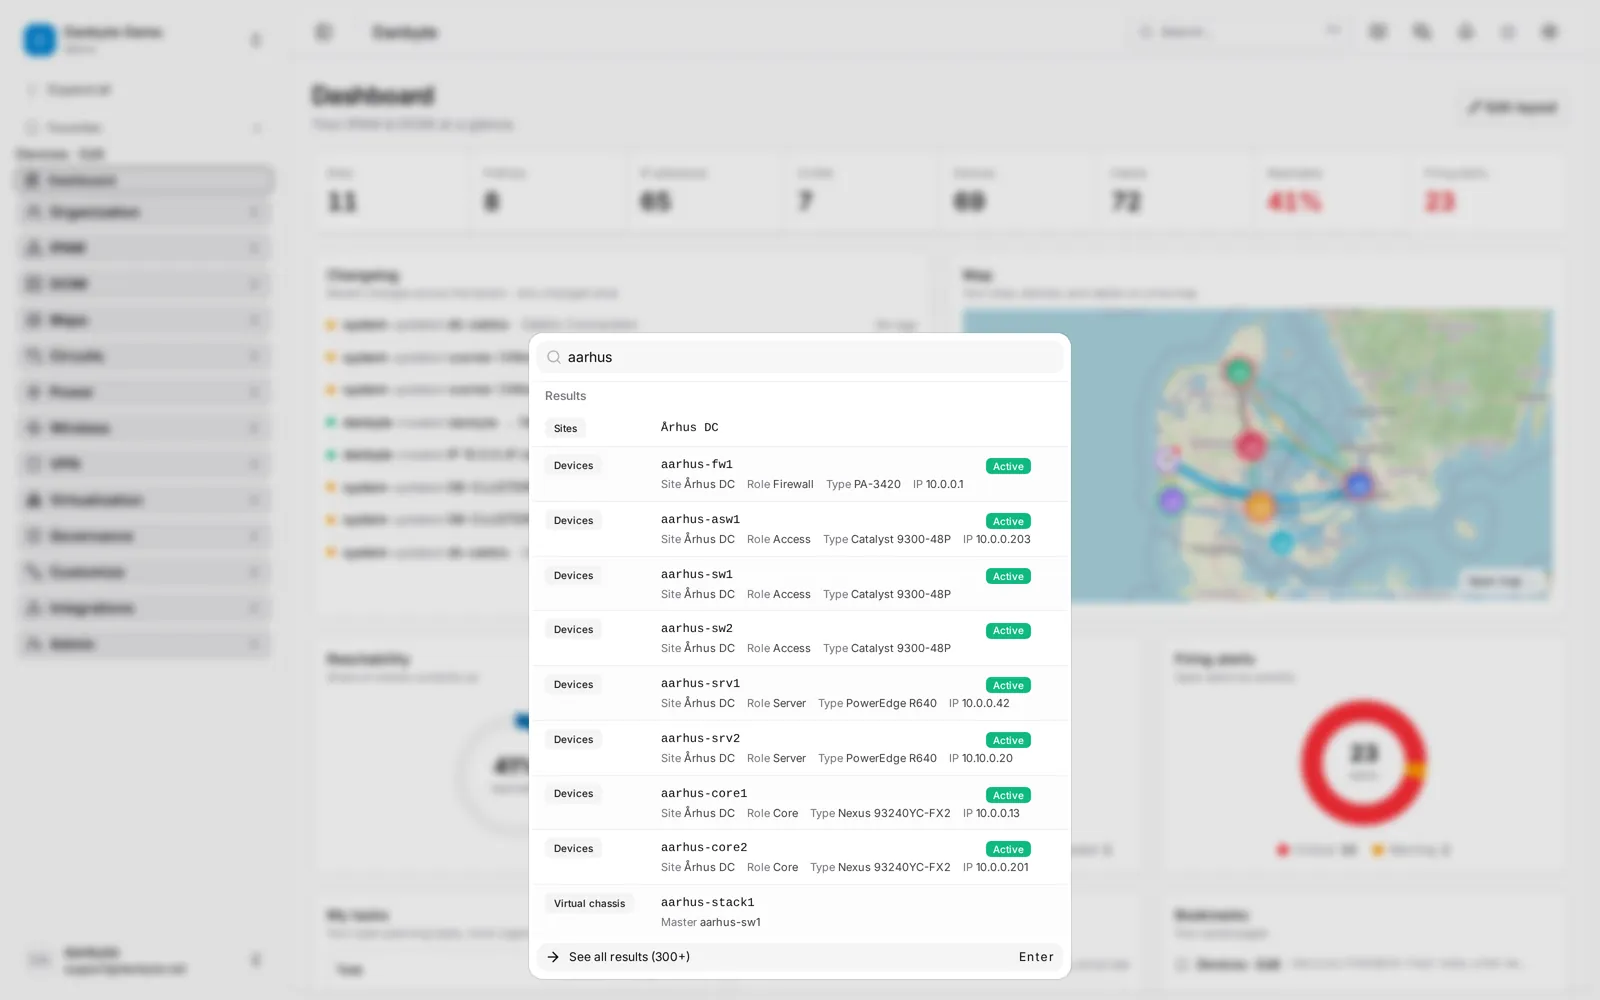
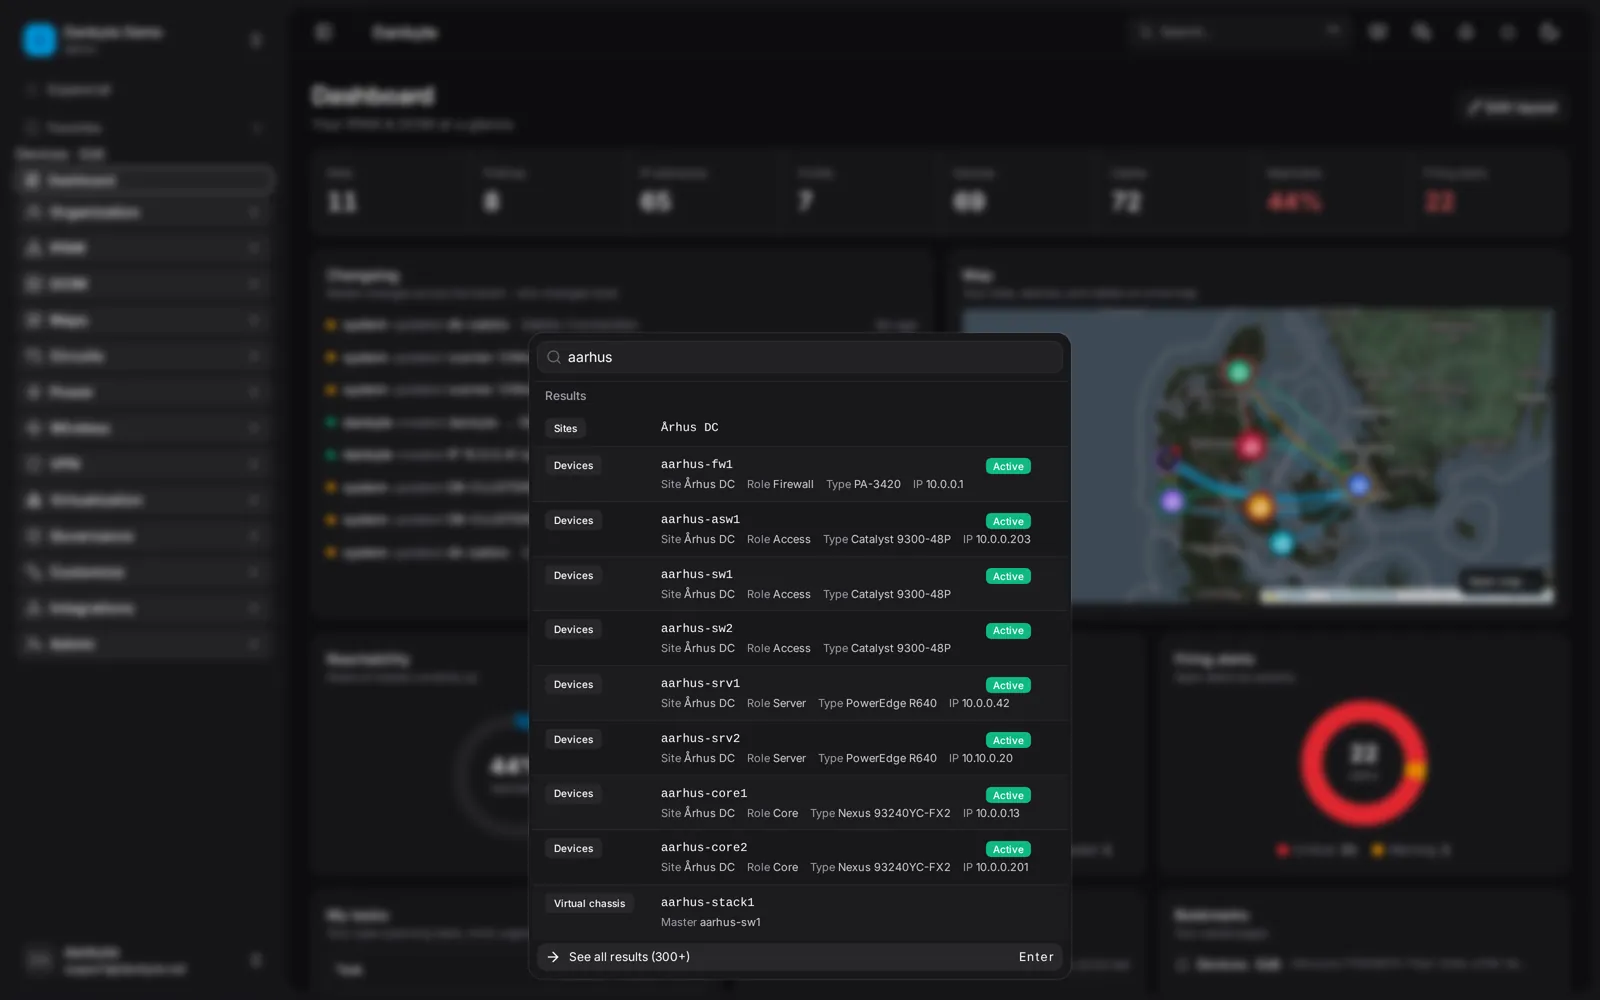 The palette with aarhus typed: Århus DC first, then eight Aarhus devices with site, role, type and IP, then the stack aarhus-stack1. No å was typed.
Tokens narrow it: type:, site:, role:, status:, tag:, platform:, vrf:, cluster:, provider:, manufacturer:, group:, rack:, vlan:, matched as a prefix, so site:aar is enough. Tokens alone browse everything that matches. A Settings group under the object results lists matching settings, down to the individual card, so "session timeout" opens Security scrolled to the Sessions card. Every hit is checked against your permissions for its type, including site scope, before it is returned. The index is one table kept current on every save, rebuilt nightly and after an upgrade, and it needs PostgreSQL's pg_trgm and unaccent, which the migration creates.
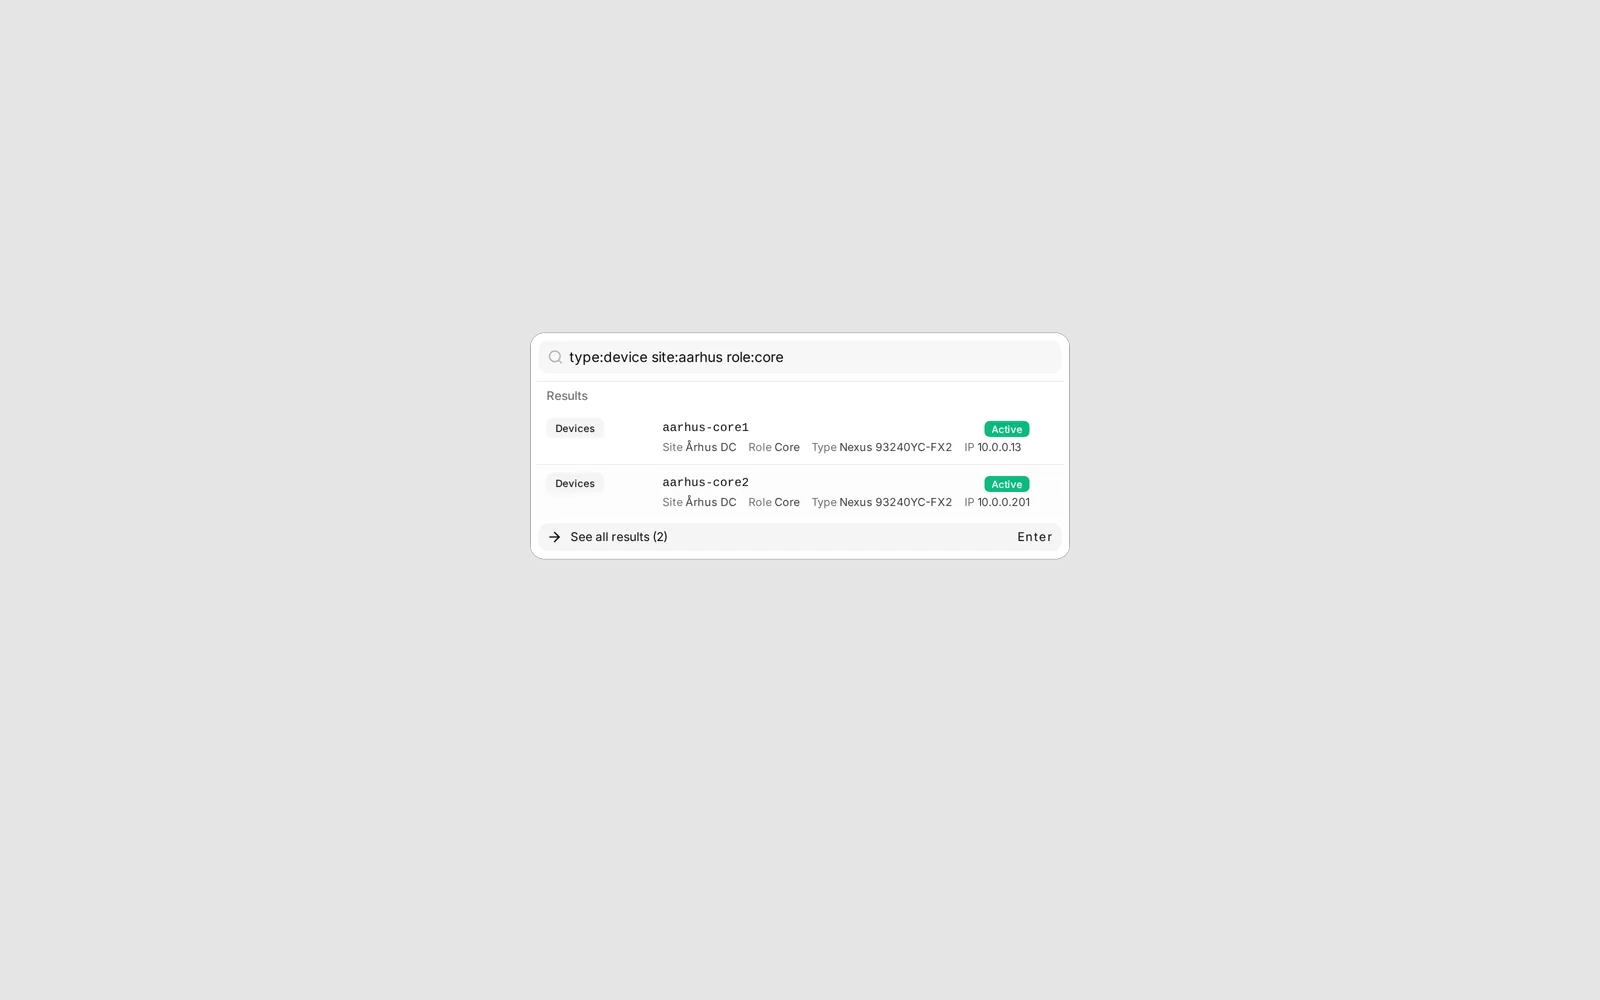
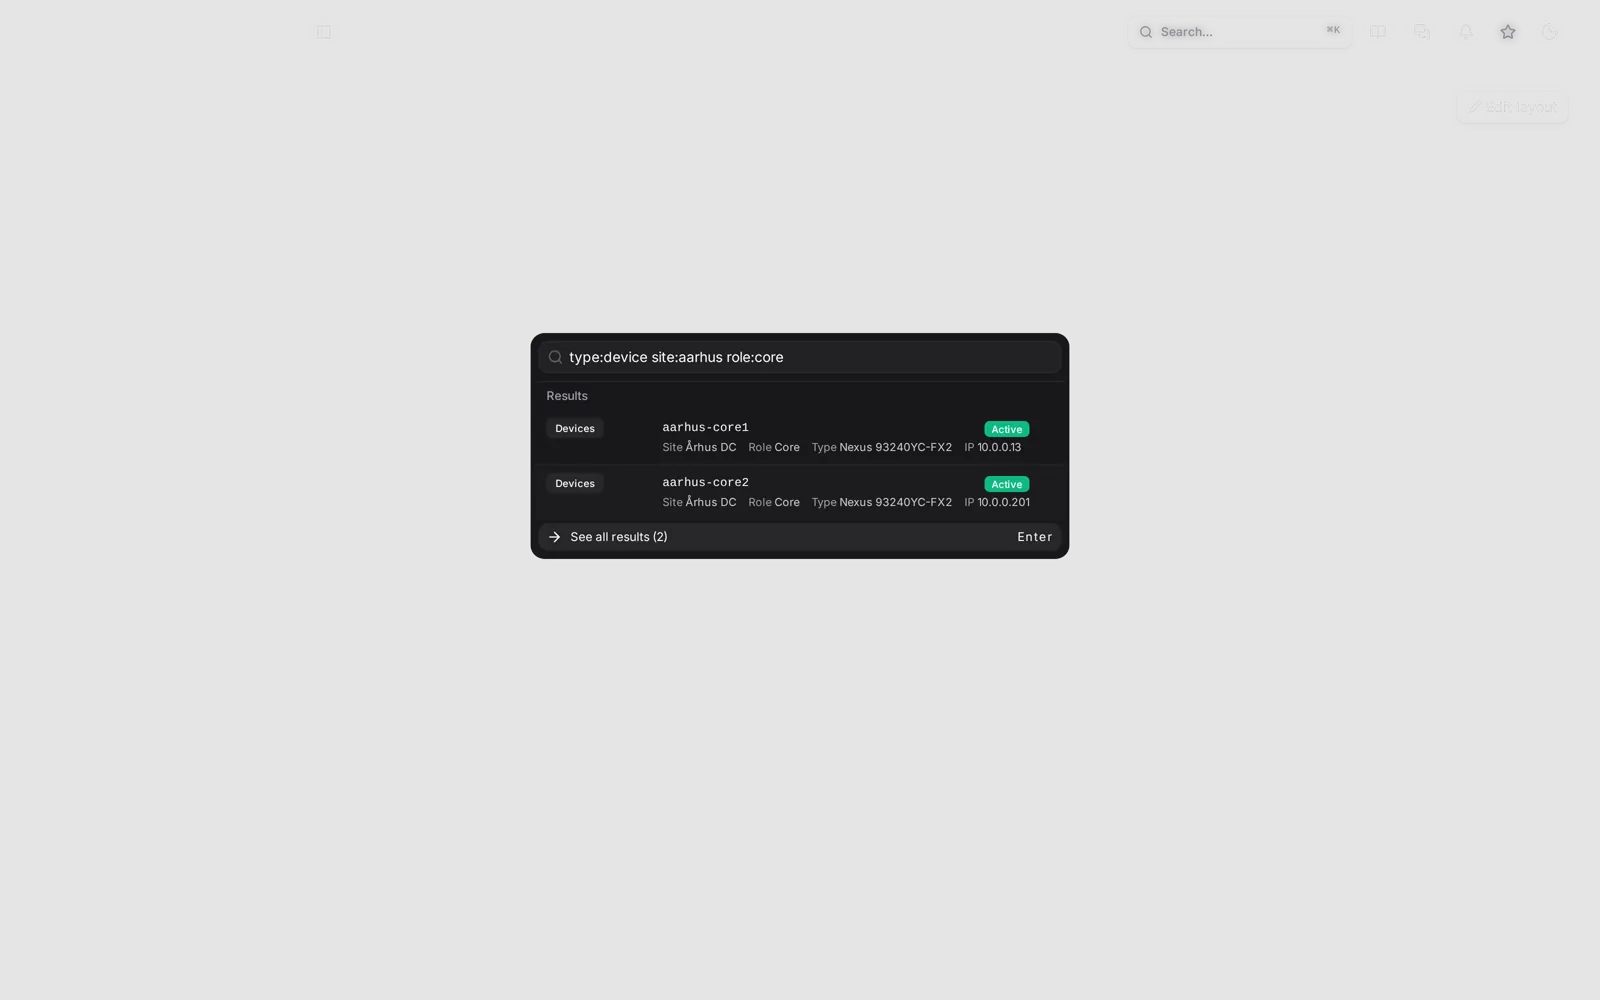 type:device site:aarhus role:core, and exactly two hits.
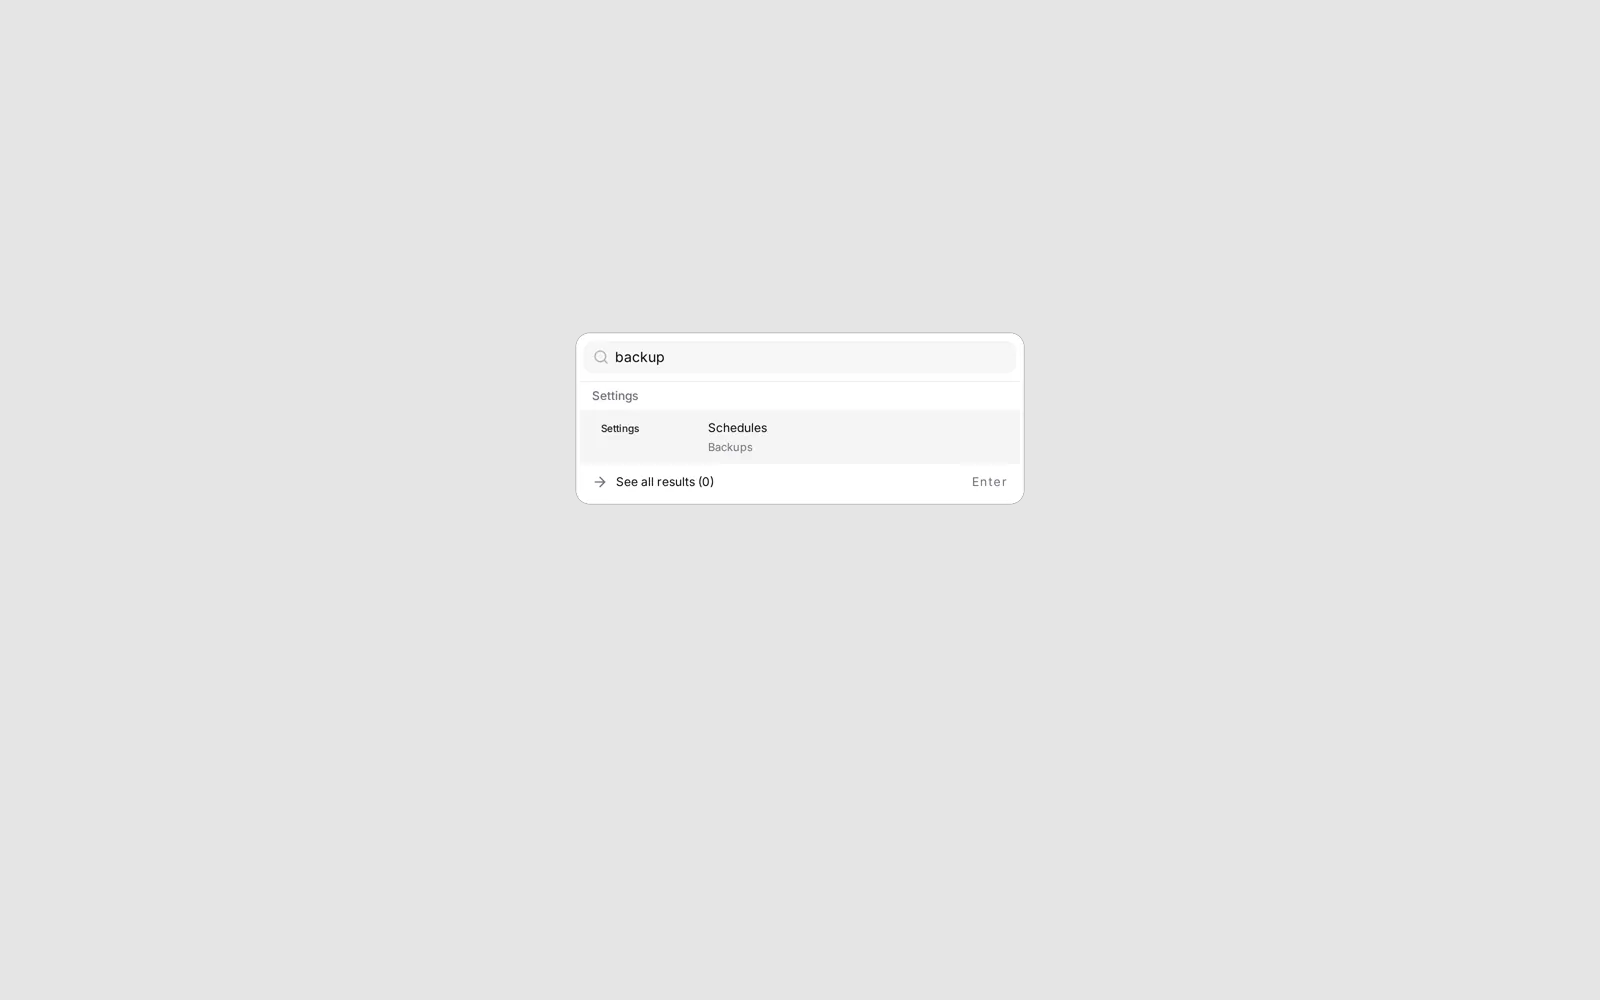 backup finds the Schedules card under Backups, so Enter lands on the card.
Backups Danbyte takes of itself
Danbyte backs itself up from Settings, Backups. One .dbk archive holds the database, the uploaded media and the non-secret deployment configuration, encrypted with AES-256-GCM under a key derived from MONITORING_SECRET_KEY. There is no unencrypted option, and the secret keys themselves, DJANGO_SECRET_KEY, DB_PASSWORD, SMTP passwords and TLS keys, are never in an archive, so .env still needs keeping. Targets are a local directory or an S3-compatible bucket; schedules run hourly to monthly with retention by count or age; Scan for archives adopts .dbk files copied in by hand. Every archive carries a manifest with the version, commit, applied migrations and per-type object counts, shown on the page and checked before a restore.
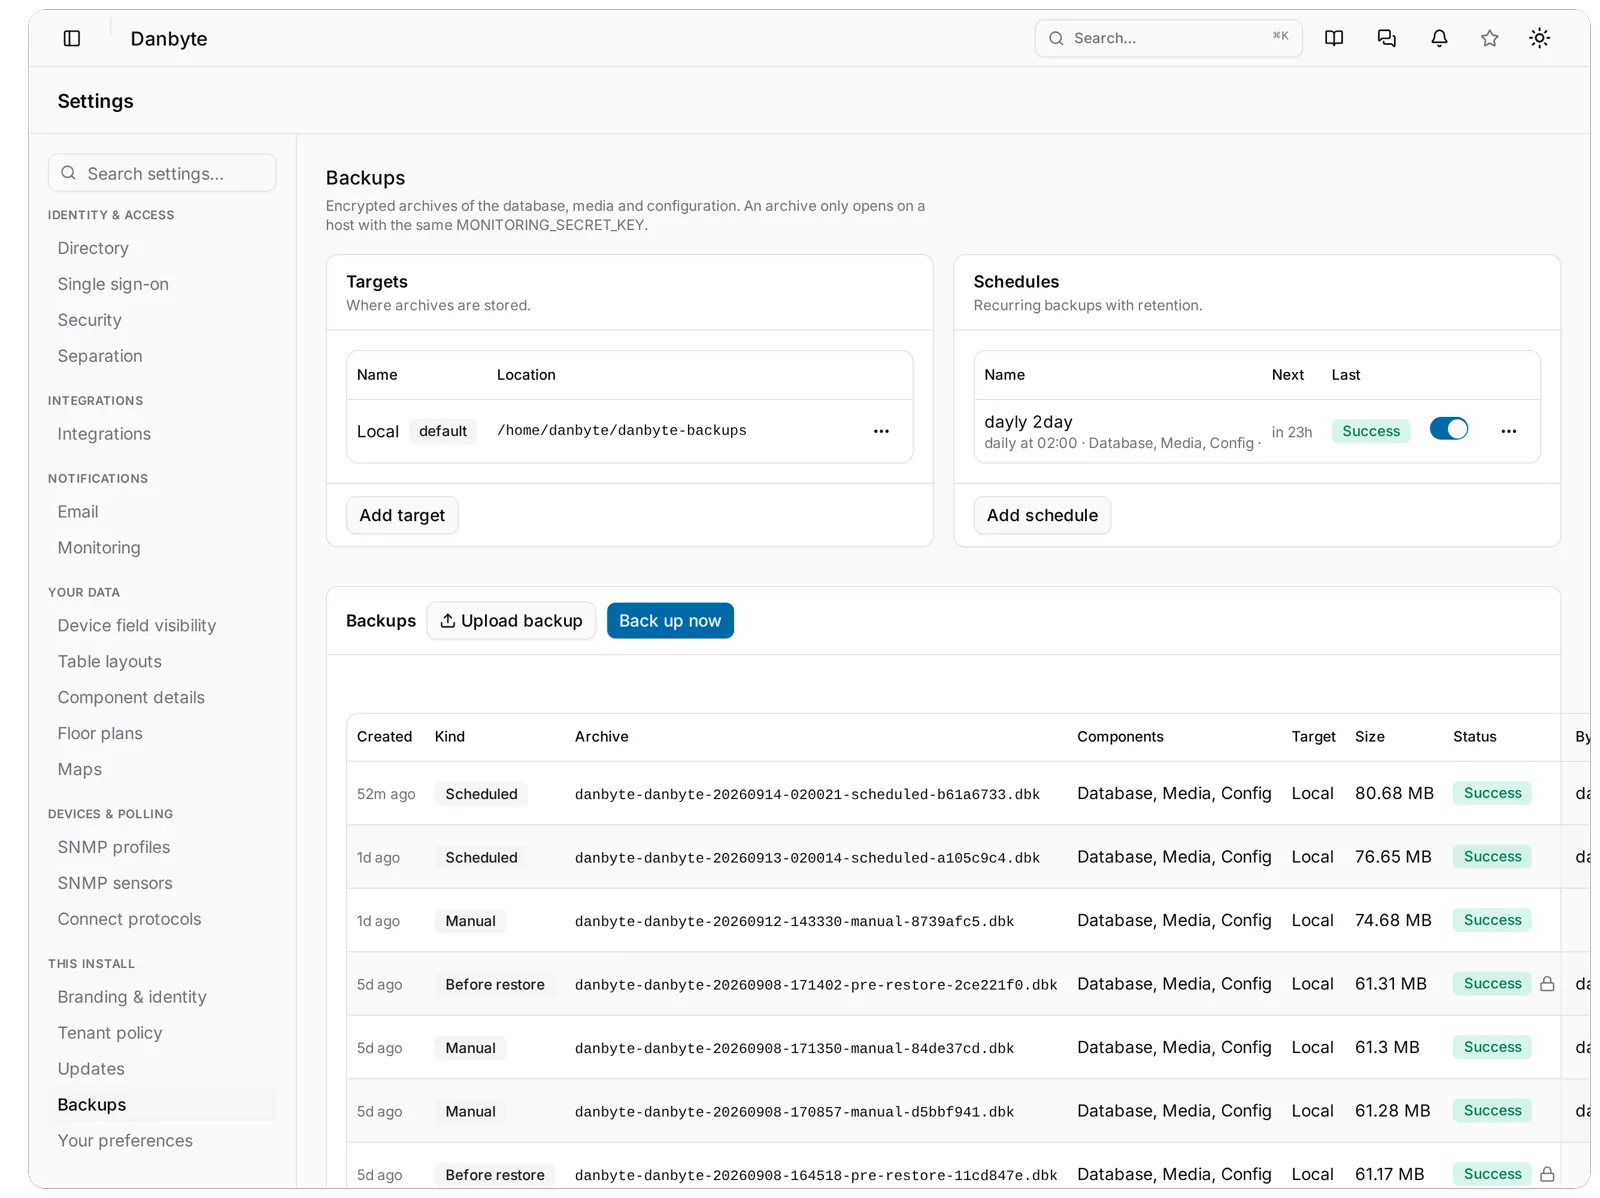
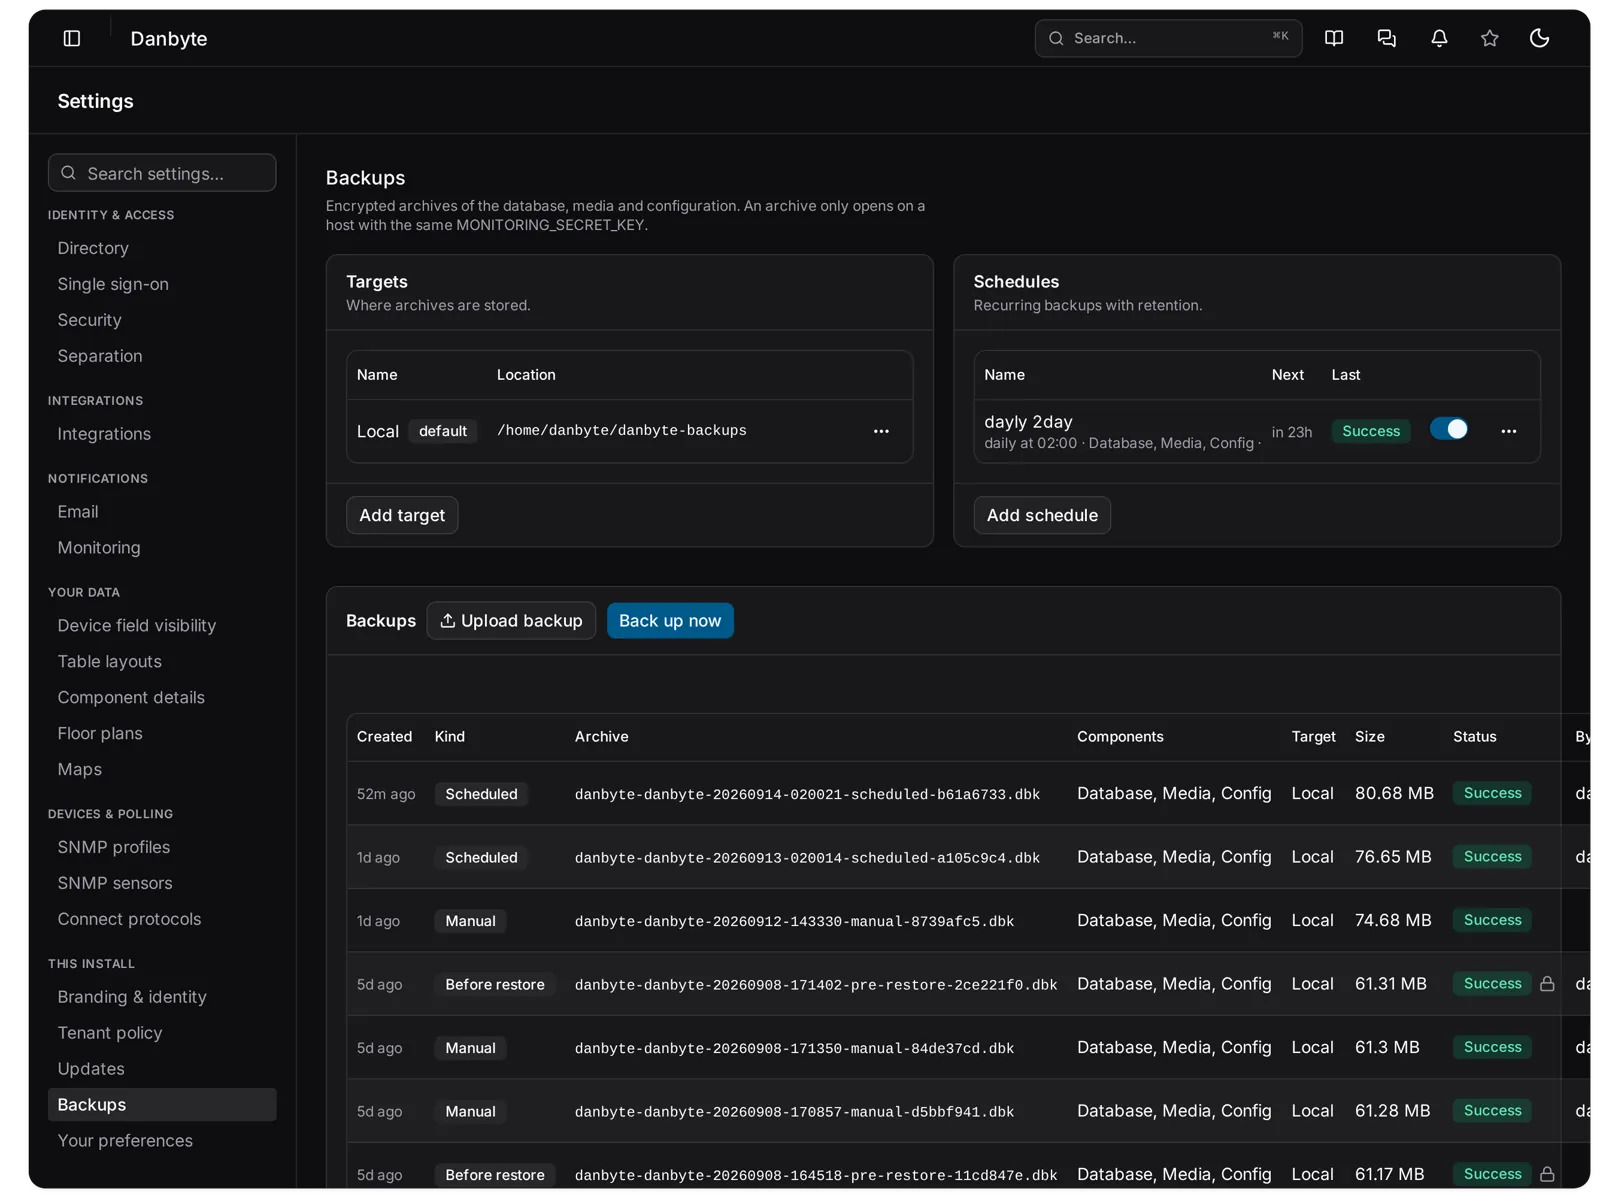 Settings, Backups: the Local target marked default, a daily 02:00 schedule, and the archive table with Scheduled, Manual and protected Before restore rows.
Restore runs from the same page. A preview checks that the archive opens with this host's key, that every migration in it is known to this version, that the role owns the database and there is enough disk, and that no upgrade is running; then it shows what it replaces, in object counts, and asks for the deployment name typed out. The worker takes a protected Before restore backup first, raises the maintenance flag so the site answers 503 with the updating page, restores, migrates, swaps the media tree, rebuilds the search index and clears the flag. Nothing restarts and sessions survive. Every restore leaves a way back, because the Before restore archive cannot be pruned or deleted. Moving to a new host is three steps: same MONITORING_SECRET_KEY, Upload backup, Restore. The upgrade scripts take a Before upgrade backup through the same engine and stop if it fails. This closes #27.
flowchart TD
  A[Restore… on an archive] --> B[Preview: key, components, migrations, disk, no upgrade running]
  B --> C[Type the deployment name]
  C --> D[Take the upgrade lock]
  D --> E[Before restore backup, protected]
  E --> F[Maintenance flag: site answers 503]
  F --> G[Drop schema, pg_restore, migrate]
  G --> H[Reconcile rows and adopt later archives]
  H --> I[Swap media tree]
  I --> J[Rebuild search index, flush queues]
  J --> K[Clear flag: site live, Reload]
  G -. failure .-> L[Run marked failed, flag cleared, Before restore is in the list]
Scripts
Every install ends up with a report somebody wrote once: the manage.py shell one-liner, the notebook on a laptop, the cron job that emails a CSV. 0.16.0 gives that a home. A script is Python you write inside Danbyte, under Integrations, Scripts, that reads and writes your data through the API as you. Run it from a button or on a schedule, with parameters, a live log and files you can download. This closes #65.
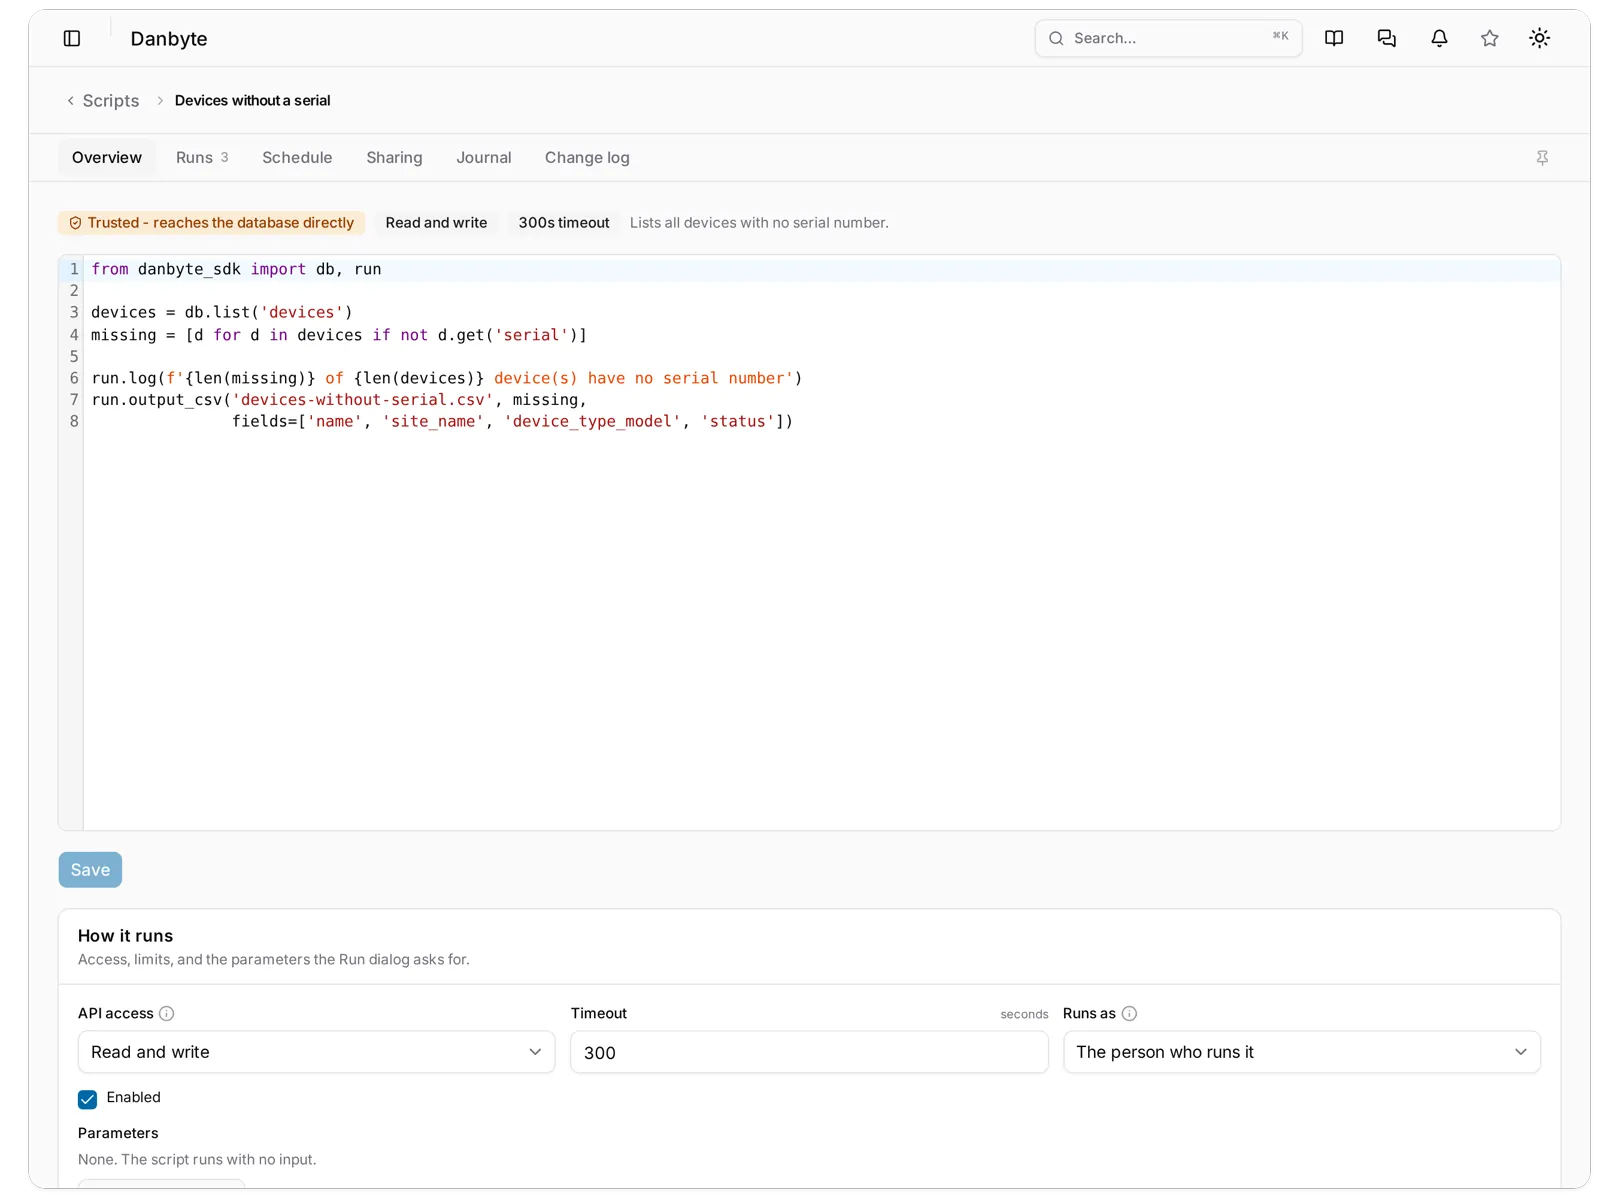
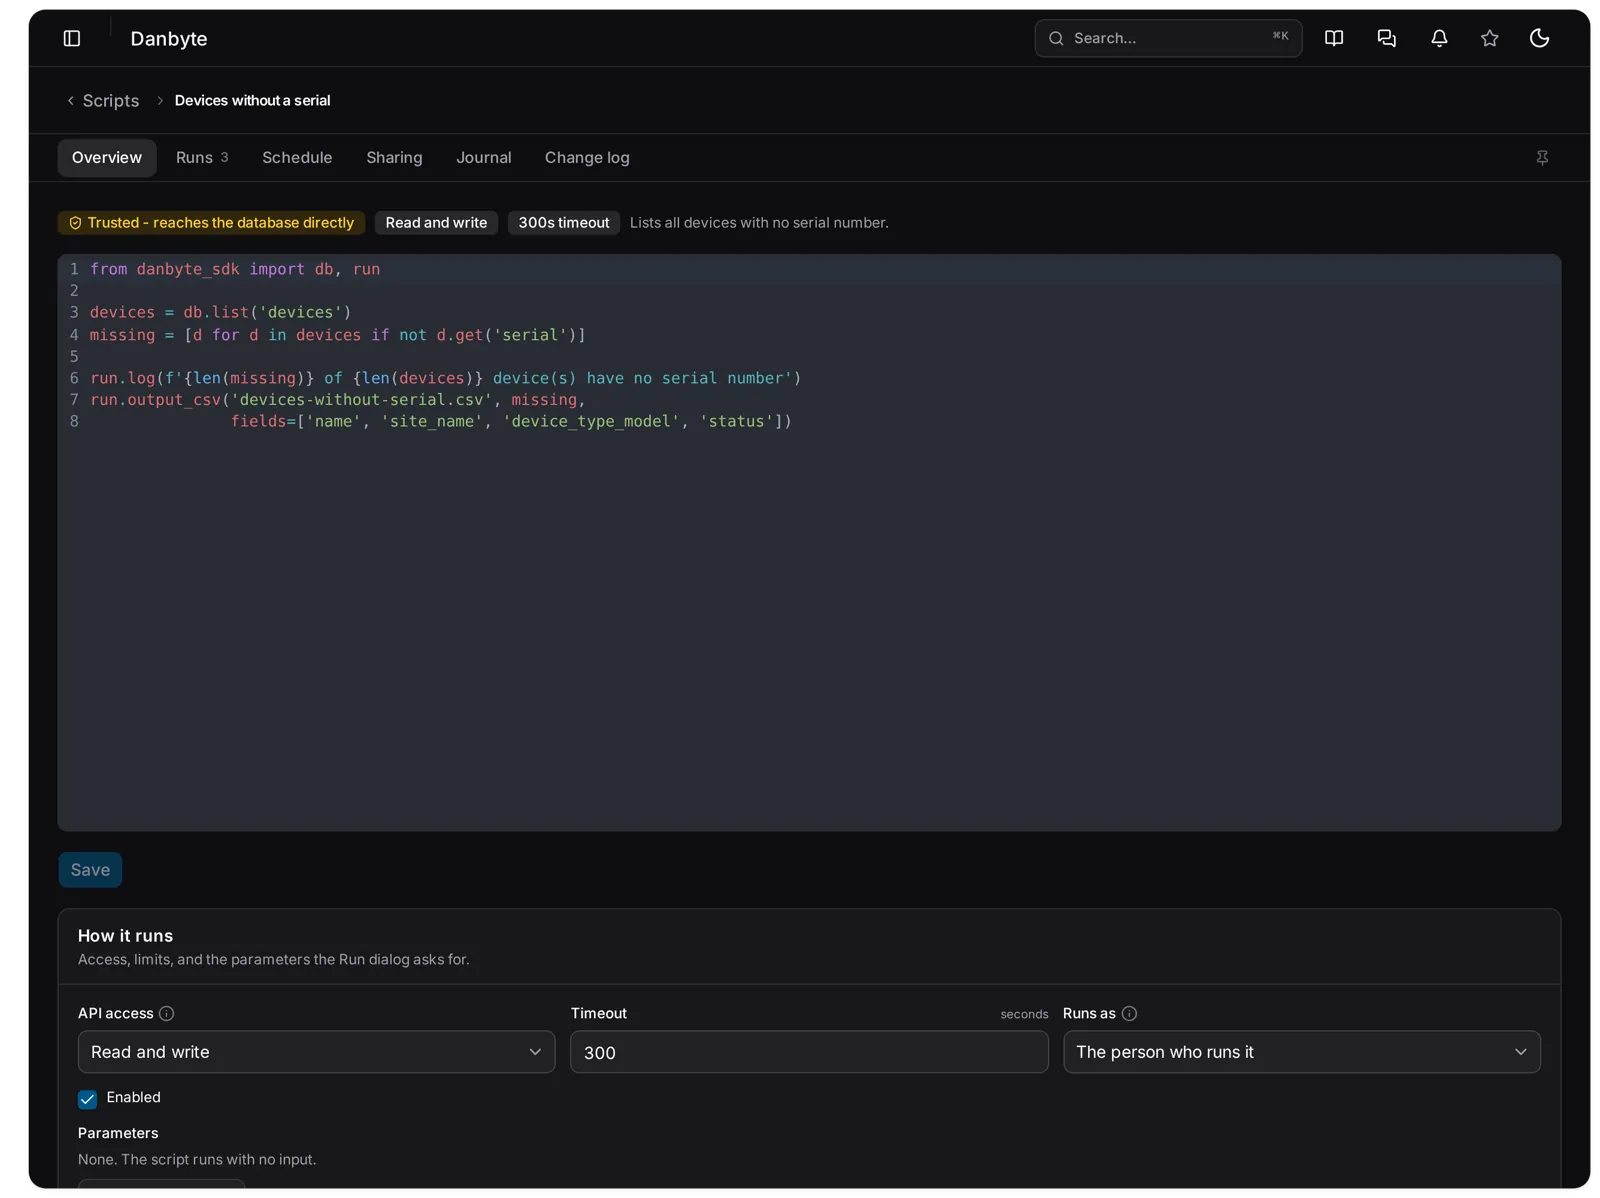 A script's page: the Trusted, Read and write and 300s timeout chips, the eight-line script in the editor, Save, and the How it runs card underneath.
One import gives you everything: db is the API client and run is the current run, with its parameters, its log and its output files. run.log() timestamps a line and flushes it, so it shows in the live log while the script is still going; run.output_csv() and friends write files. The script in the pictures is the whole of the classic case, a report on devices with no serial number:
from danbyte_sdk import db, run

devices = db.list('devices')
missing = [d for d in devices if not d.get('serial')]

run.log(f'{len(missing)} of {len(devices)} device(s) have no serial number')
run.output_csv('devices-without-serial.csv', missing,
               fields=['name', 'site_name', 'device_type_model', 'status'])
Under the editor, How it runs is where the script's access is decided. API access is read and write, or read only, and a read-only run cannot change anything whatever the code says. Runs as is the person who clicks Run, or the script's owner. Timeout defaults to 300 seconds; an hour is the ceiling. Parameters are declared here too, as text, whole number, number, yes or no, long text, or one of a list, and the Run dialog builds itself from them; a missing required parameter is refused before the script starts.
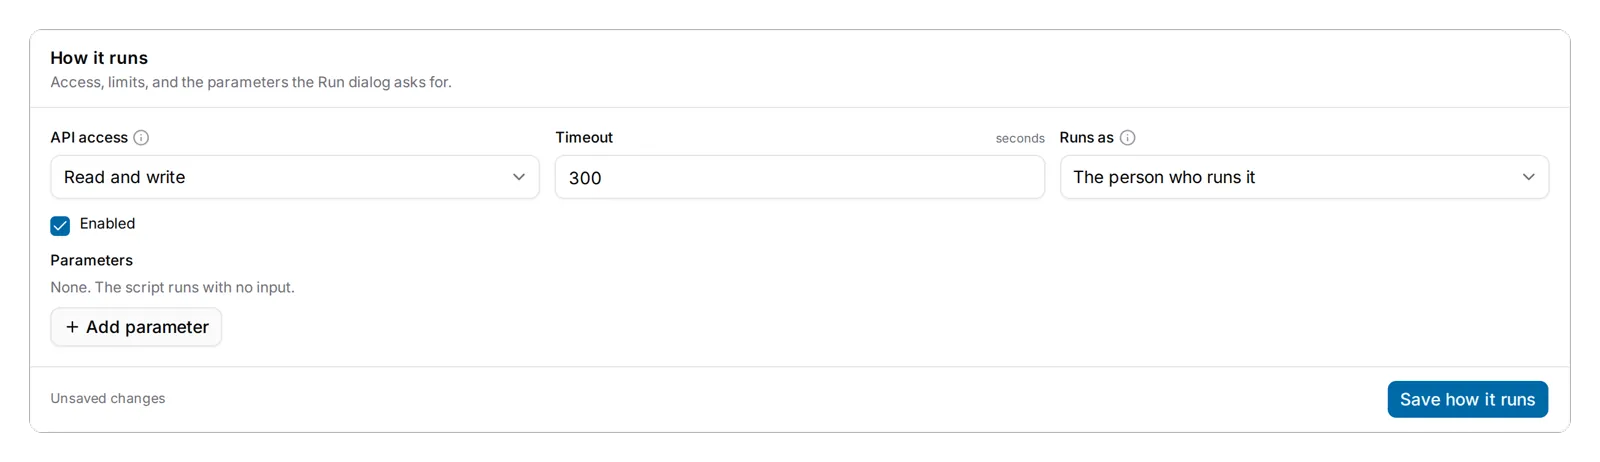 The How it runs card: API access, Timeout, Runs as, Enabled, and the Trusted state with a Make sandboxed button.
Every run gets a run token, an API key minted for that run only, as the run-as account, expiring with the run. So a script sees exactly what that person would see on the page, site scope included, and every change it makes is in the change log under their name. The script itself never sees a database credential, a secret key or Django's settings. It is still a process on the Danbyte host running as the service account: it can open network connections and read what that account can read, and stopping a run takes the whole process tree with it. Runs execute on the RQ workers, so a queued run that never starts means the workers are down.
Trusted is the exception. A trusted script additionally gets danbyte_sdk.orm for direct database access and runs with the worker's own privileges. Marking one trusted is its own permission, script: trust, and the rule of thumb is to grant it only to people you would give a shell. Sharing is per script: only me, chosen users, chosen groups, or everyone in the tenant, and viewing and running are separate permissions on top.
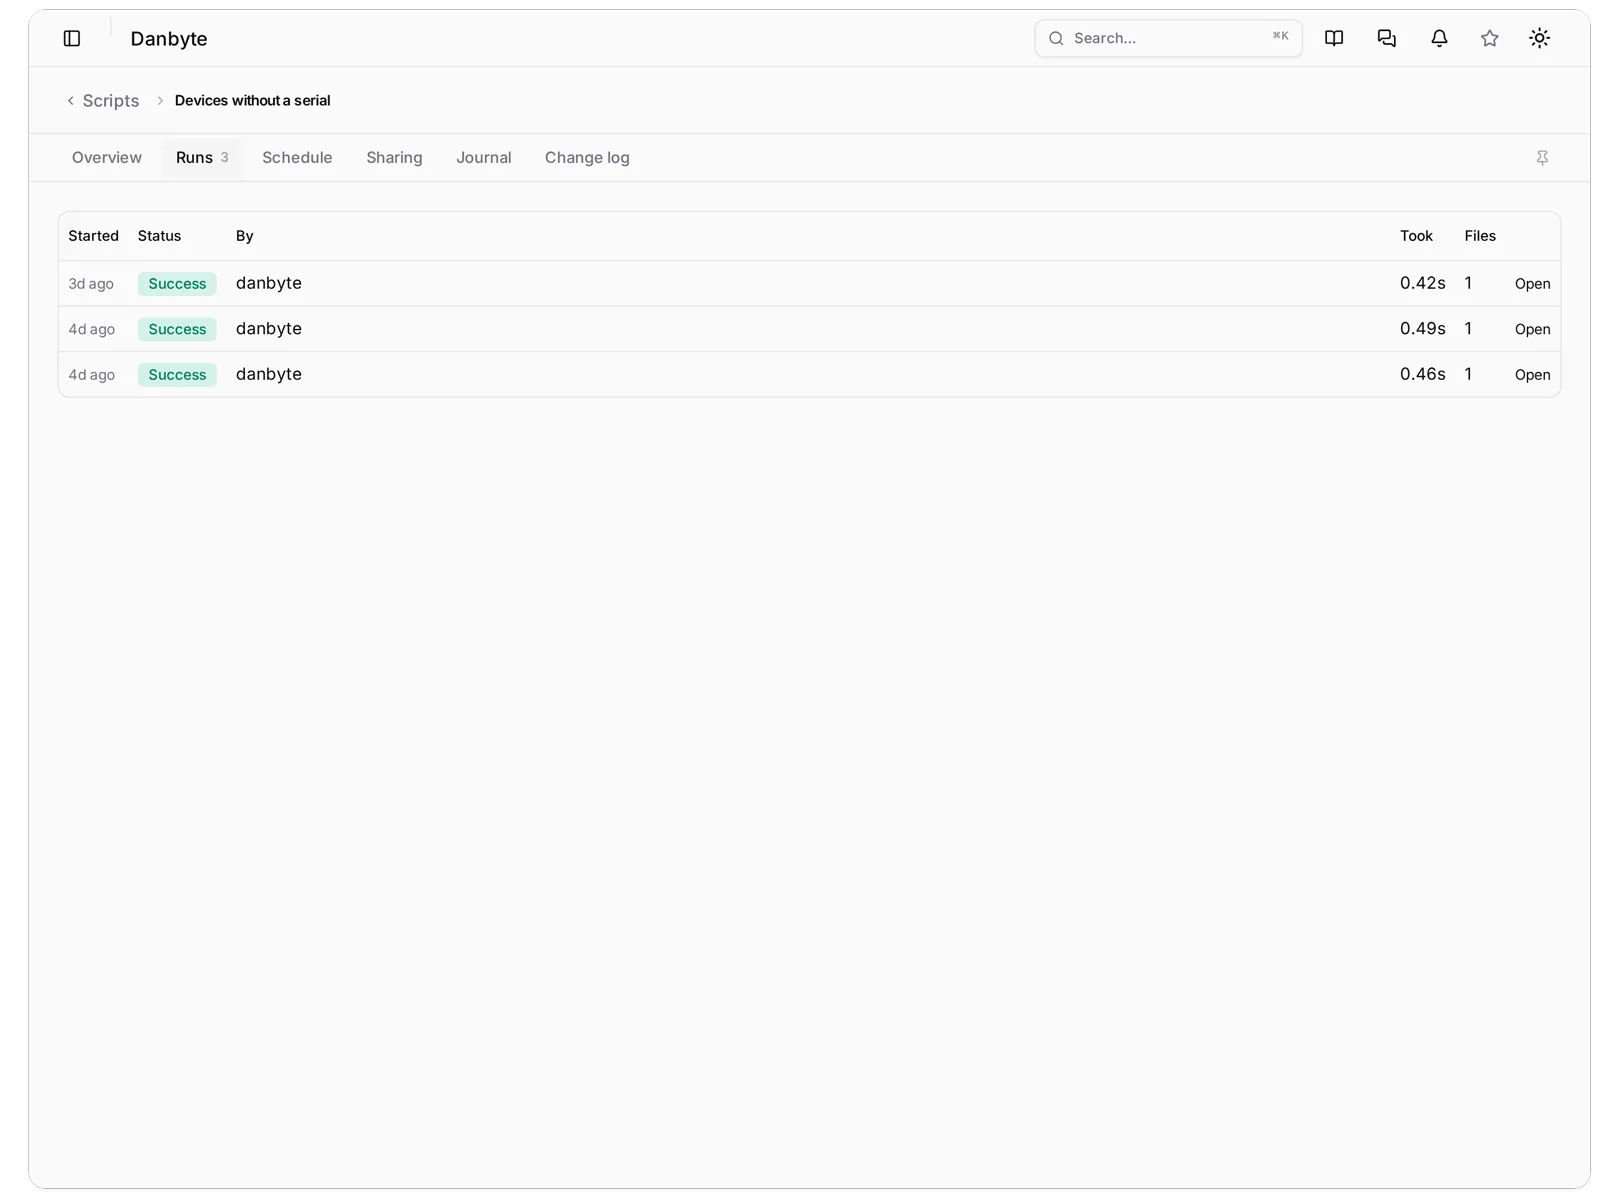 The Runs tab: three runs, each a success, who ran them, how long they took, and the output file each produced.
Each run has a page of its own: the log following its tail while it runs, the parameters it was given, how long it took and who it ran as, the code as it was at the time, and a Files tab where a CSV renders as a table and JSON and text render as themselves, with the download alongside. A monthly report is readable without downloading it. Schedules are hourly, daily, weekly or monthly; a scheduled run belongs to the owner and runs with the owner's access, and Keep runs prunes finished runs by count or age.
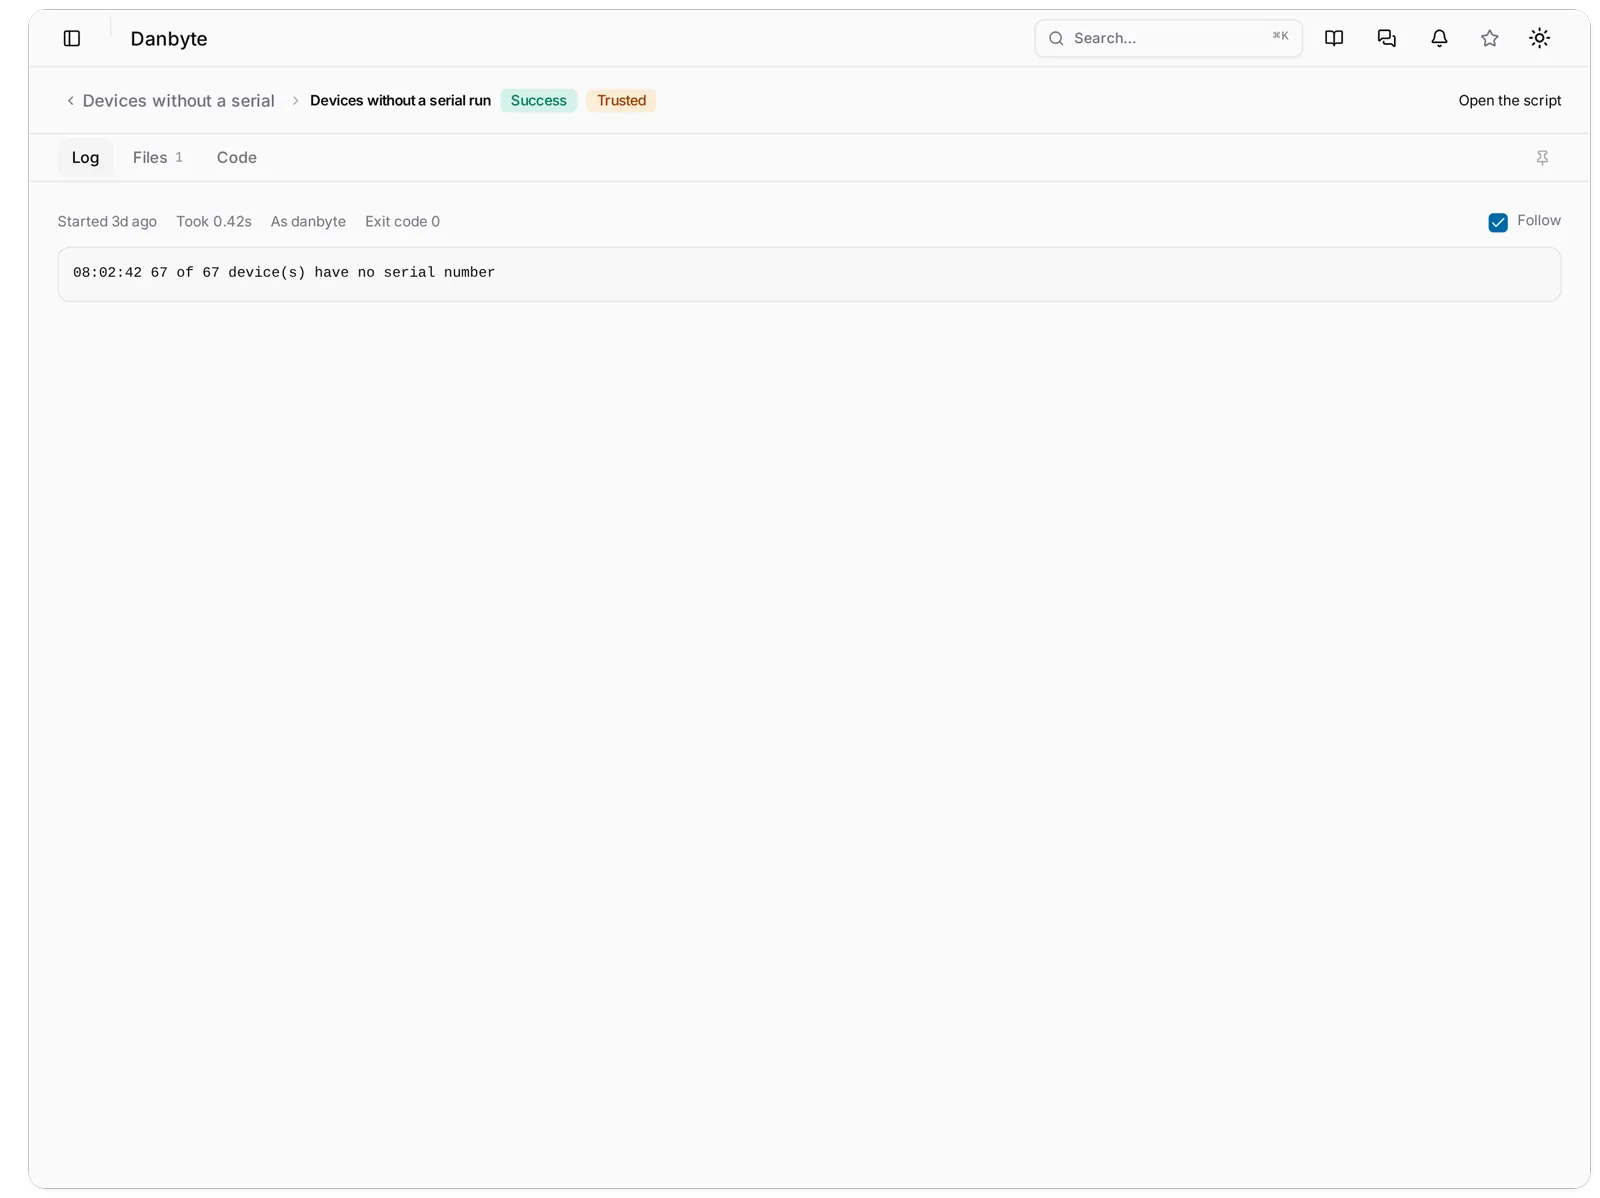
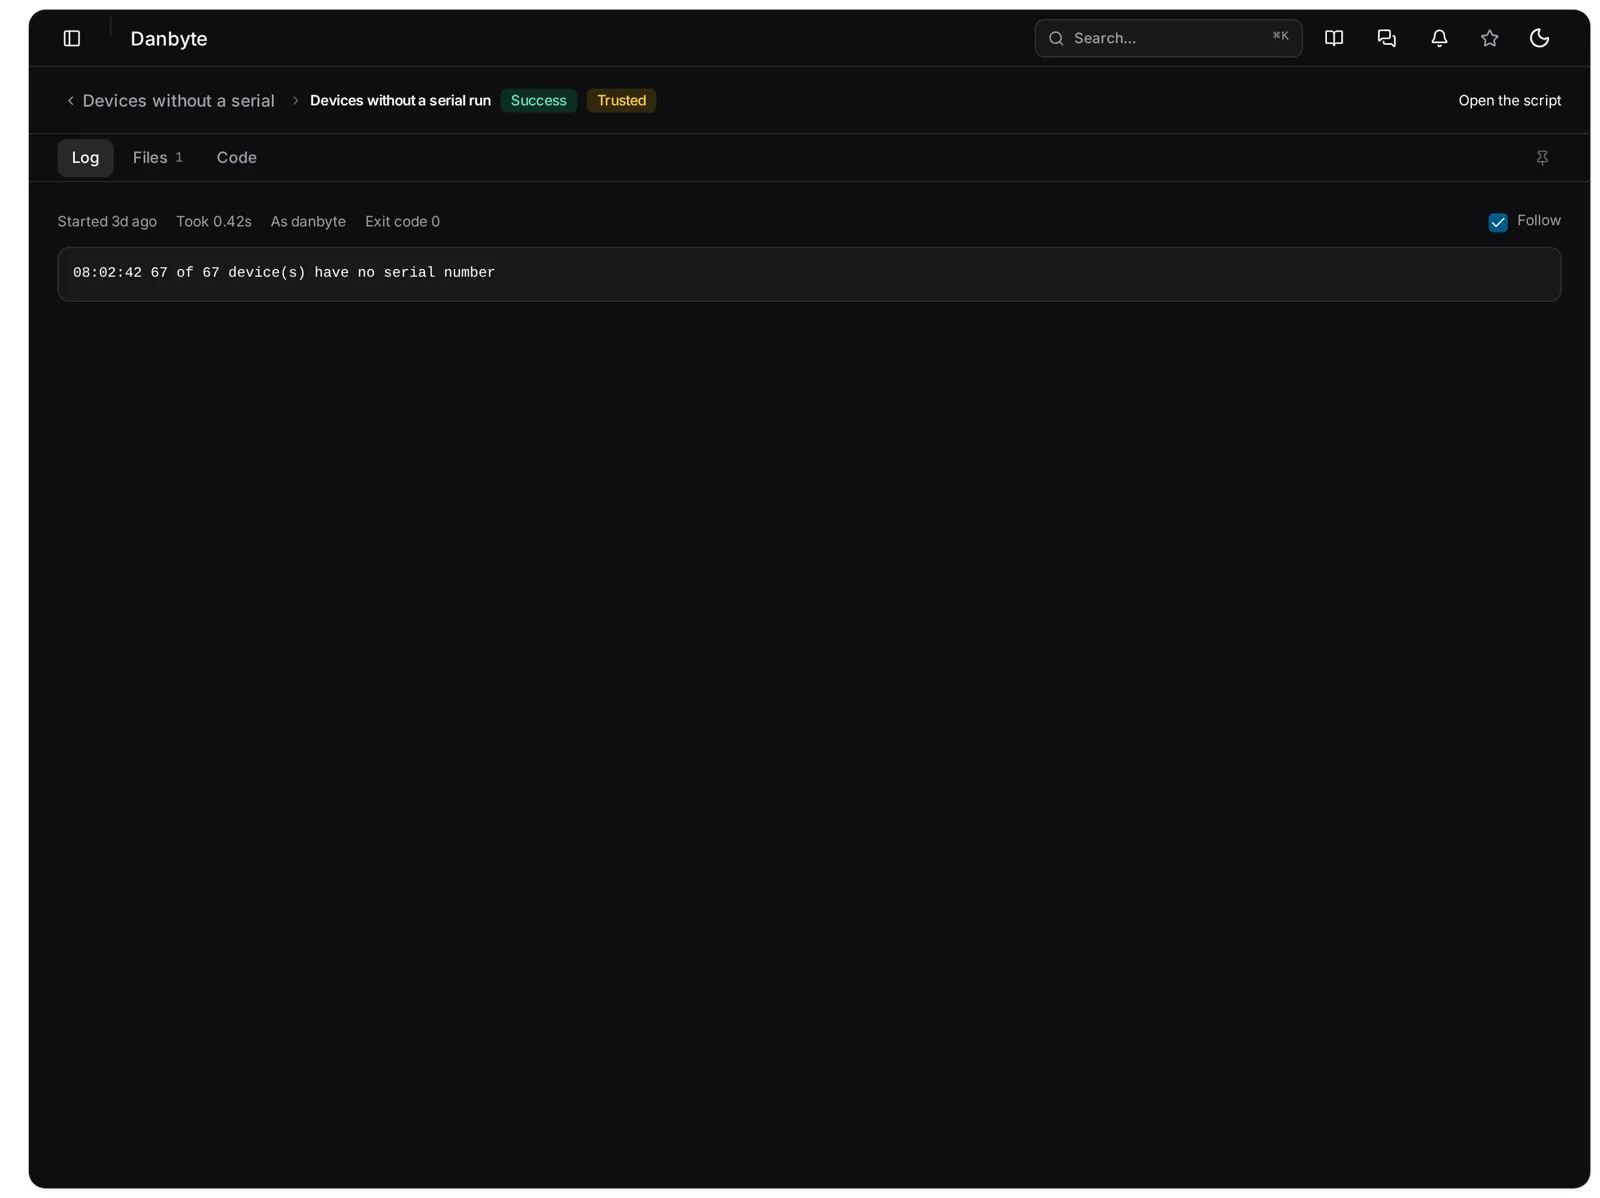 One run's page: Success and Trusted, Started 3d ago, Took 0.42s, As danbyte, Exit code 0, and the log line 67 of 67 device(s) have no serial number.
flowchart LR
  A[Run button or schedule] --> B[Mint run token as the run-as account]
  B --> C[Sandboxed child process]
  C --> D[API calls with the token]
  D --> E[Live log and output files]
  C --> F[Token expires with the run]
Agents and Ask Danbyte
Two ways for an assistant to work with your inventory, and both are off until you turn them on. In both cases the assistant gets the access of the account it uses and every lookup it makes is recorded.
The first is Agent access. Danbyte speaks the Model Context Protocol at /api/mcp/, so Claude Code, Claude Desktop, Cursor, VS Code or an agent of your own can ask it questions with an API token's exact access. Turning it on under Settings, Integrations adds an Agent access page with the connect snippet for each client, filled in with this deployment's URL, so connecting is a paste:
claude mcp add --transport http danbyte https://danbyte.example.com/api/mcp/ \
  --header "Authorization: Token <your-token>"
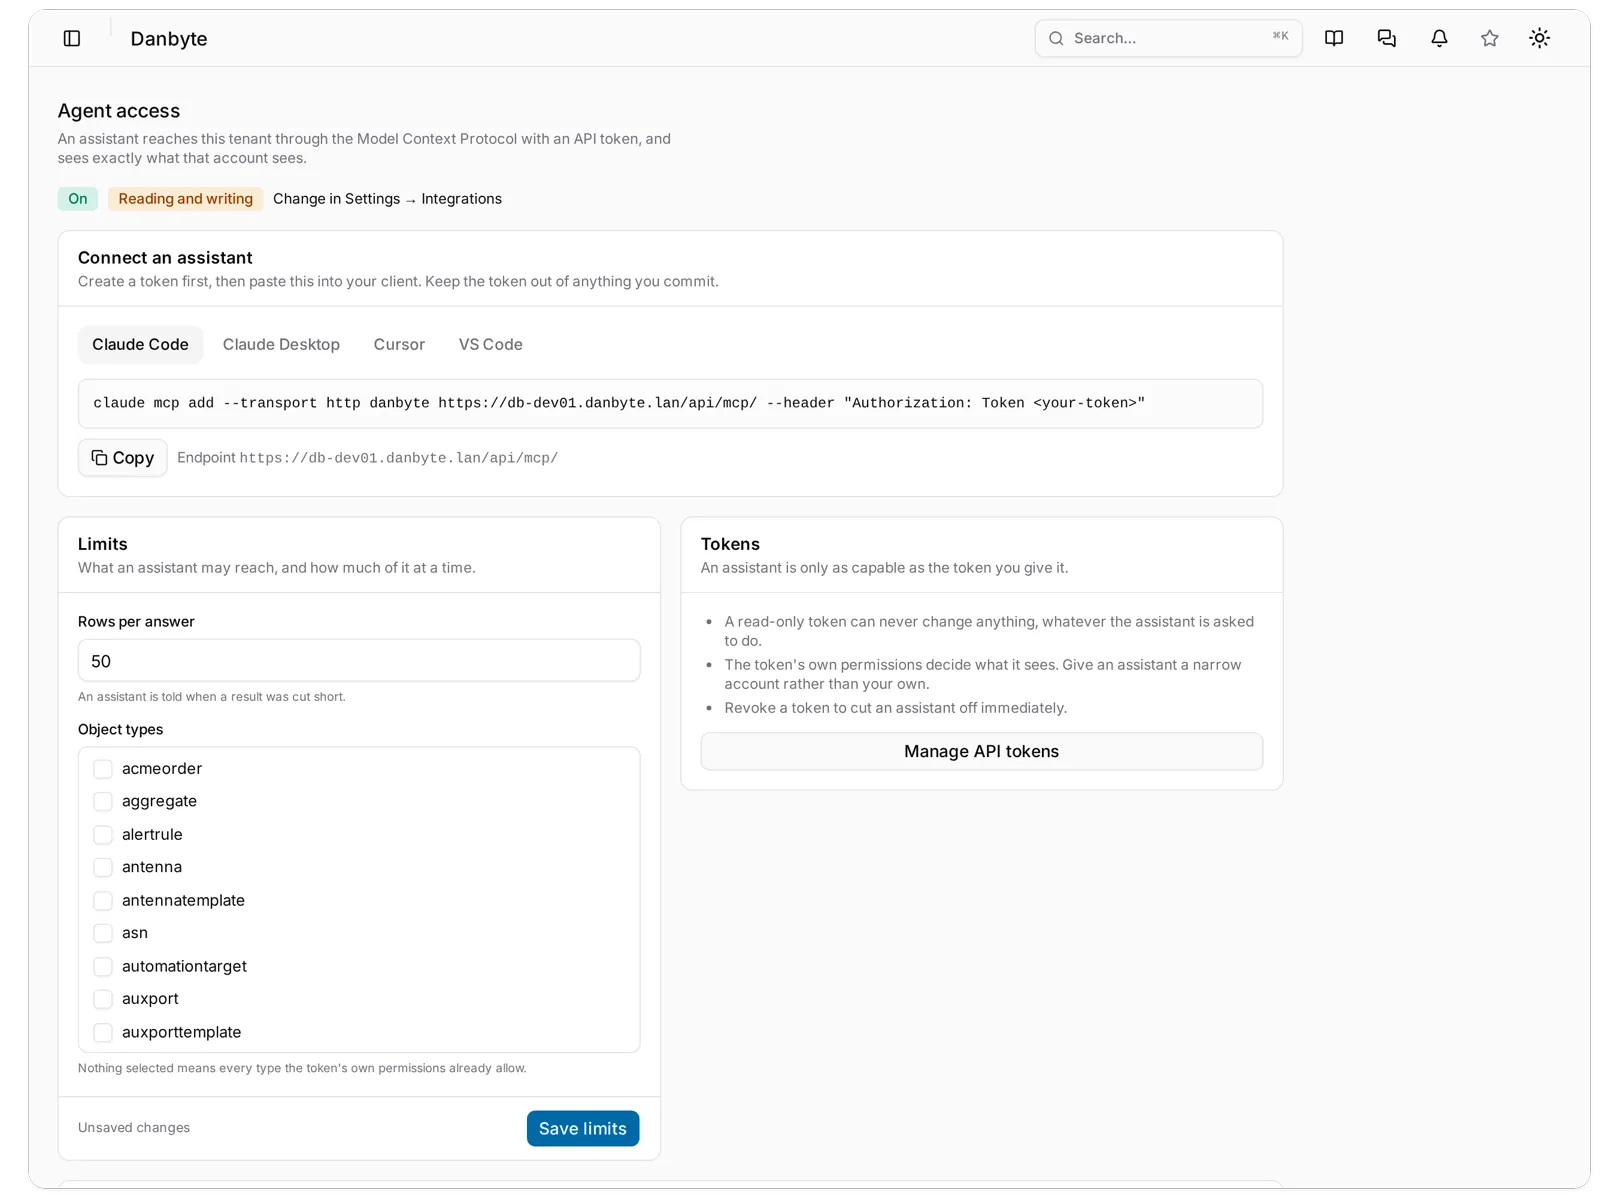
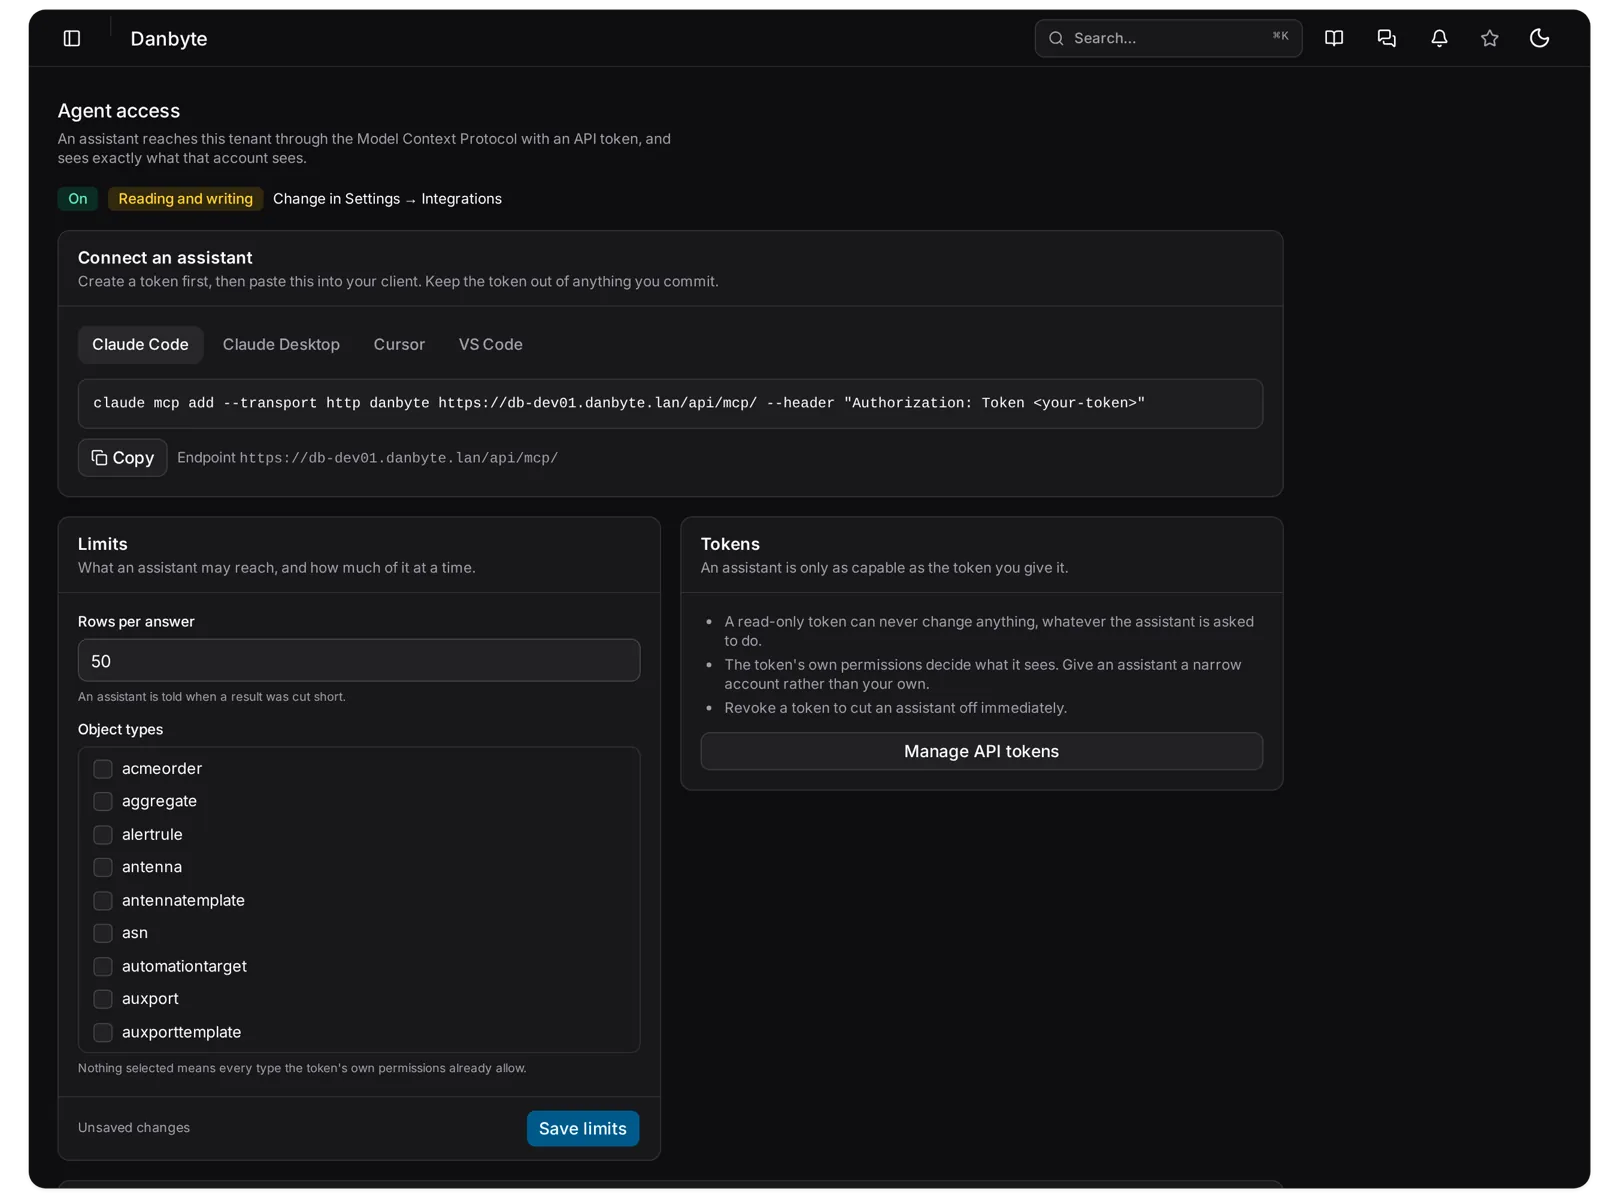 The Agent access page: the Claude Code connect snippet with the deployment's URL, the Limits card with Rows per answer and an Object types checklist, and the Tokens card.
The read tools are types, search (the same ranked search as the palette, tokens included), get, list, count, explain, where_is, monitoring_status, changes, lifecycle, script_guide and find_setting. A second switch, Agent access: allow writes, adds five more: create, update, delete (which must name the object), connect (cables two ports by device and port name) and terminate (lands a circuit end at a site by name). That is the whole list. With writes off, the assistant is told so and cannot change anything.
Every call goes through the same API, serializers, permissions and site scoping as the browser. An object the token cannot see reads "not found", never "forbidden". Secrets are write-only, and anything the secret classifier recognises is stripped from an answer. Answers are capped at Rows per answer, 50 by default, and the assistant is told when it was cut short; Object types narrows which kinds a token may reach at all. A read-only token is refused before any tool runs, and so is a session cookie. Each token gets 120 calls a minute. Writes land in the change log under the token's account, and Recent calls on the same page lists every call: tool, object type, account and token, row count, error. So "what has it actually read" is a page you can open. Agent access ships no model and sends nothing anywhere; it only answers a client you connect.
The second is Ask Danbyte, a chat panel in the top bar, ⌘J or Ctrl+J, that answers questions about your own network through the same tools, as you. Each answer lists what it read, list · 12 rows, and expanding a lookup shows exactly what was asked. Conversations are private to you, it stops after several rounds of lookups, and its calls appear in Recent calls with the client chat. With writes on, a change made from the panel lands in the change log with Via: Assistant and your name. It can write a script for you, "write a script that lists devices with no serial number" saves one with its parameters filled in, but it cannot run one; you do.
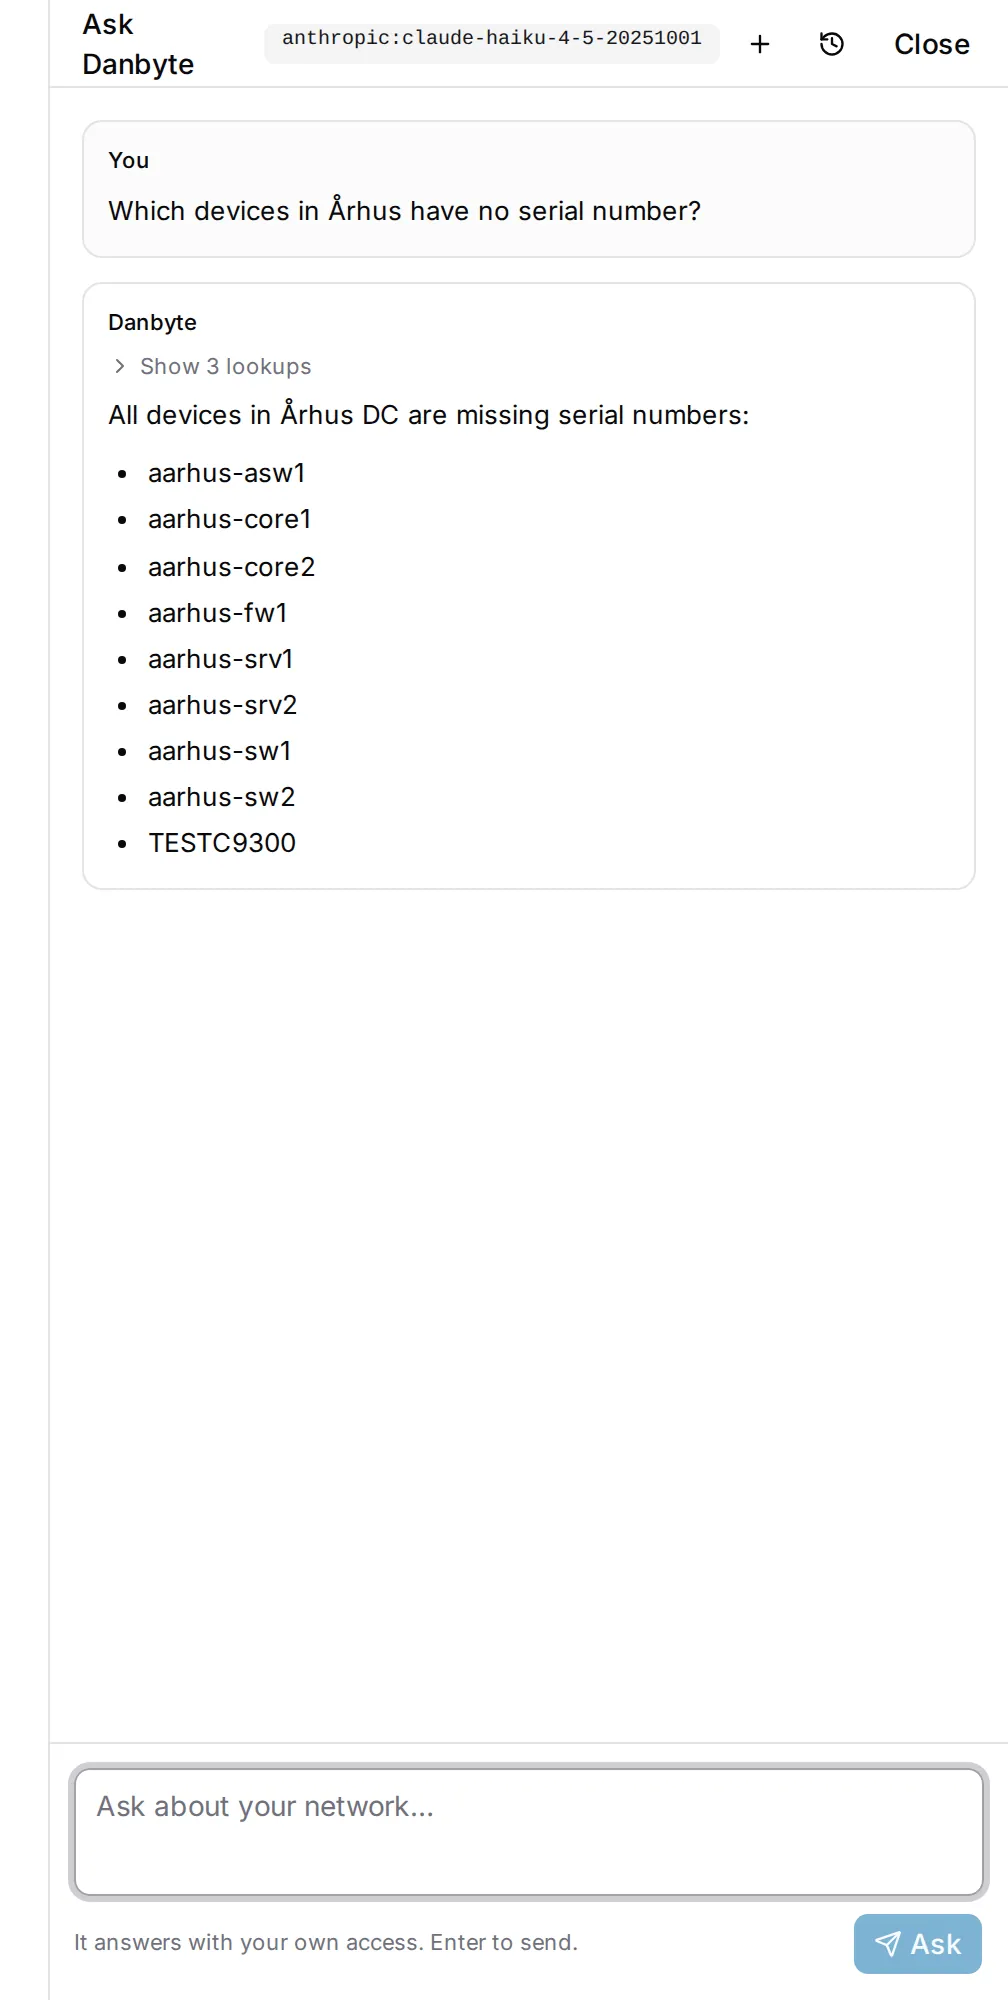
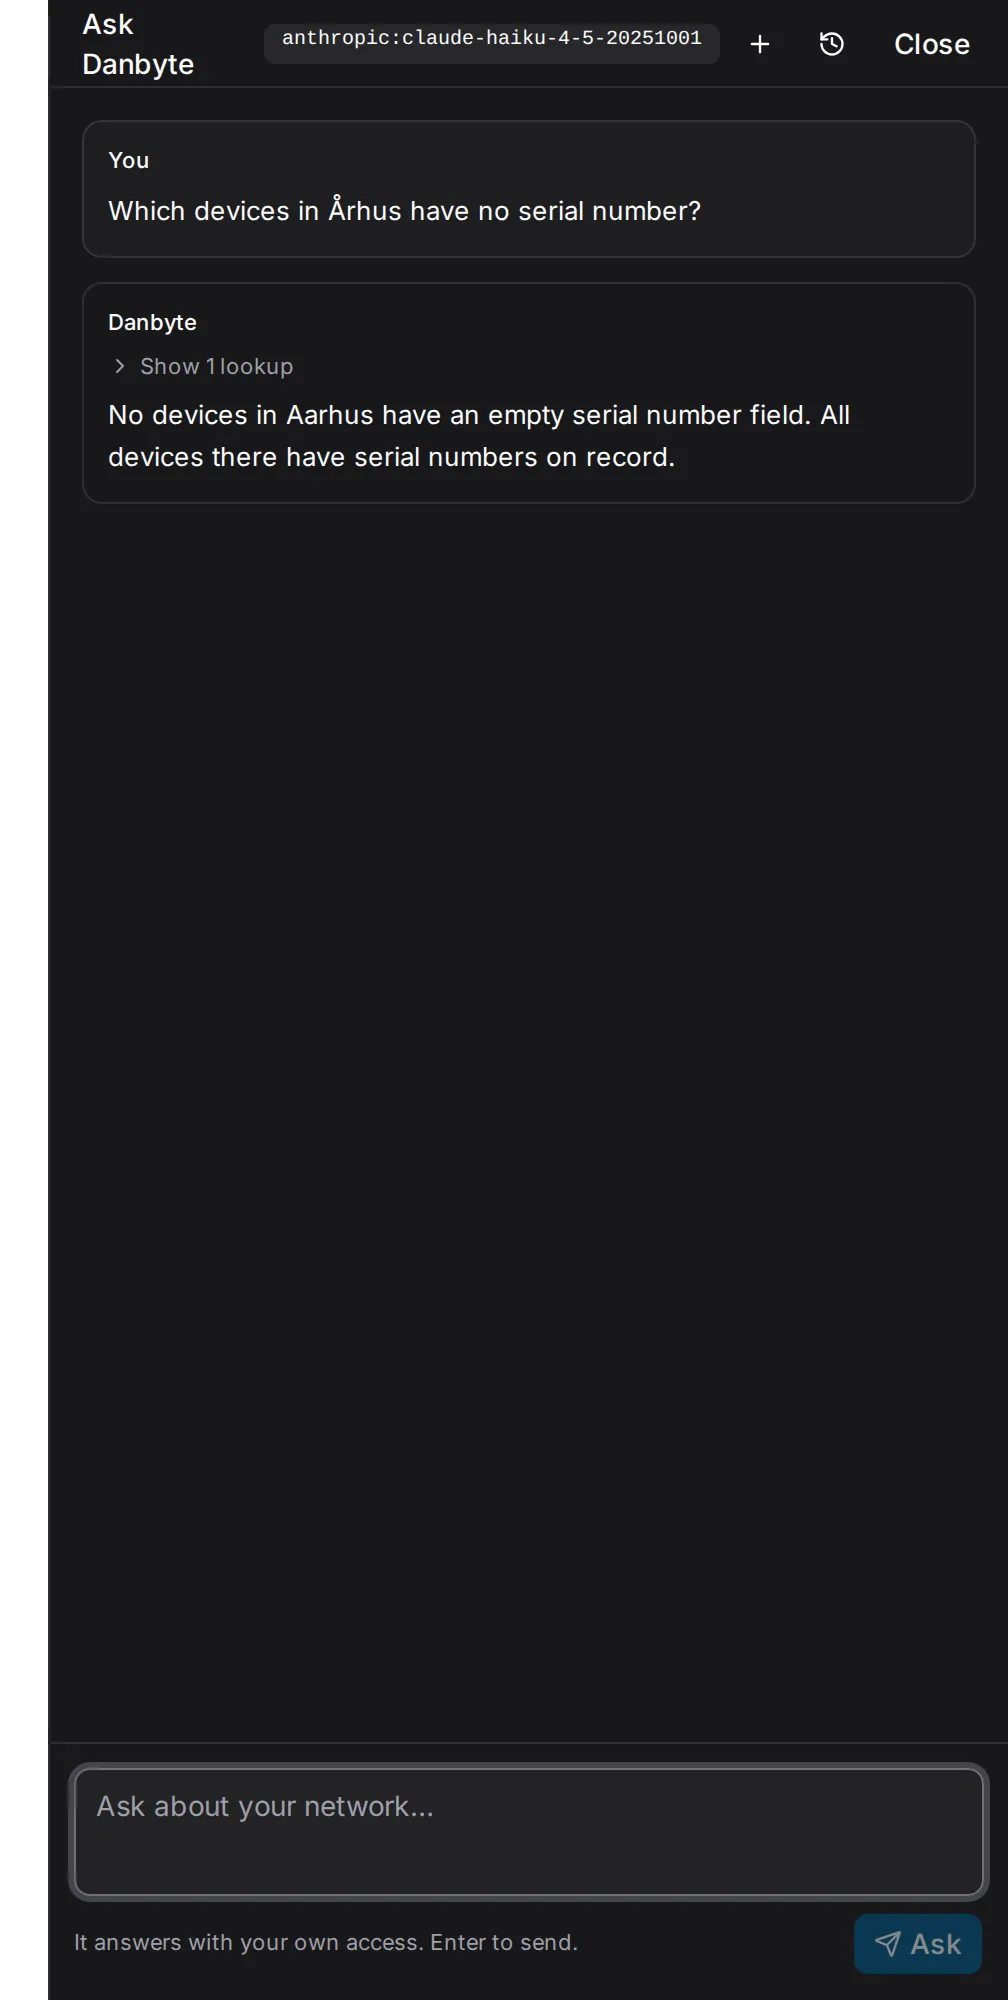 Ask Danbyte: a question about Århus, the lookup it made, and the answer, with the model named in the header.
Turning it on takes two decisions at two levels. A deployment admin connects a model under Settings, Security, Assistant model: Anthropic with an API key; OpenAI-compatible with a key and an endpoint, which covers OpenAI, Azure OpenAI, Groq, OpenRouter and gateways; or Local model for Ollama or LM Studio, no key, an endpoint like http://127.0.0.1:11434. Test connection asks the model for one word. Then a tenant admin turns on Assistant chat. What leaves the building depends on the provider: with Anthropic or an OpenAI-compatible provider, your question and whatever the tools read on your behalf go to that provider. The local provider exists so an airgapped install can use the chat with nothing leaving the network. The chat streams over the WebSocket service, so a proxy that passes /api/ but not /ws/ gets everything in this release except this panel. This closes #11.
flowchart LR
  E[Editor or agent with API token] -->|MCP at /api/mcp/| D[Danbyte tools: same API, permissions, site scope]
  C[Ask Danbyte panel] -->|as you, over /ws/| D
  D --> M{Model provider}
  M -->|Anthropic or OpenAI-compatible| X[Leaves your network]
  M -->|Ollama or LM Studio| L[Stays on your network]
  D --> G[Recent calls log and change log]
Smaller things
A monitoring policy can now be scoped to a region, reaching every site below it, to a site, including addresses with no device on them, or to a platform, on top of VRF, prefix, device type, role and device. Any policy can be narrowed by a device name glob (core-*, *-fw??), by tags the device must carry, or by the interface an address is bound to (Gi0/0/*). Filters narrow, never widen. "Monitor the primary IP of everything in Europe" or "only the uplinks on the core switches" is one policy. Scopes run loosest to tightest and a prefix policy takes its rank from its mask length, so a /24 outranks a role policy and a /8 is outranked by a VRF one.
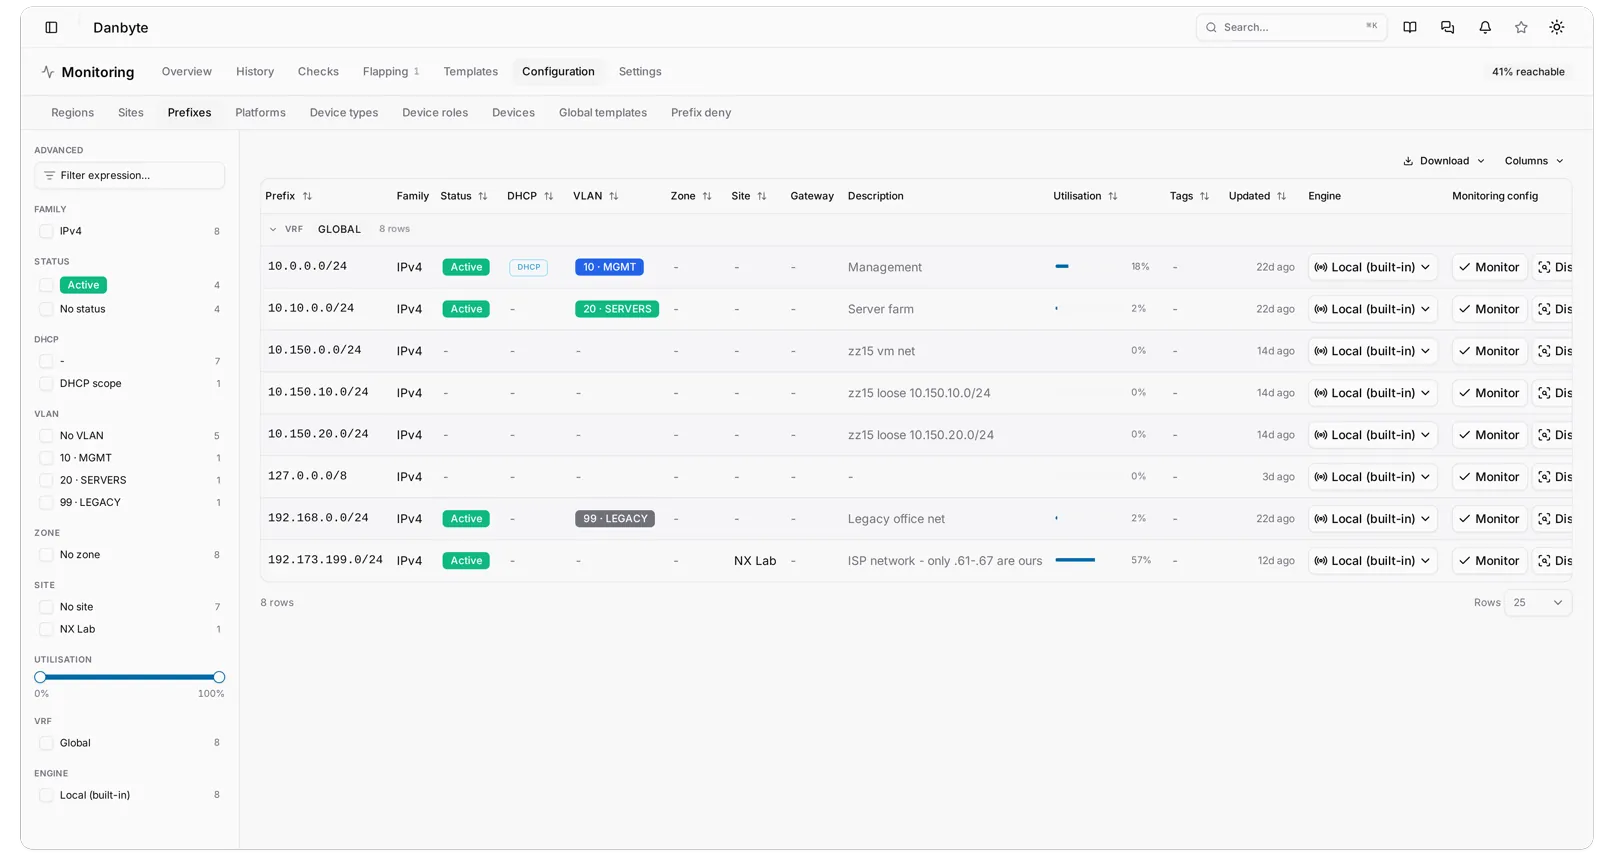 Monitoring, Configuration with the new scope tabs: Regions, Sites, Prefixes, Platforms, Device types, Device roles, Devices, Global templates and Prefix deny.
Settings opens on a hub of every page you can reach, grouped by what a setting is about rather than by which admin tier owns it; the tier is a Deployment, This tenant, This site switch on the page. One catalog drives the hub, the sidebar, the settings search and the assistant's "where do I change X" answers, so they cannot disagree, and a test fails the build if a card is renamed in one place and not the other. Integrations are toggle cards on one page, Proxmox VE sync, vCenter sync, DHCP sync, DNS sync, Zabbix monitoring, Agent access, Assistant chat, each with a button into its own pages; a disabled integration hides its pages and stops its syncs. Plugins sit on the same page with their load state and an Upload plugin button for offline installs. This closes #51.
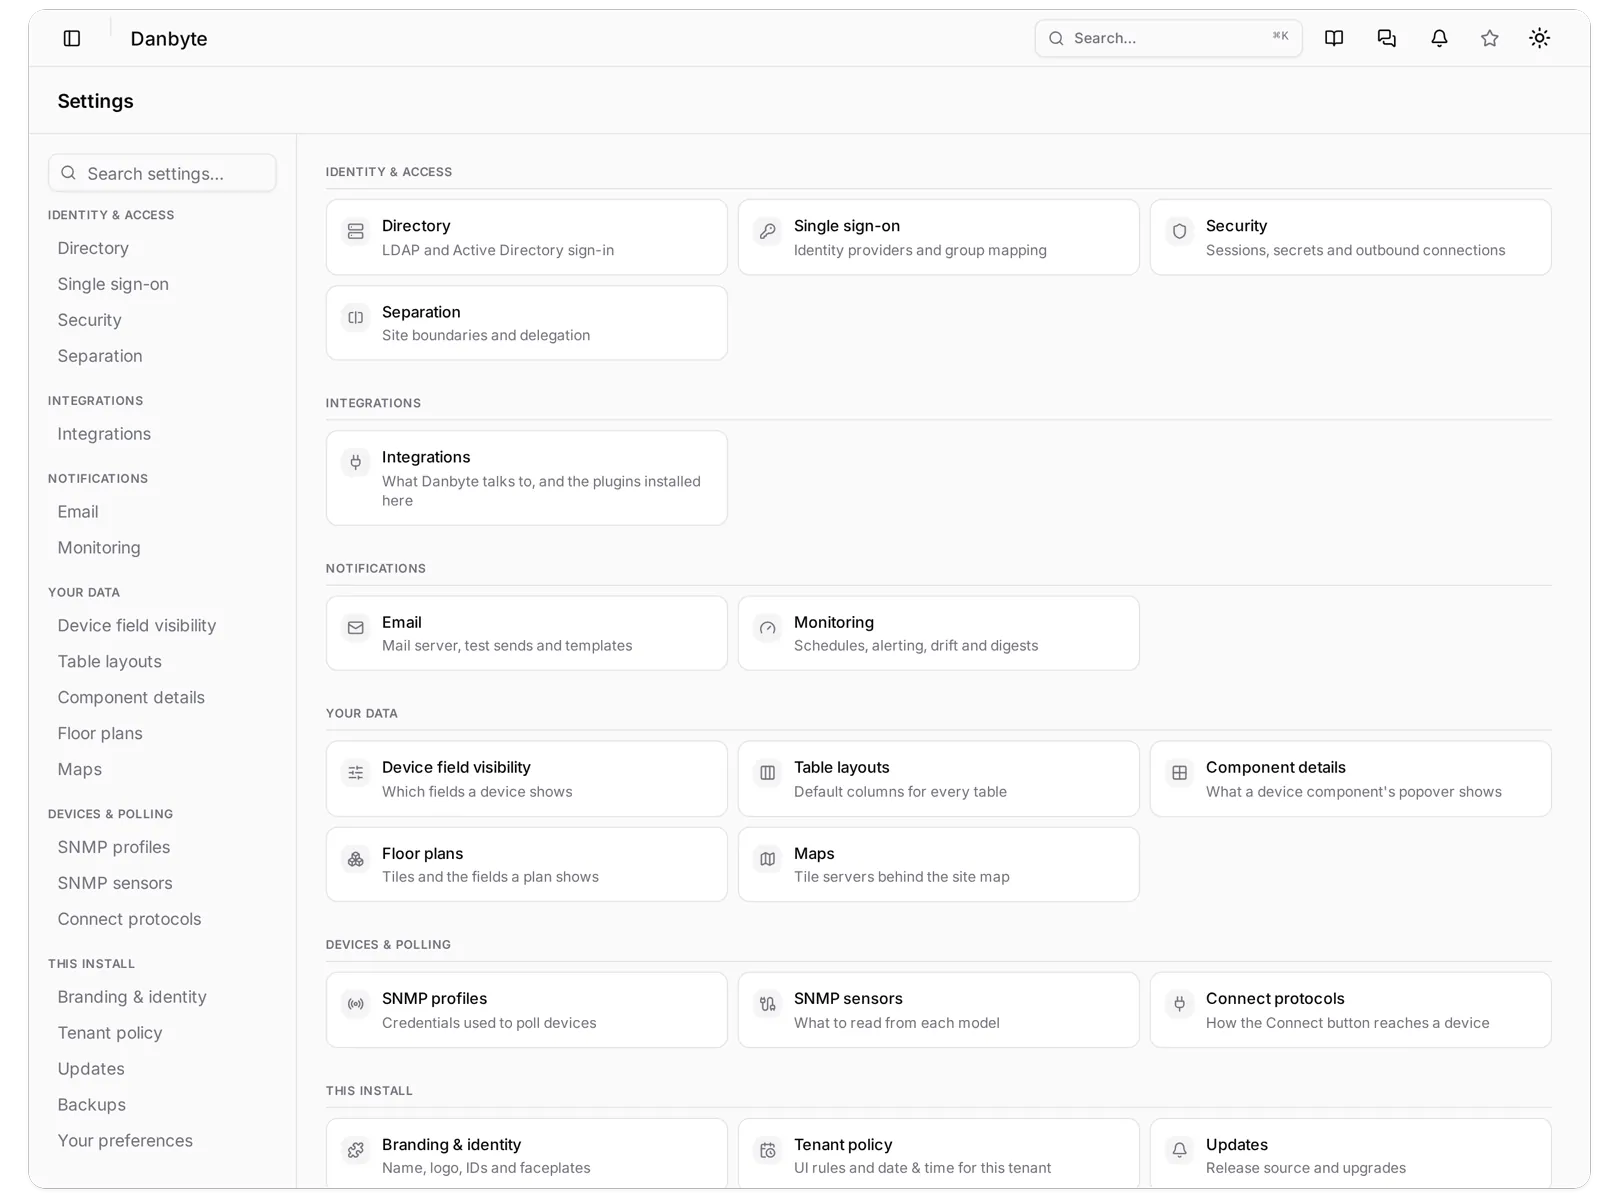
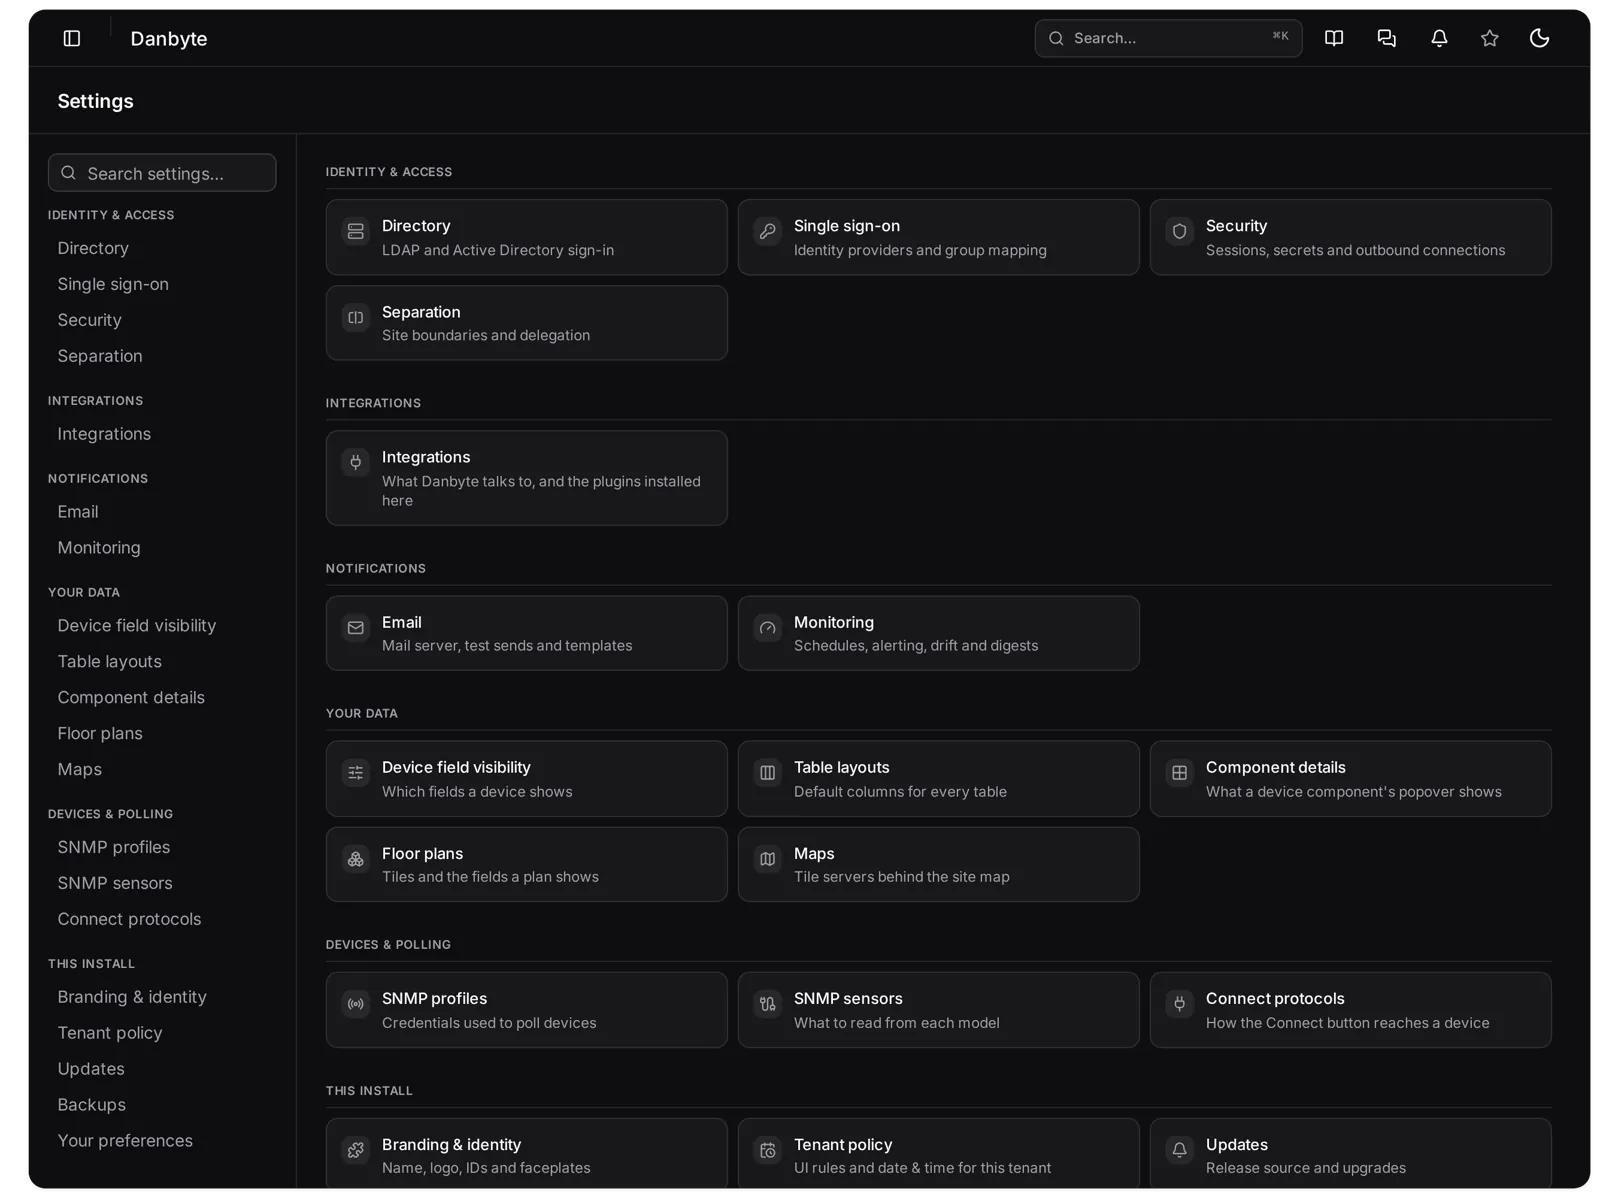 The Settings hub, grouped by subject.
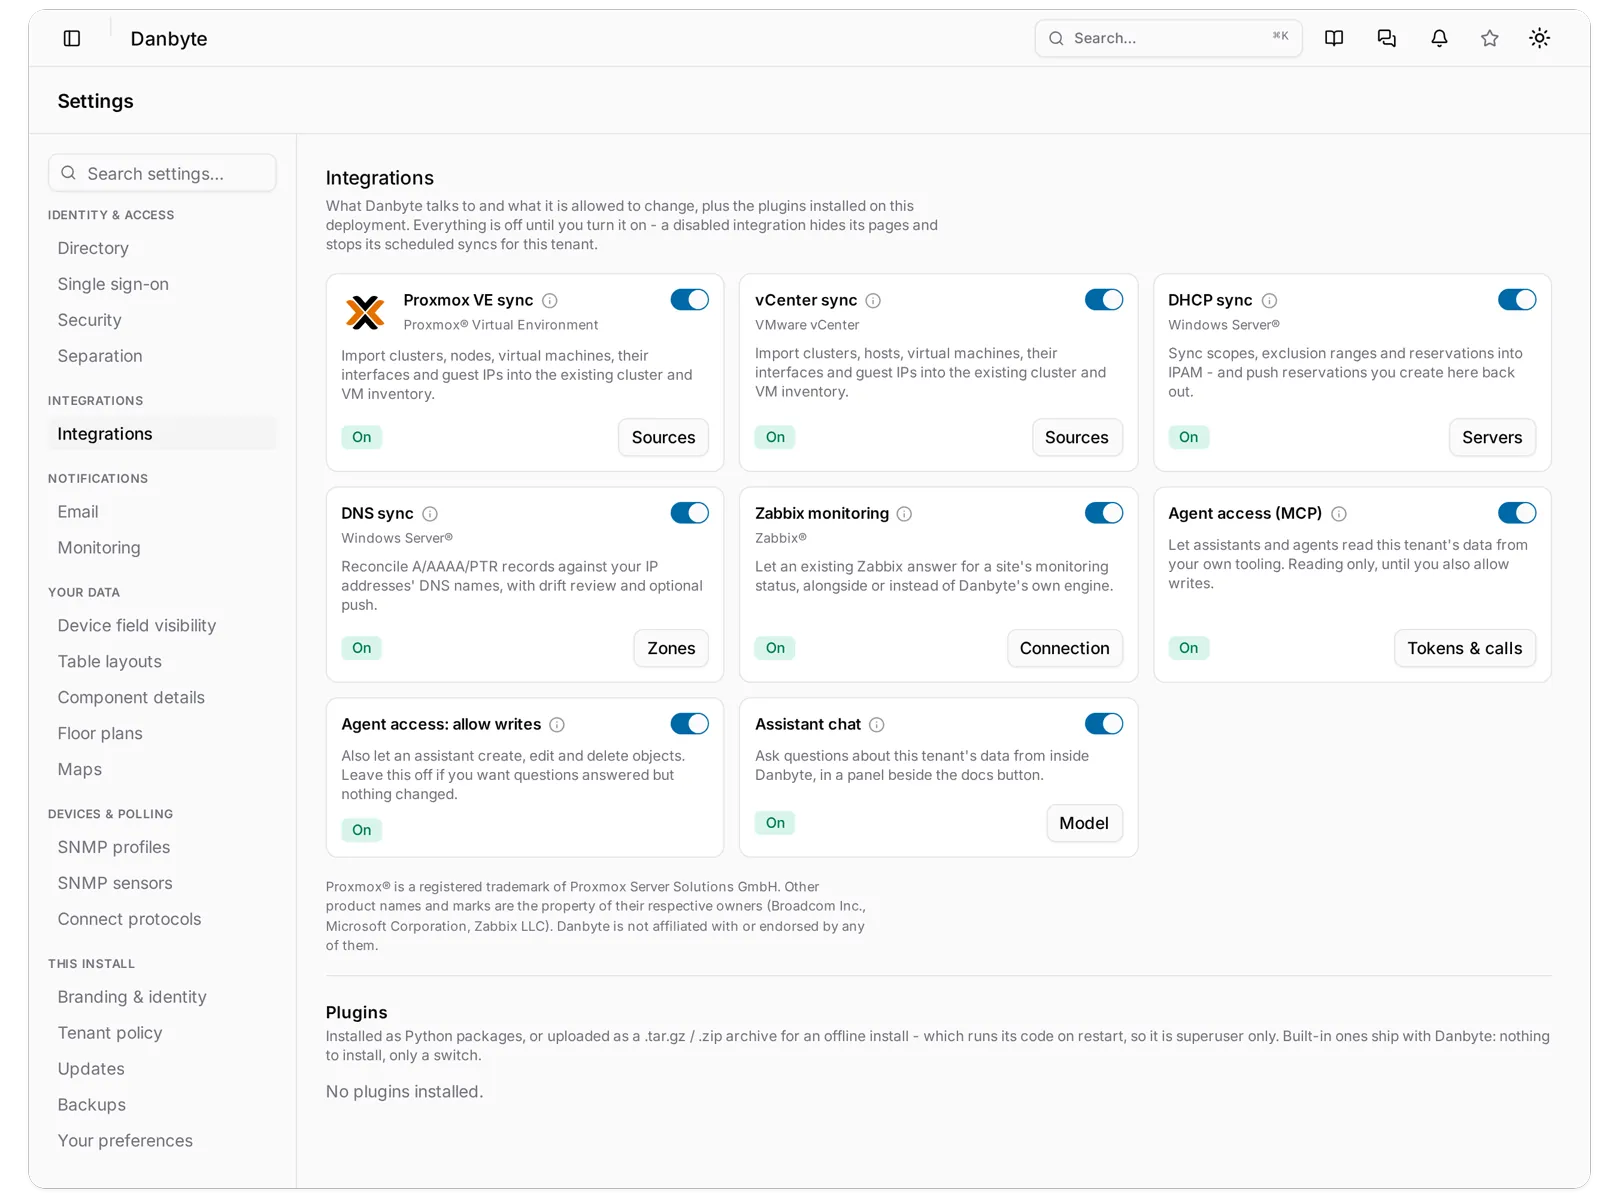
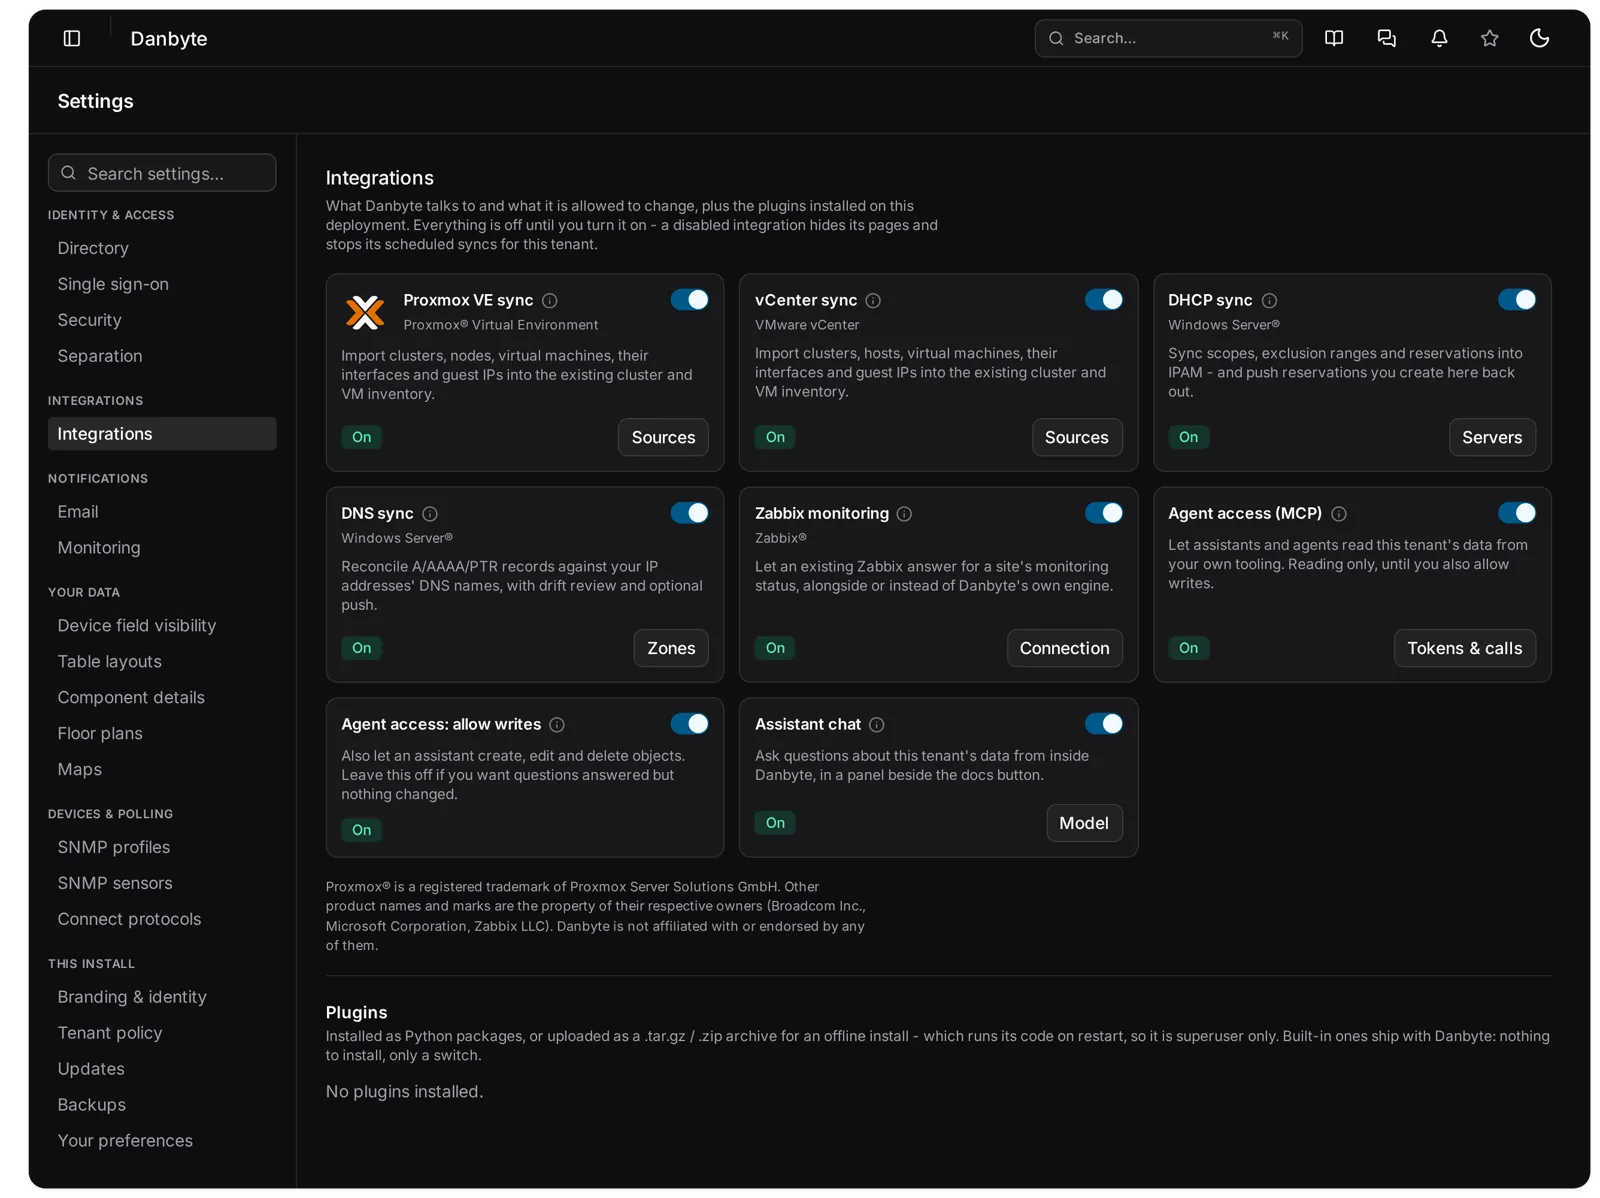 Integrations as toggle cards. Everything was switched on for this lab; every one ships off.
A device, VM or virtual chassis page has a Spec sheet button that renders a printable A4 PDF: elevations, stat boxes, details with custom fields, modules and inventory, and the interface table with MAC vendor, VLAN, IPs and cable peer. It is built for handing to a site technician or a customer who never opens Danbyte, and it prints in black and white. GET /api/devices/<id>/spec-sheet/ returns it. This closes #150.
NAT rules
A NAT rule records a translation a firewall performs, a port forward, a 1:1, a source NAT or a masquerade, with the firewall as an ordinary device link, an outside and an inside end pointing at real address records, an optional source restriction and a status from the catalog. So a public address's page shows what it forwards to and an internal server's page shows what reaches it, and "what is 203.0.113.10:443?" is answered without the firewall's rule base. It is documentation: Danbyte writes nothing to any firewall. This closes #151.
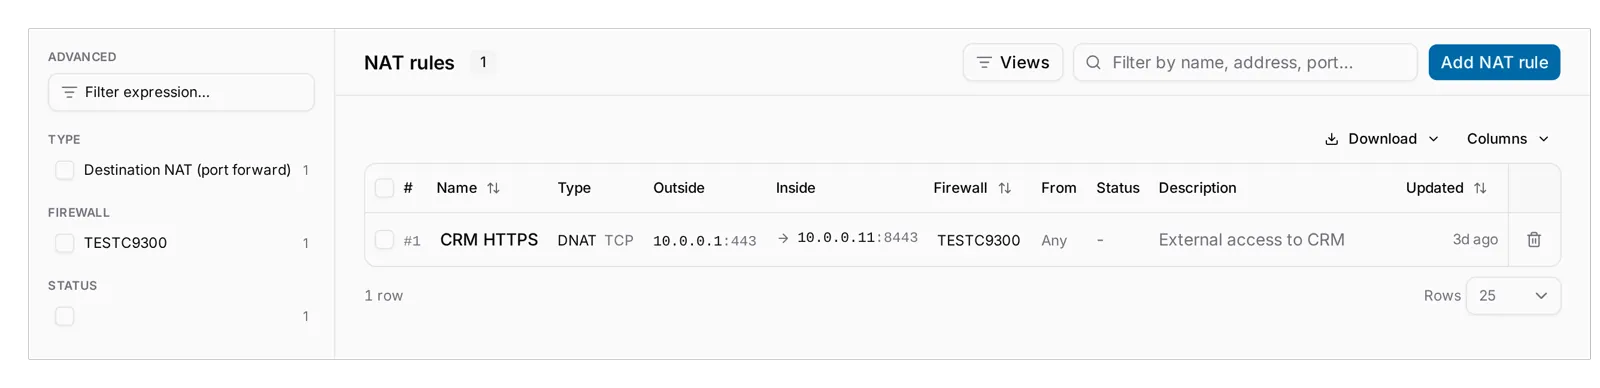 The NAT rules list: CRM HTTPS, DNAT TCP, 10.0.0.1:443 to 10.0.0.11:8443 on TESTC9300, from anyone.
A VLAN ID is now unique per site, or per VLAN group, not per tenant: Kyiv VLAN 105 and Warsaw VLAN 105 are different broadcast domains that share a number. A VID read off a switch or a hypervisor is resolved within the device's or cluster's site, most specific first, and the resolver refuses to guess between ambiguous candidates. SNMP then leaves the port's VLAN alone and shows it as drift; virt sync falls back to the VLAN in its own per-source group. A missing assignment is visible, a wrong one looks like the truth forever. Migration api.0161, closing #159.
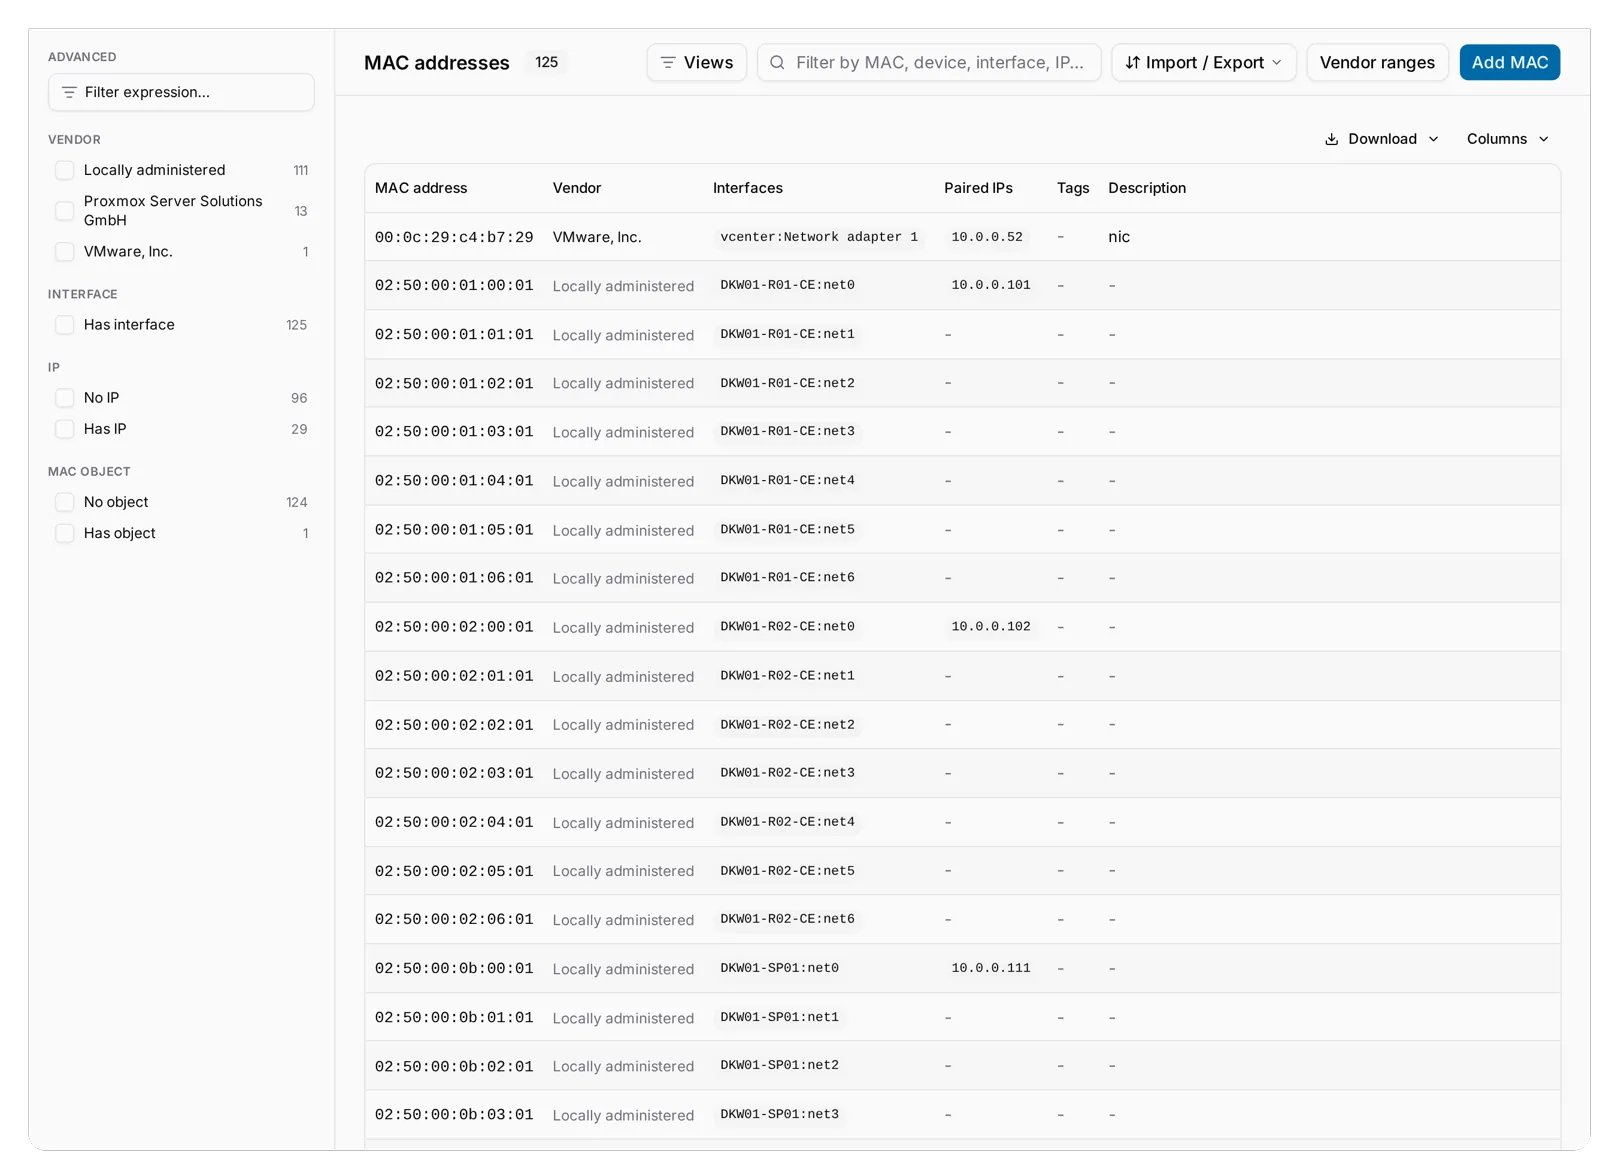 The MAC addresses list with the new Vendor column: 00:0c:29 resolves to VMware, and a locally administered block reads as such.
Every MAC shows its vendor, from an IEEE OUI registry you load as a CSV under Settings, Branding & identity (through the browser by default, so the server needs no internet), from your own vendor ranges with your label, or from a per-MAC override. The registry is not bundled; on a fresh install the column is empty until it is loaded. Vendor ranges are how a VM cluster's locally administered block gets a name, and Next free in range in the Add MAC dialog hands out the lowest unused address in one of them. Closes #141 and #142.
A virtual chassis is polled once through its master, the observation is split back per member for drift and sync, and the stack page gets an SNMP tab with Poll stack and Sync stack from SNMP. A stack polled per member produced duplicate ports and false drift; this fixes both (#148). Module-type interface templates take the [1-24] range shorthand device types already had, with {module} resolving to the bay position (#147). Foreign keys that were plain text are links across lists and detail pages, and catalog badges keep their colour and become the link.
On the topology map you can draw a labelled, coloured zone around a group of nodes and write "WAN circuits" or "customer side" on the map for the person who reads it. A zone is only an annotation; dragging it leaves every card where it was. The topology map also got the site map's On this map panel: devices grouped by role, site or location, links by family (cables, LLDP, BGP sessions), zones, each with an eye that hides it, a search box and a status filter. H hides the selection and Shift+H shows everything, on the site map, the floor plans and the topology map alike. Zones and hidden cards belong to the view they were drawn on and never leak to the global map.
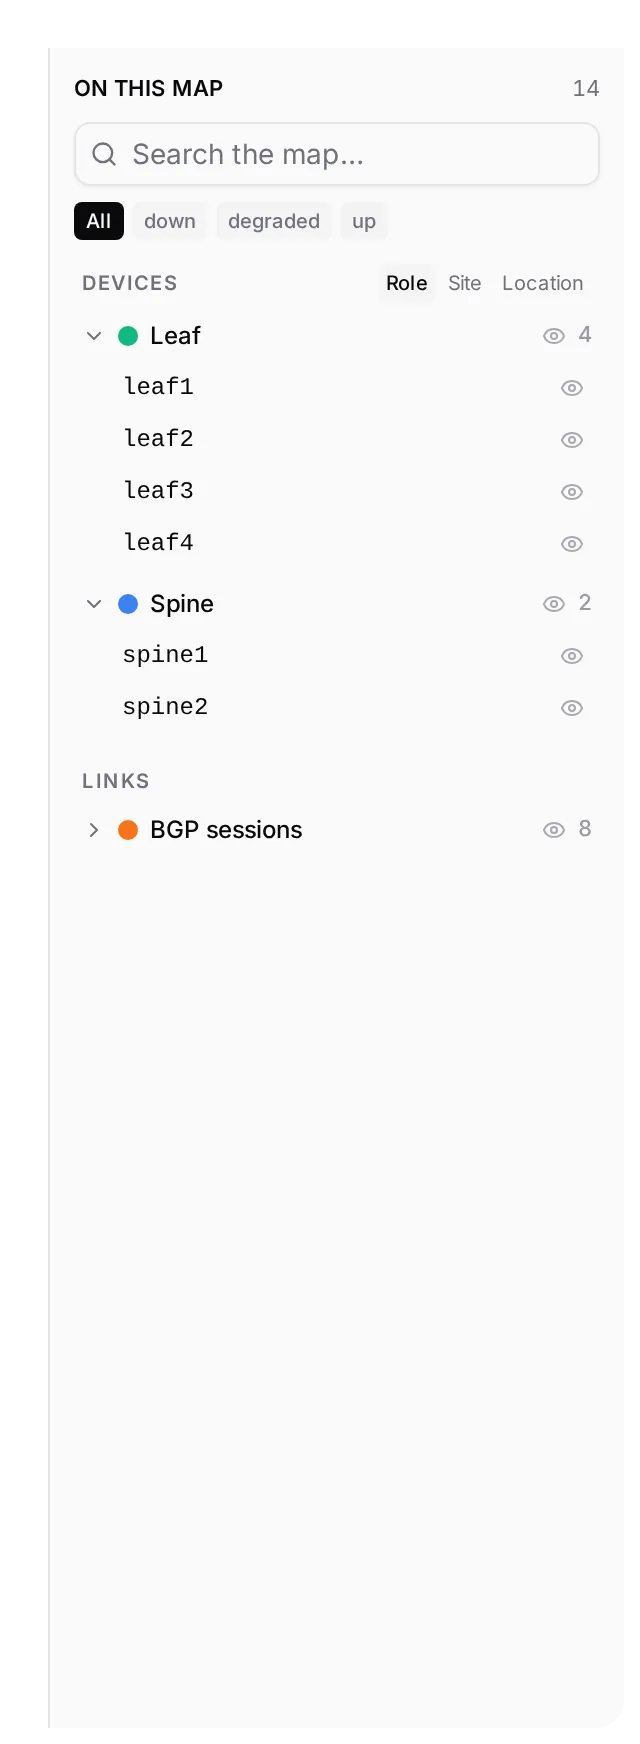
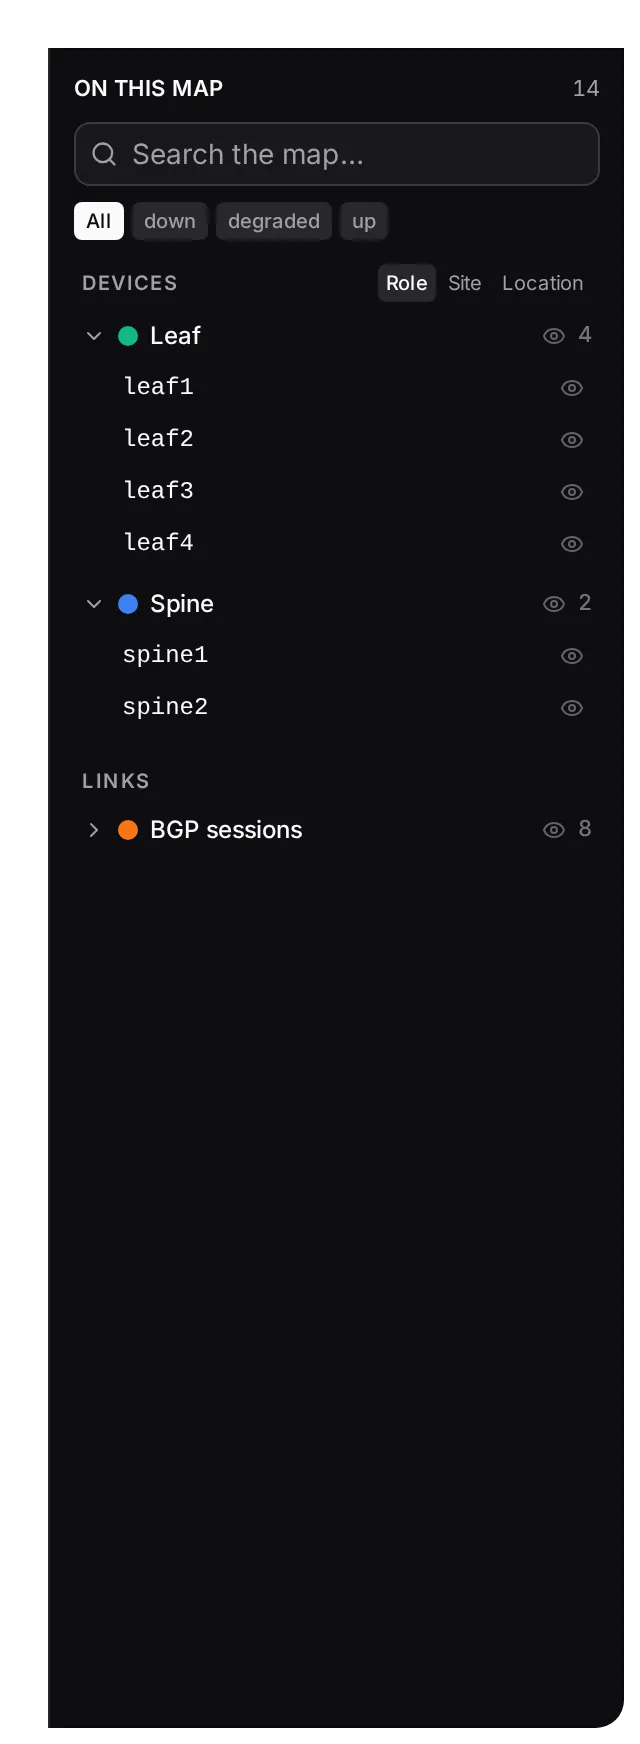 The On this map panel on the fabric: Leaf 4 and Spine 2 under Devices by role, BGP sessions 8 under Links, each with an eye.
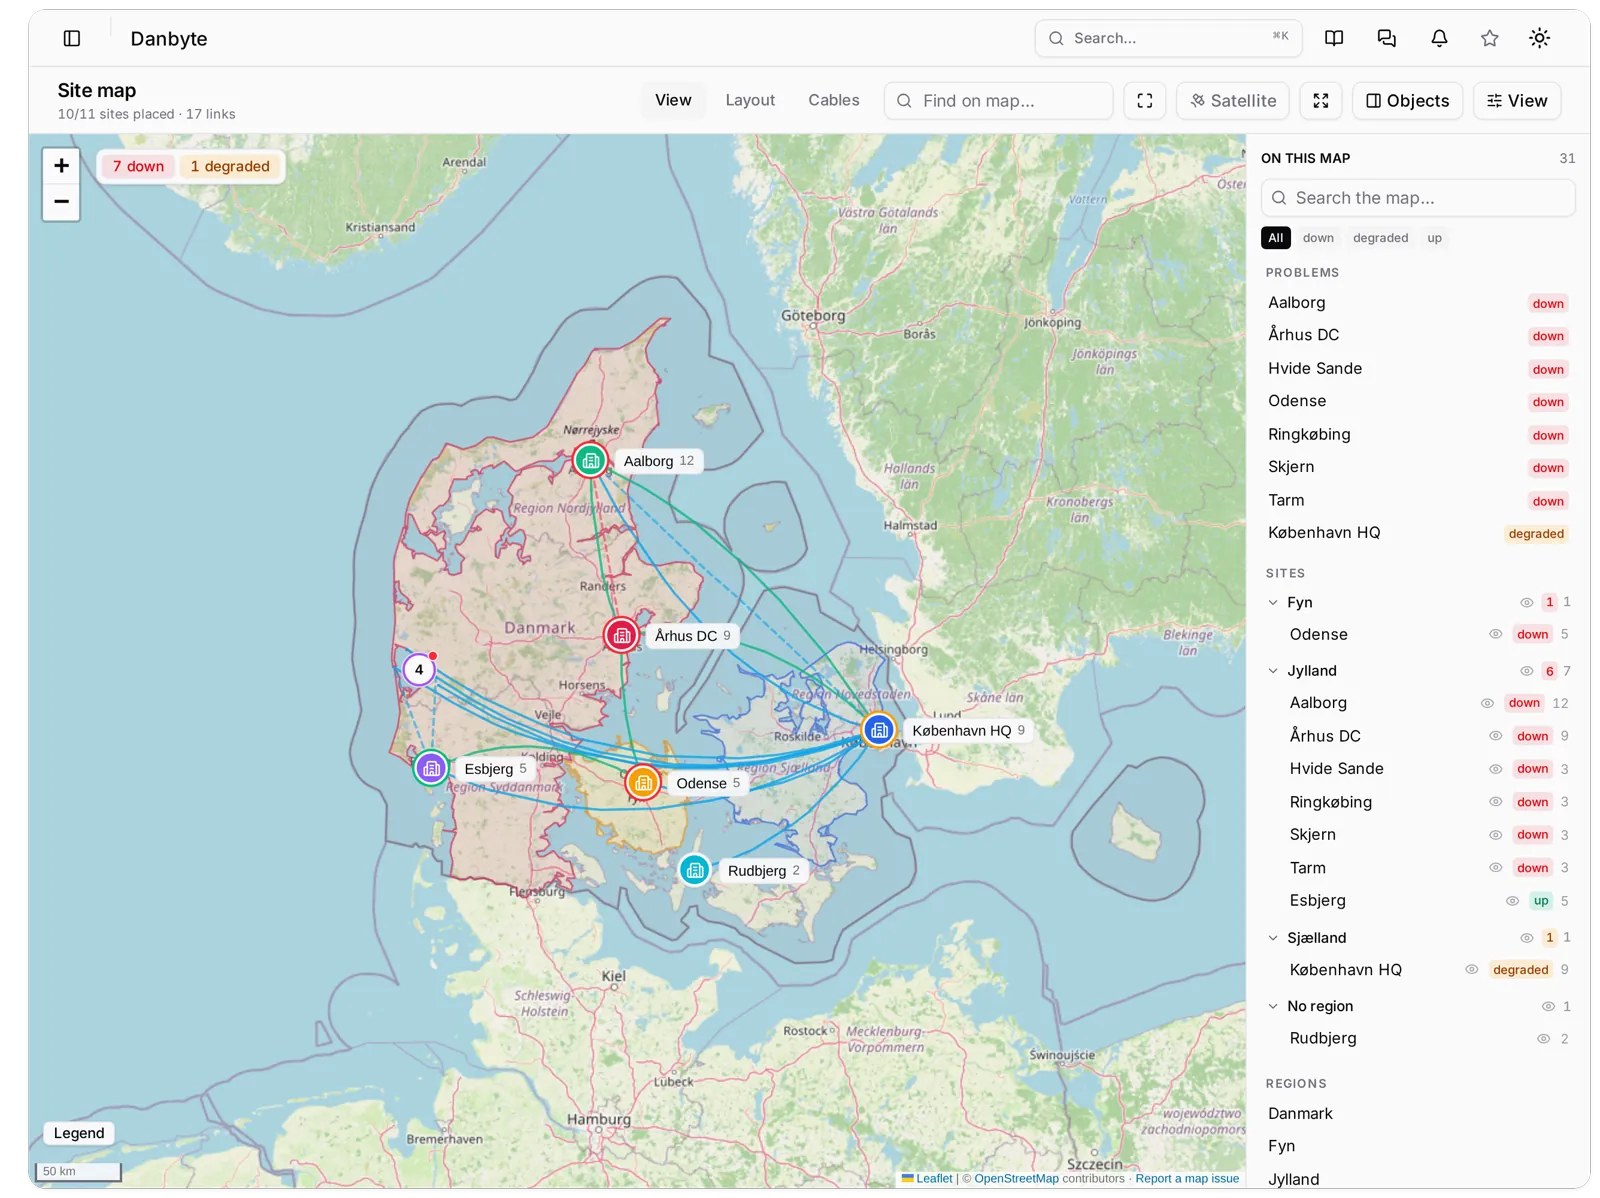 The site map with its On this map sidebar: sites grouped by region, each group header and site row with an eye to hide it.
The site map's sidebar can hide a device role, a region's sites or one site, and hiding a site takes its devices, cables, circuits and tunnels with it. Hidden objects stay listed, greyed, and drop out of Problems, Find on map and Fit-to-all. It is per browser and presentational; it deletes nothing and affects nobody else.
Hypervisor sync got three per-source switches that answer three separate questions: what to copy (Sync interface MTU, Proxmox only, on by default), what to skip (Skip powered-off VMs), and what to remove (Delete VMs removed from the hypervisor, off by default, with a grace period in days; in review mode the removal is proposed, never applied). One API error or a paused vCenter is not enough to delete a VM record and everything hanging off it. Closes #160.
Issuance keys and device credentials can live in an Azure Key Vault, with Danbyte holding only a reference, alongside the existing HashiCorp Vault / OpenBao option. It is three REST calls and a token, no Azure SDK, and the token audience is derived from the vault's own host, so sovereign clouds work by URL alone. Where the organisation's private keys live is a deployment decision, so the setting is not per tenant (#58). An LDAP group mapping can grant superuser, grant-only and logged, never silently removed when a group goes missing. An API token can be created read-only, so every write through it is refused whatever the owning user may do, the right choice for anything that stores the token in a plain-text config file, and what Agent access asks for.
Telegram is a notification channel: a bot token, a chat ID and an optional topic. Microsoft Teams channels send an Adaptive Card instead of the Slack-shaped payload Teams had stopped rendering reliably, with a View in Danbyte button when a public base URL is set. Backup schedules can use the same channels.
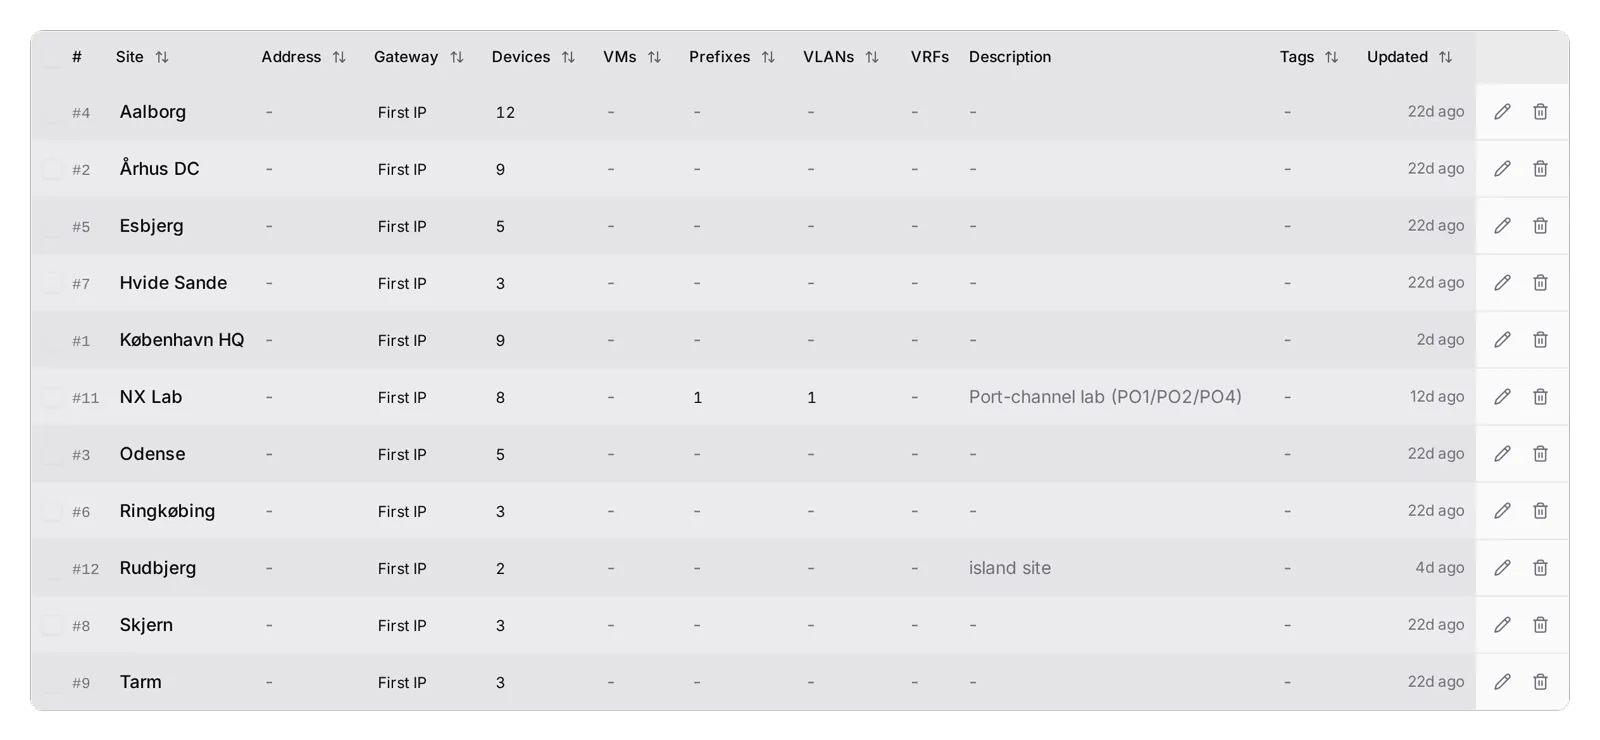 The Sites list counts devices and VMs alongside prefixes, VLANs and VRFs.
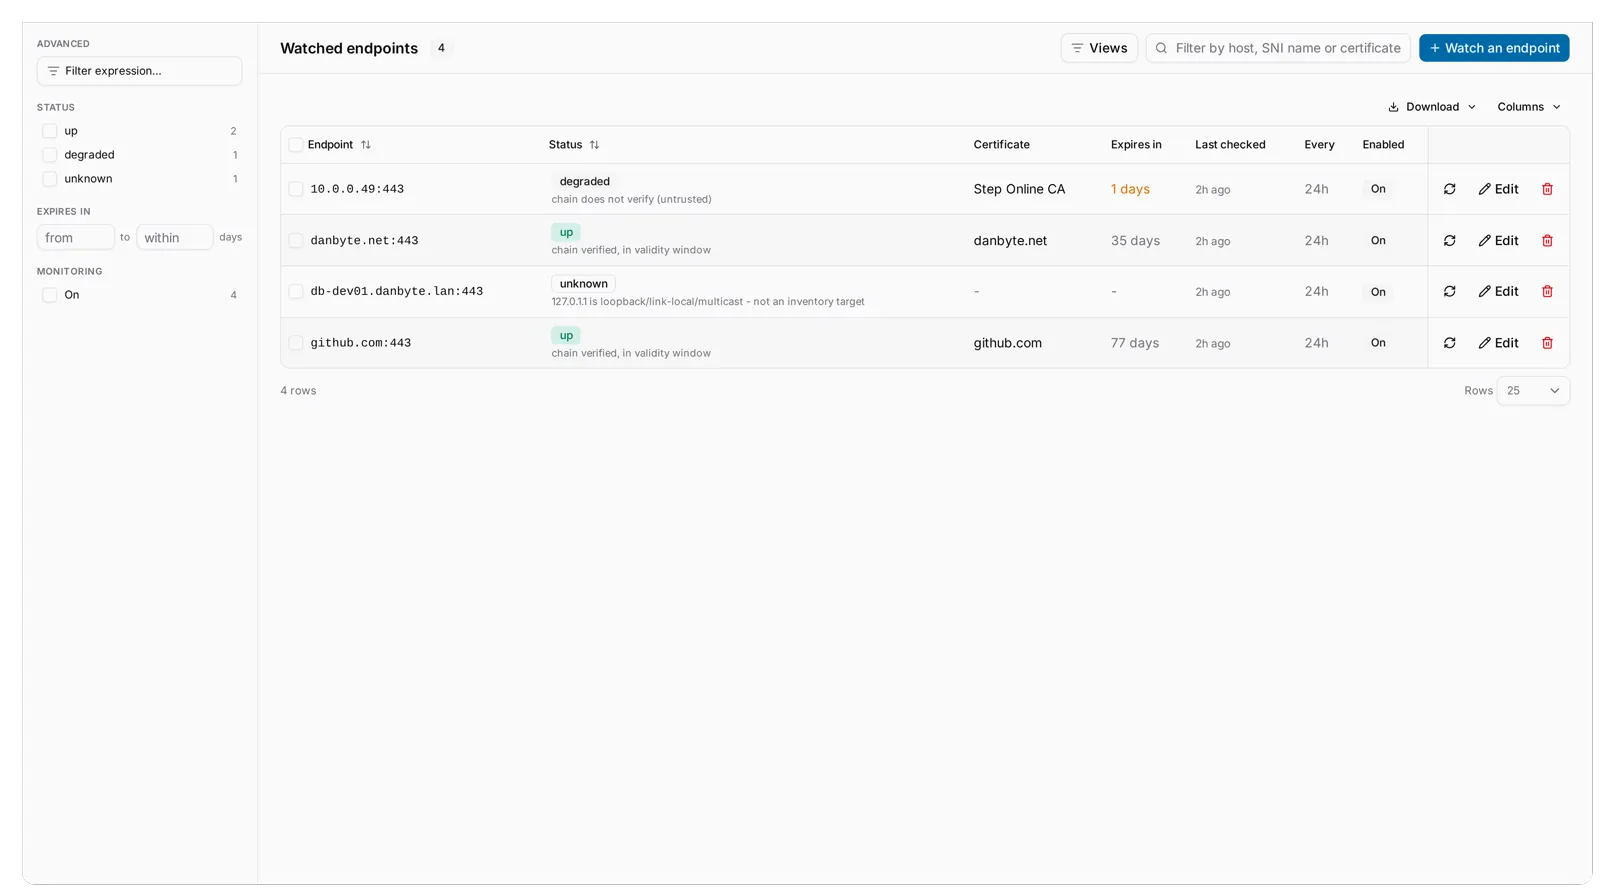
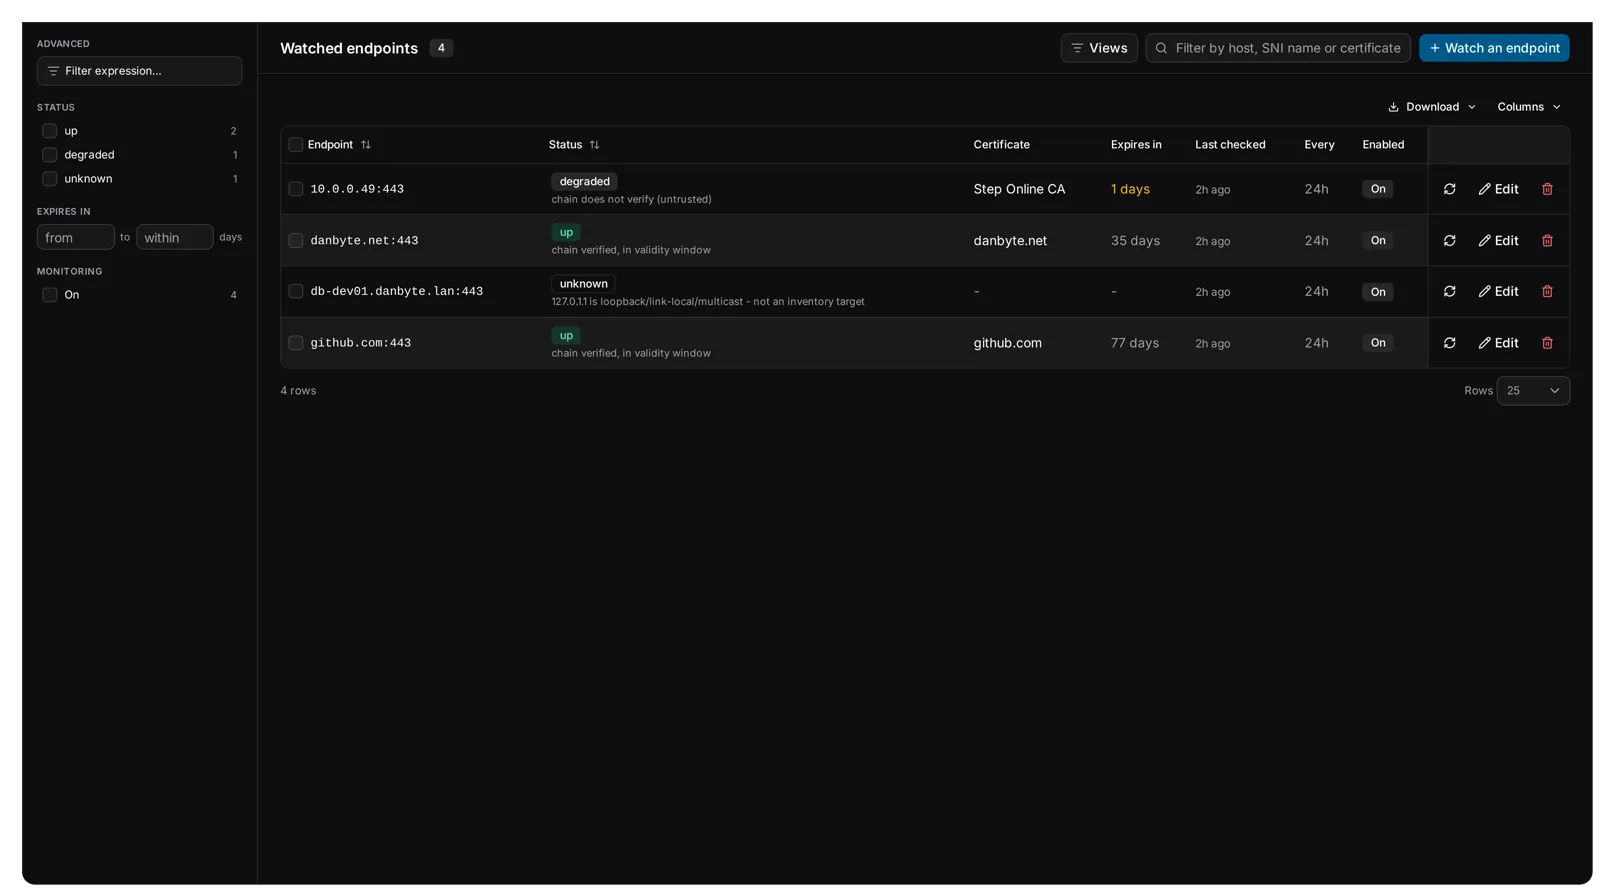 Watched endpoints with a filter rail: status, monitoring, and Expires in as a range of days, so expired certificates are in the answer rather than hidden in a band (#161).
The IP addresses list has the checkbox column and the bar the prefixes list has had: tick rows or select all, then Check now, Edit, Export or Delete the selection at once. Bulk edit sets one field across the rows; delete asks once with the count (#170).
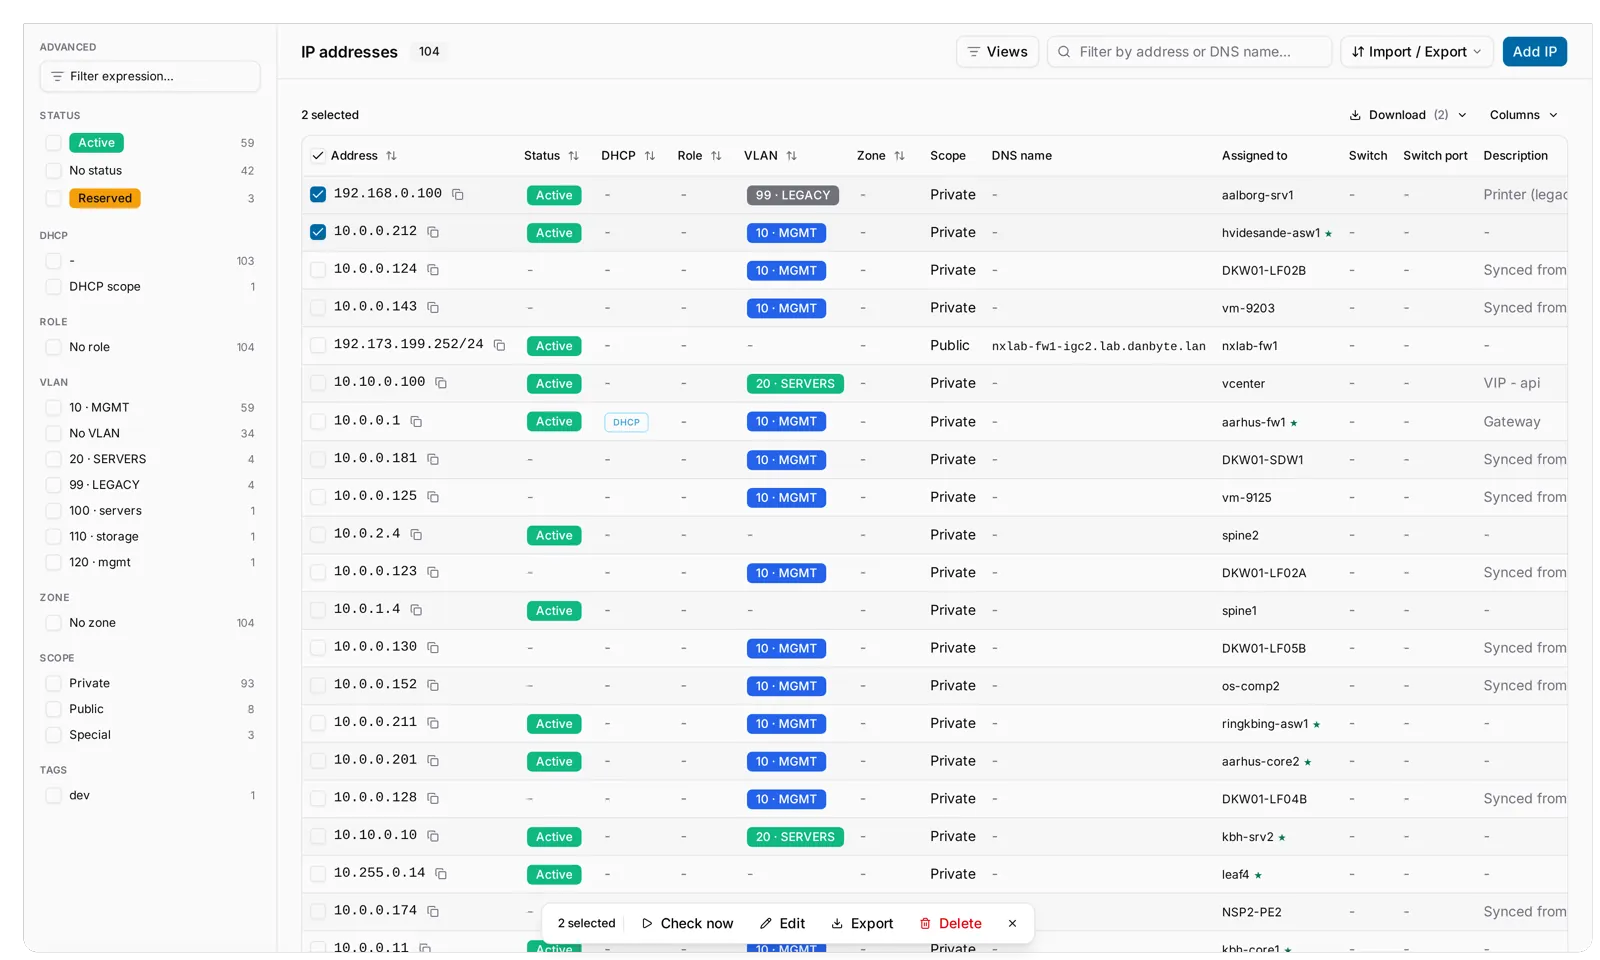 Two addresses ticked on the IP addresses list, and the bar at the bottom: 2 selected, Check now, Edit, Export, Delete.
Every email Danbyte sends was restyled as a document: one ink and one red, the status as a bold word in a box, the install's login logo in the header, a plain Open in Danbyte button, and a footer that says why you got it. Settings, Email renders every template with sample data next to the send-me-a-sample buttons. And a flapping check is mailed once per episode. Instant status-change channels send at most once a minute and bundle what arrived inside the window; a flagged check gets one Flapping notice, then nothing until it settles or someone confirms it, when the all-clear follows.
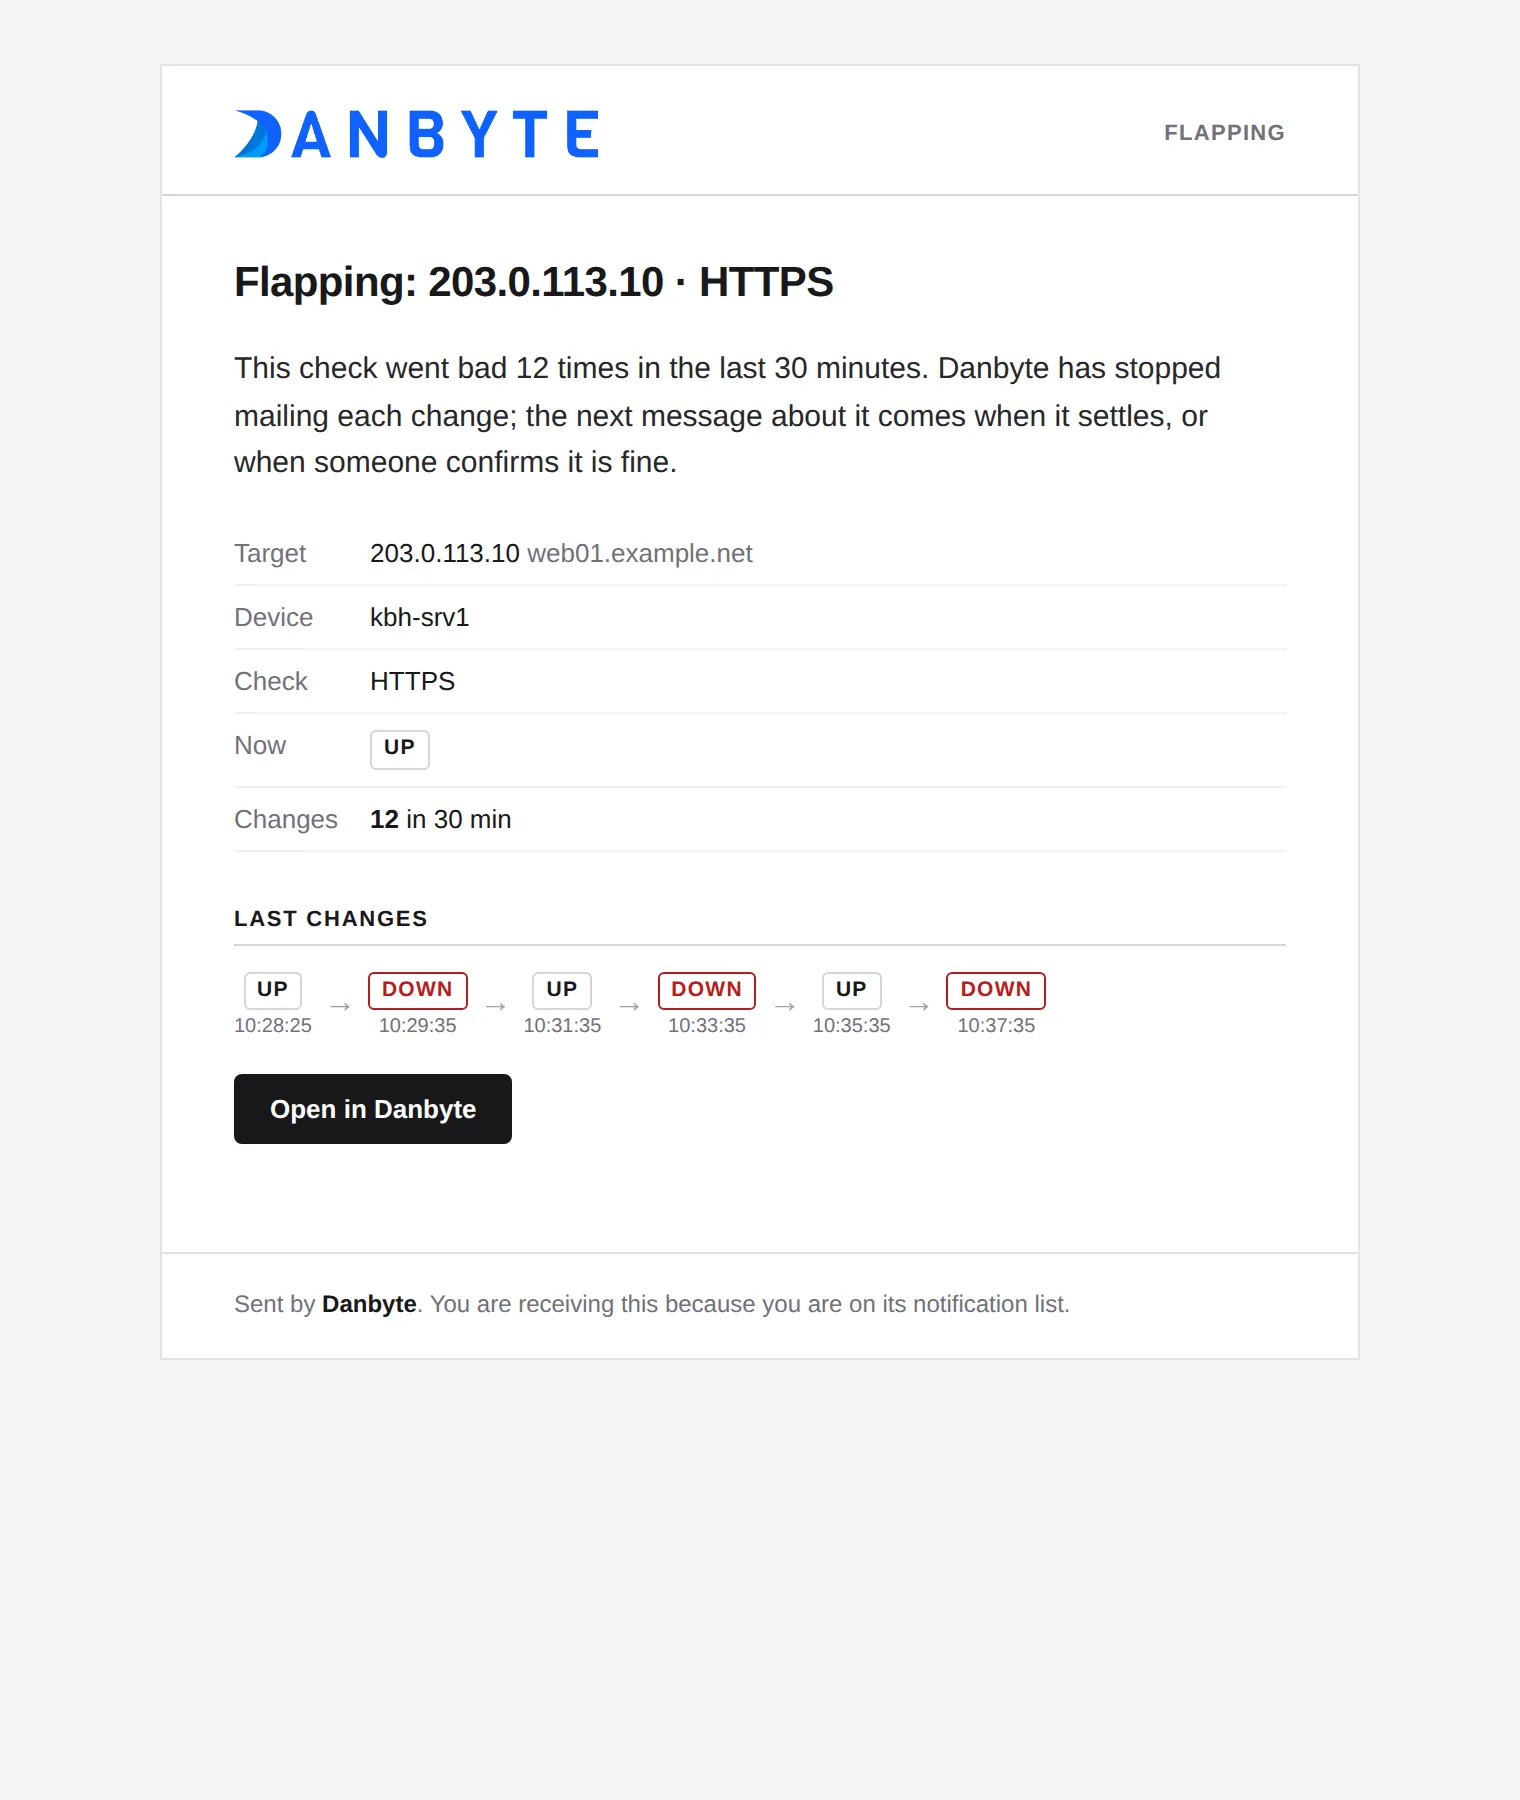 The Flapping notice: the target, device and check, 12 changes in 30 minutes, the last changes as a strip, and Open in Danbyte. The addresses are the template preview's sample data.
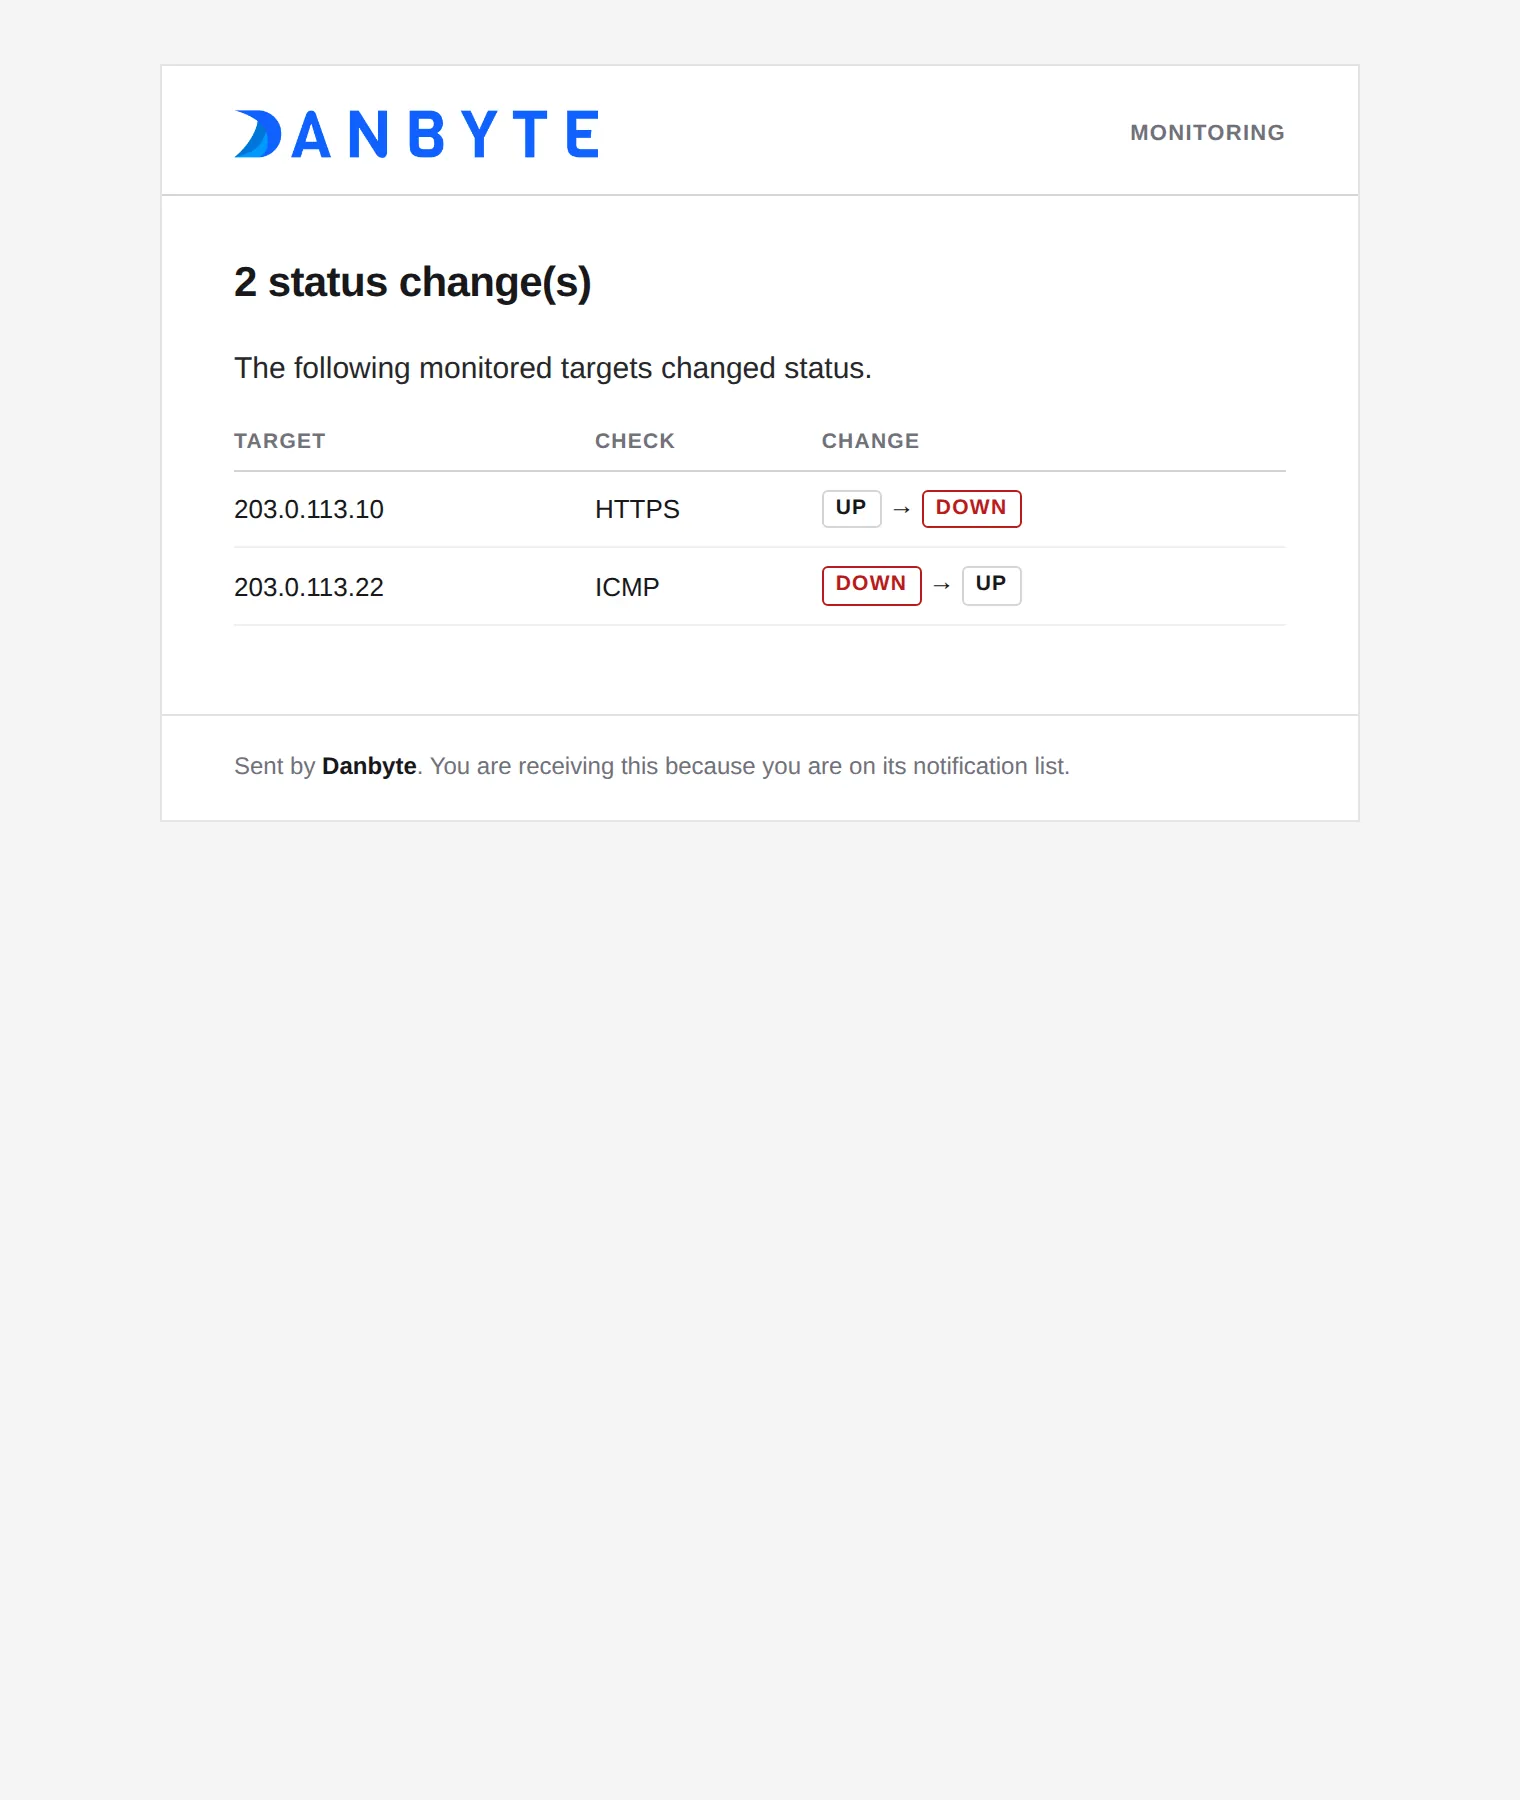 A bundled status-change mail: two changes in one message, each state as a bold boxed word.
An IPsec profile's pre-shared key now lives in the secret store, like an SSID's key since 0.15: written in, never read back through the API, revealed only through an audited Reveal with its own permission, and refused when no secret store is configured. Existing profiles keep working; a stored key is migrated in place (api.0164, #168).
An interface's addresses are separated by a divider, 10.0.0.1 | 10.0.0.2, wrapping so table rows stay level (#149).
Two more explain the screenshots above. A status can now speak for a check state: tick it on the status form, pick Up, Degraded, Down, Unknown, Stale or Skipped, and that status's name and colour replace the shipped ones everywhere monitoring is shown, the badges, the roll-ups, the rail, the charts and the Zabbix severity picker. The lab tenant in these pictures calls Down "Critical", which is why every red pill reads Critical. The stored value stays the state, so webhooks, the digest and the API keep sending down and a script written against it keeps working (api.0163). And a check kind registered by an integration or a plugin is selectable in Add check, the template editor, alert rules and silences, because the list now comes from the checker registry. The Zabbix check is the built-in example; the plumbing is open to any plugin.
On the host
Until now the two things an operator most often had to do on the Danbyte box itself, put a real certificate in front of nginx and see why a service or timer was misbehaving, meant a root shell, a hand-edited nginx config and journalctl. Both move closer to the operator in 0.16.0 without loosening the host.
The site's own certificate
Settings, Updates, Site certificate shows the certificate :443 is serving right now, its names, validity, key and fingerprint, and offers three ways to replace it: a Let's Encrypt or any ACME issuer's certificate in one click, a regenerated self-signed pair valid 825 days, or a pair you upload. Let's Encrypt over HTTP-01 is answered by Danbyte itself; DNS-01 goes through an issuer with a DNS publisher. The private key lives in the secret store between renewals, so a secret store has to be on, and the Order button says so until it is. From then on the same four-hourly renew timer that handles every other ACME certificate in the inventory re-orders it at two-thirds of its lifetime, and Renew self-signed automatically does the same for the box everybody forgets. Watch for expiry adds the site to the tenant's watched endpoints. This is the systemd path; container installs are not covered.
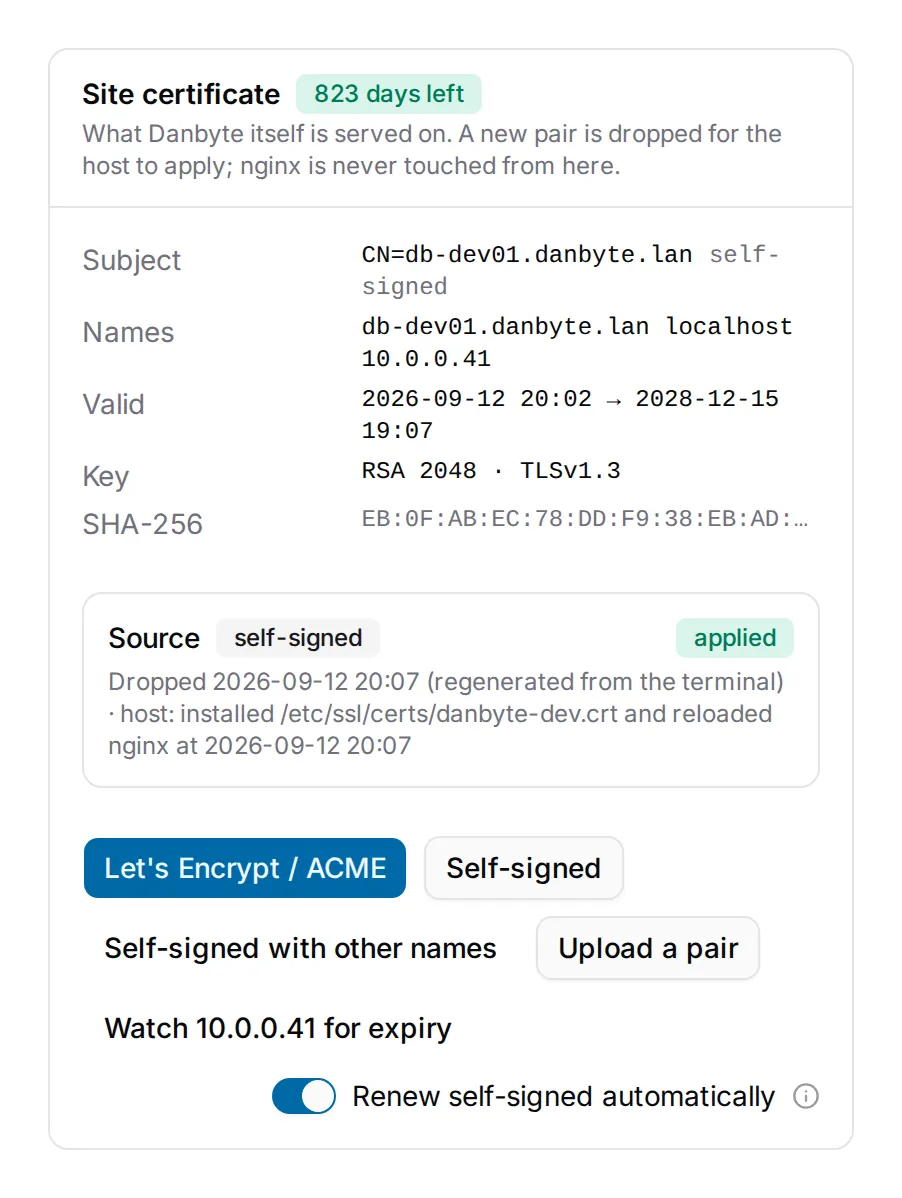
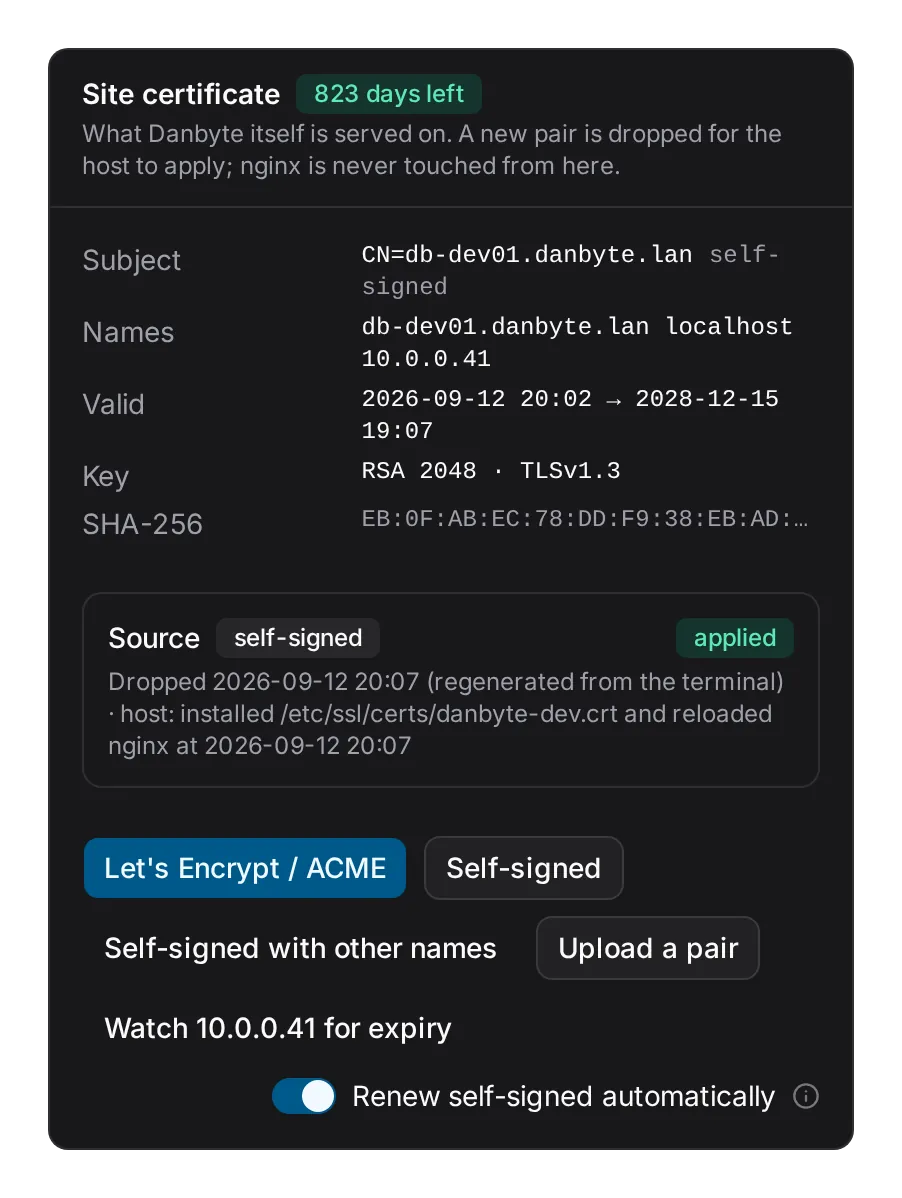 The Site certificate card: what port 443 serves, 823 days left, the Source box reading self-signed and applied with what the host did, and the four actions.
The application never edits nginx and never runs as root. It writes the new pair into a folder it owns and drops a stamp file; a root-owned danbyte-tls.path unit sees the stamp, verifies the pair, keeps the live pair aside, installs onto the paths the live nginx config already names, runs nginx -t and reloads, or puts the old pair back if nginx refuses. The card reports what the host did with the last drop: applied, apply failed, applied an older pair, or apply unit not installed, so a reload that did not take is visible on the page rather than discovered by a browser warning. The installer sets the unit up on a fresh install; an upgraded host runs sudo make install-tls-unit once.
flowchart LR
  A[Settings → Updates → Site certificate, or console tls tab] --> B[App writes the pair to deploy/nginx/certs/ then the stamp danbyte.apply]
  B --> C[Root danbyte-tls.path sees the stamp]
  C --> D[danbyte-tls.service runs danbyte-tls-apply.sh]
  D --> E{Key matches and in date?}
  E -- no --> F[danbyte.applied: failed]
  E -- yes --> G[Keep the live pair aside, install onto nginx's paths]
  G --> H{nginx -t}
  H -- refused --> I[Old pair put back, danbyte.applied: failed]
  H -- ok --> J[Reload nginx]
  J --> K[:443 serves the new pair, danbyte.applied: applied]
The danbyte console
New in this release: run danbyte on the host's terminal and you get a full-screen console for the box. One overview shows every unit and timer with its state, memory, CPU, uptime and each timer's last result, the host and Danbyte facts beside them (queue depths, workers, the fast lane's probes per second, the upgrade lock, the last backup, the certificate's days left), and the journal underneath. All of it is read from systemd, /proc, Redis and the health endpoint directly, so the screen stays right when Django is down, which is usually why you opened it. There is no daemon behind it: it is standard-library Python inside the admin script, with nothing new to install.
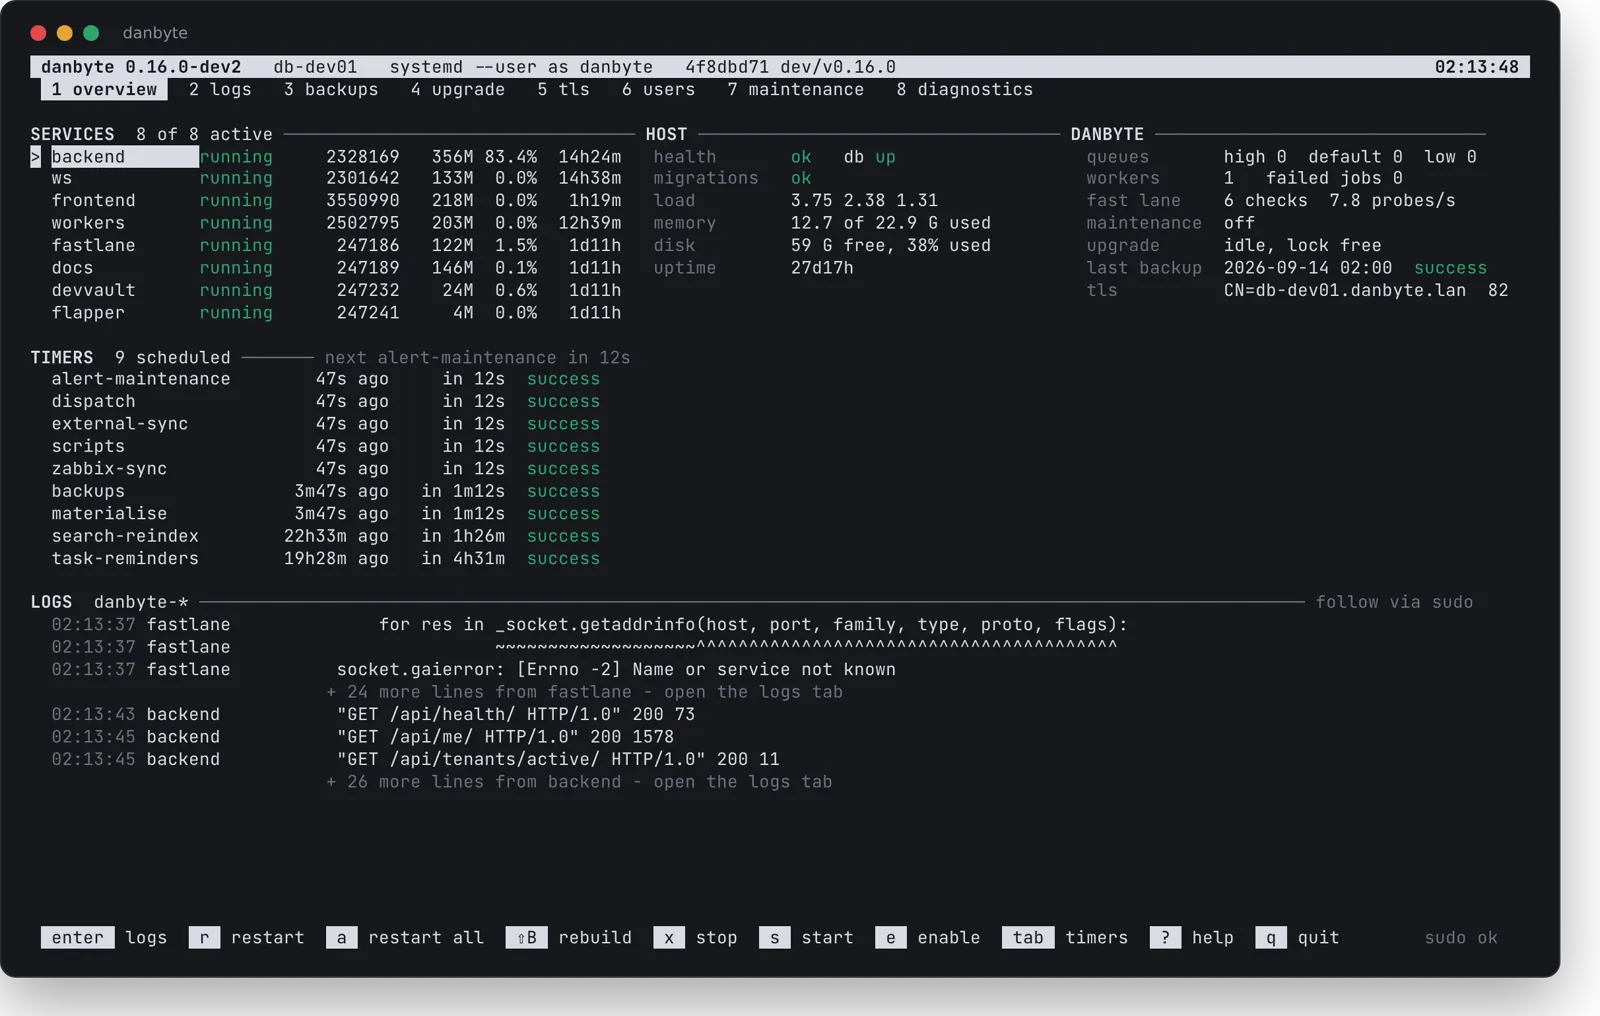 The console's overview: services and timers on the left with their last results, host and Danbyte facts on the right, the journal underneath and the key bar along the bottom.
Eight tabs: overview, logs, backups, upgrade, tls, users, maintenance, diagnostics. The upgrade tab launches the same danbyte-upgrade.service the web UI uses, so a dropped ssh session cannot kill it half-way and an upgrade started in a browser can be followed from a terminal. Root is asked for per action through sudo, never up front. Actions that take the site down or replace data ask you to type the name of the thing; the rest ask y/n. Colour is only on the word carrying a state, so a screen with no colour on it has nothing wrong. It needs a real terminal of at least 80x24. Everything the console does is also a plain subcommand (danbyte upgrade online, danbyte tls install, danbyte backup, and so on), so a script or a playbook never has to open it.
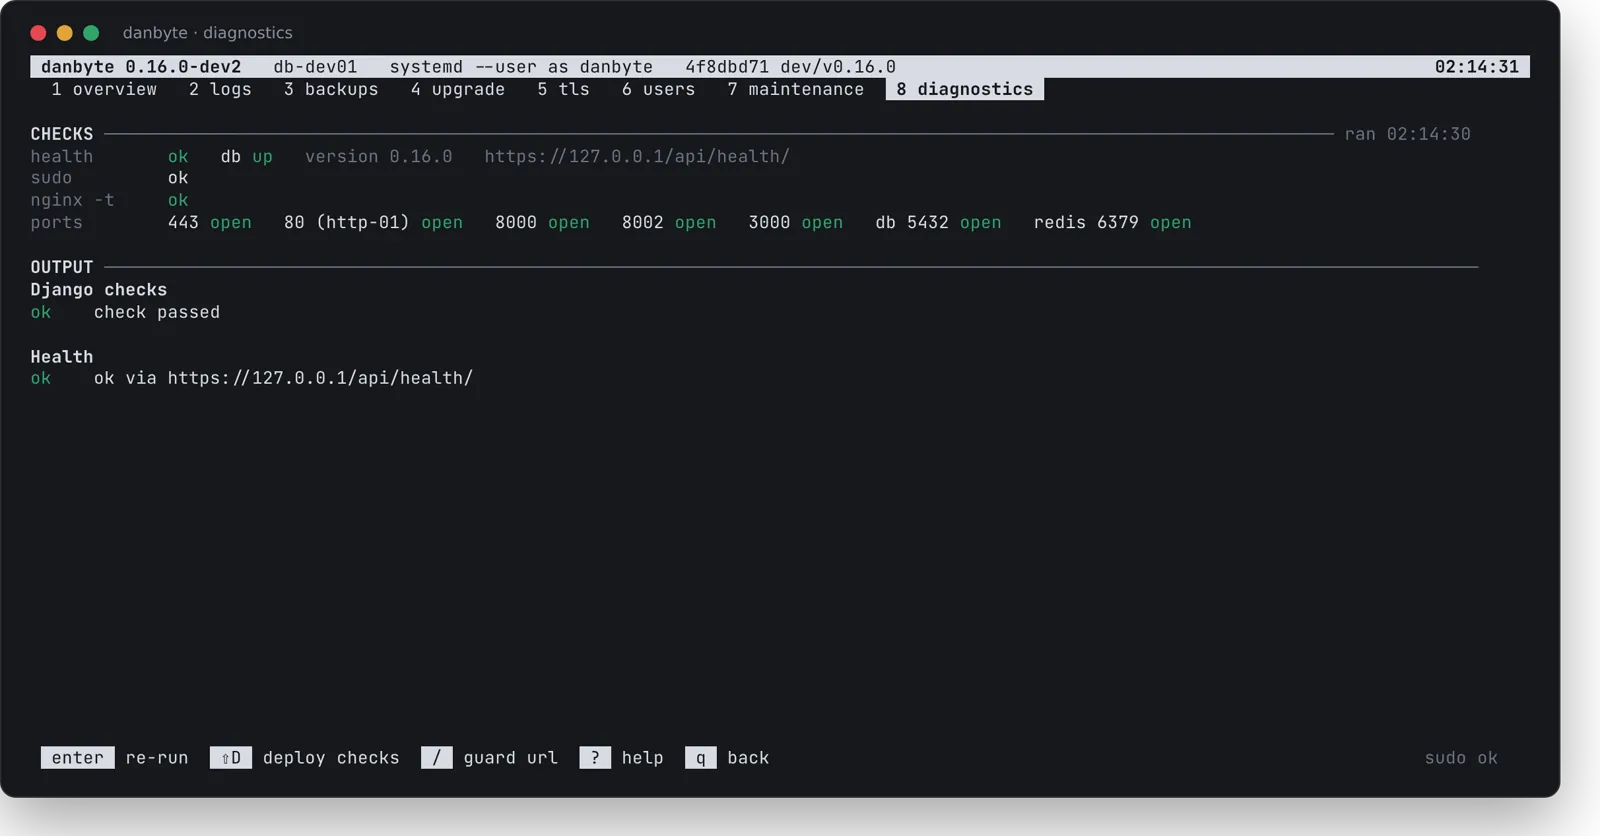 Diagnostics: health, database, nginx -t, and every port probed. 80 is optional; only HTTP-01 needs it.
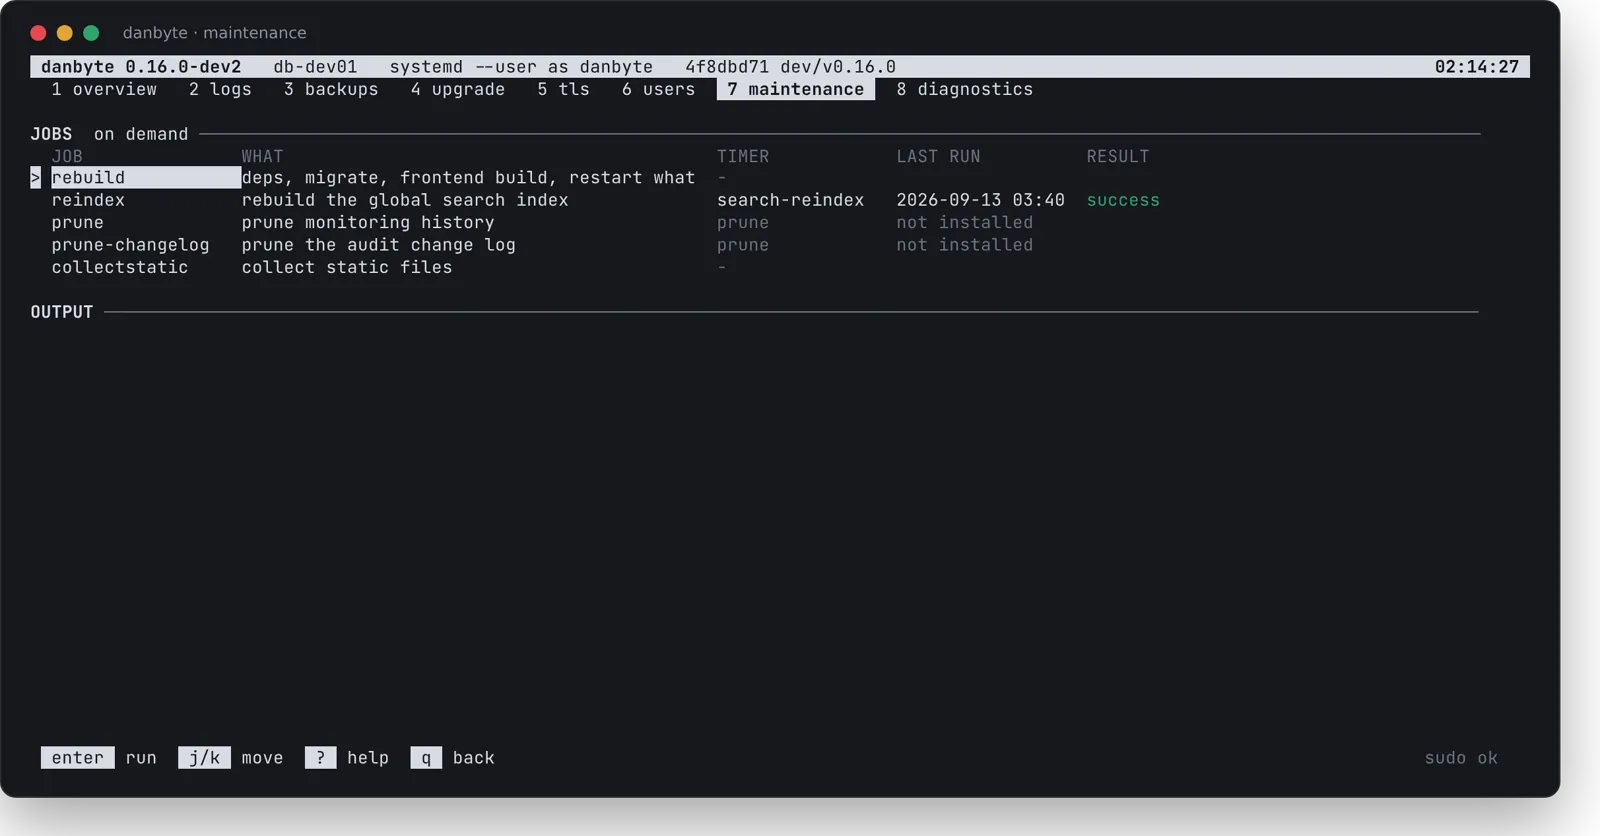 Maintenance: rebuild listed first, then the scheduled jobs with their timers and last results.
Two more commands. danbyte rebuild runs the upgrader's build steps on the code already on disk, after a git pull, a hand edit or a bundle unpacked by hand: dependencies, migrate, frontend build, collectstatic where gunicorn runs, and a restart of what is running, stopping at the first failing step. It fetches nothing and takes no backup; it is the missing middle between "upgrade to a tag" and "restart". danbyte tls install takes a certificate in whatever shape a CA handed it over, a certificate and key with a separate chain, a Let's Encrypt live/ directory, or one PEM holding chain and key, tells the files apart by content, checks the key against the certificate (EC and RSA both), installs where the live nginx config reads from, tests, reloads, and reads :443 back to prove the reload took. In the console it shows the live certificate beside the new one and every check, including a server_name the new certificate does not cover, before asking for the common name typed out.
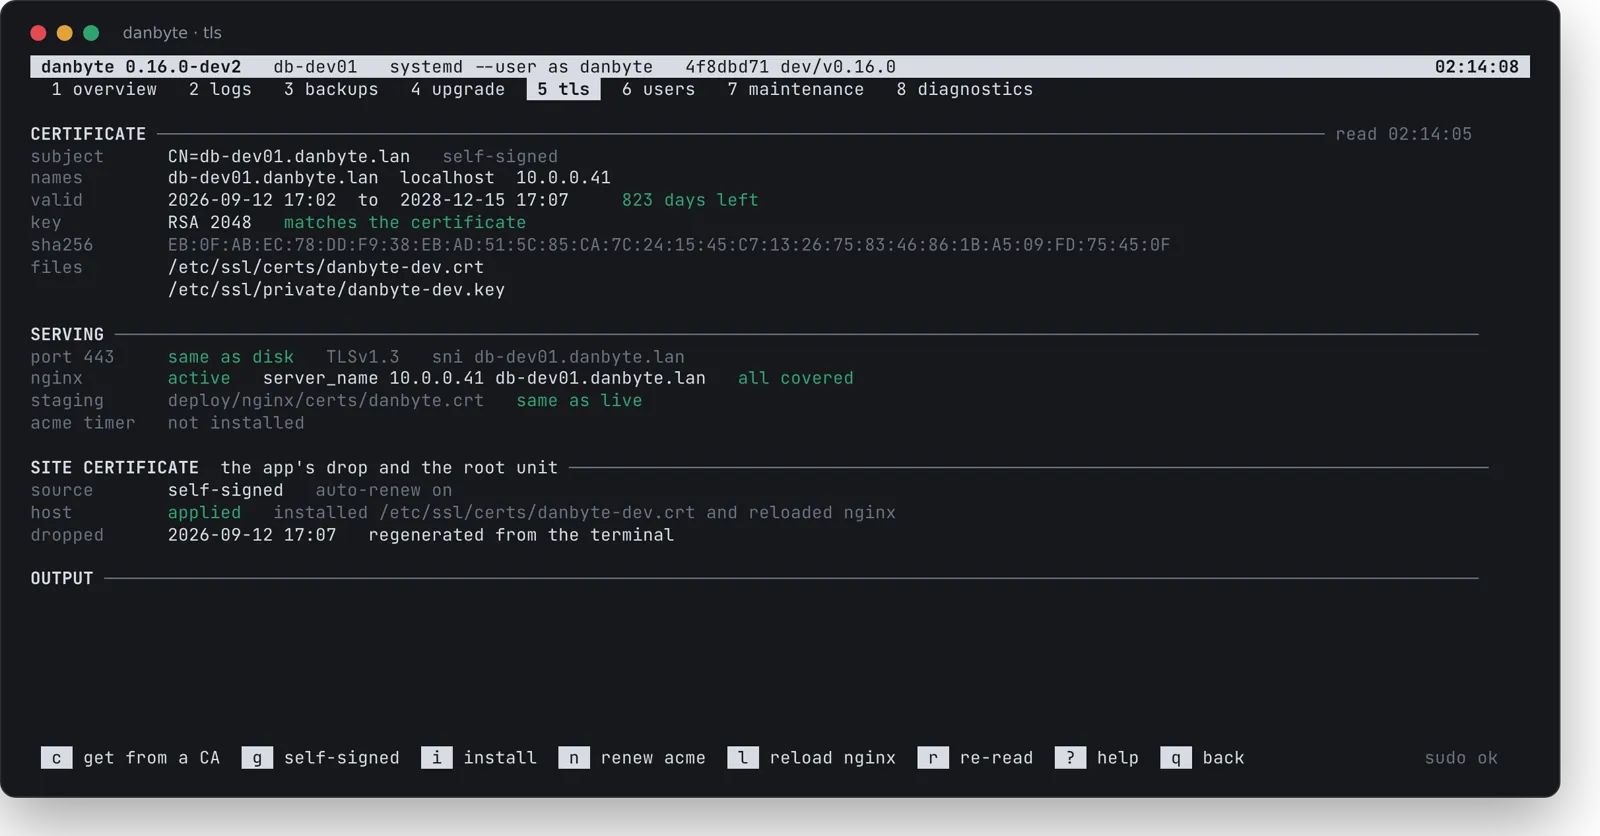 The tls tab: the certificate on disk, what port 443 serves, both server names covered, and the site-certificate source and apply result.
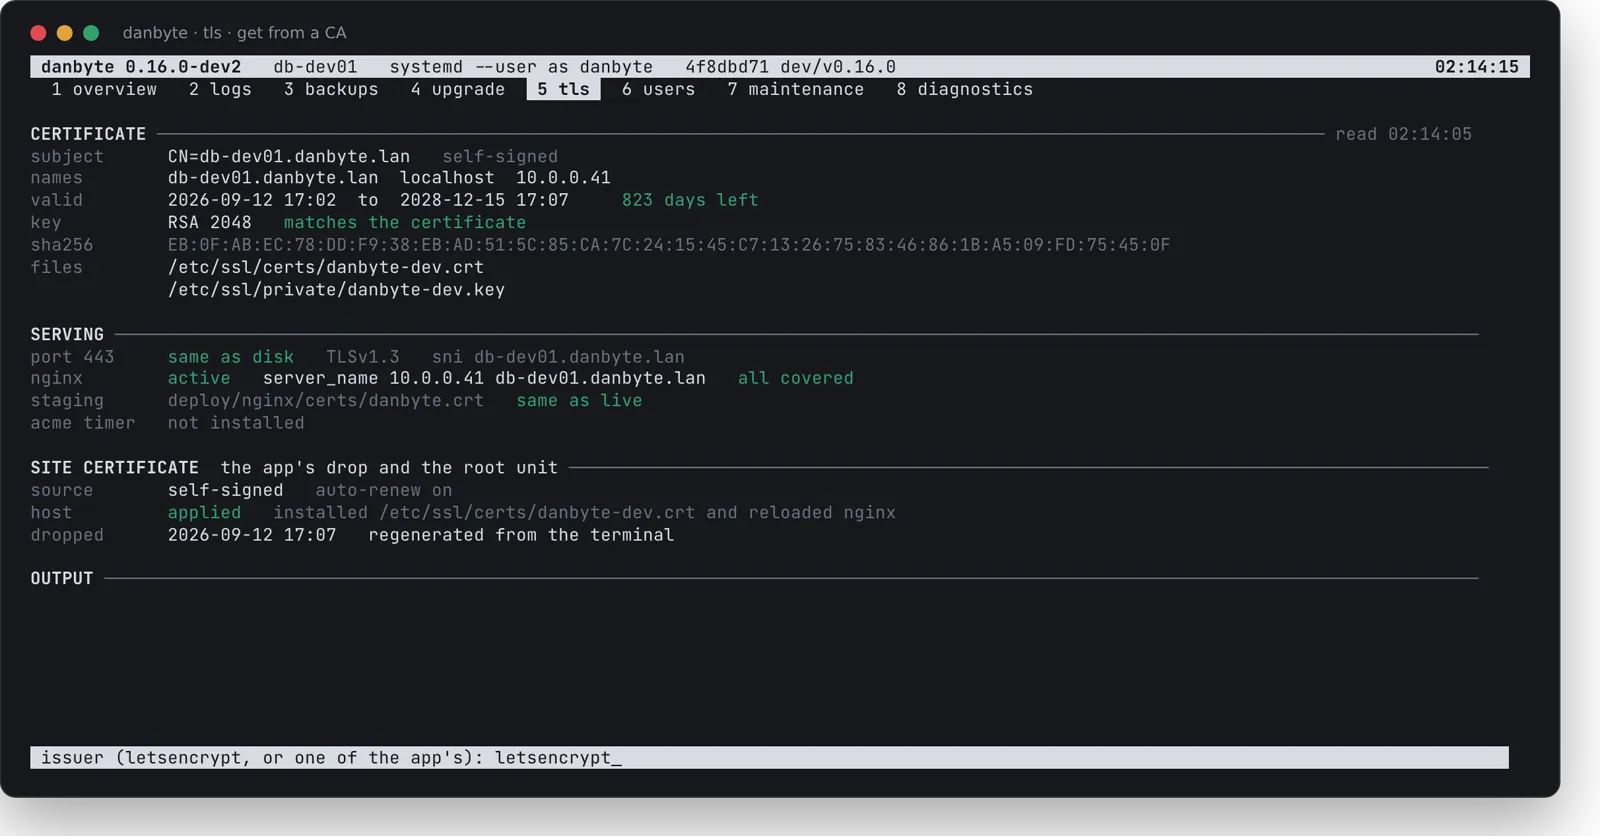 After pressing c: the first prompt of an order from Let's Encrypt or one of the app's issuers.
# After a git pull or a bundle unpacked by hand: the upgrader's build
# steps on the code already there
danbyte rebuild

# A certificate however the CA handed it over
danbyte tls install --cert new.crt --key new.key --chain ca-bundle.crt
danbyte tls install /etc/letsencrypt/live/danbyte.example.com/
danbyte tls install danbyte.pem
The admin script also learned three things an operator will meet. danbyte users clear-mfa <name> removes an authenticator enrolment and clears the lockout for someone who has lost their device, without needing a second administrator in the web UI. danbyte upgrade online with no --tag picks the newest final release, never an -rc over a final the way git's own tag ordering would, and stops if that is the version already running. And --skip-backup says so when it skips the pre-upgrade backup.
Fixes
A Zabbix engine was reported unreachable while every one of its checks was answering on time. Only an Outpost's phone-home marked an engine as seen, and the judgement used an Outpost's poll interval. An engine is now seen each time it reaches Zabbix, and not when it cannot, and judged by its own checks' cadence. In the same area, the Zabbix toggle on Settings, Integrations saved nothing, because the serializer listed its fields by hand and left it out; every integration toggle is now derived from the registry, with a test that holds the two together. And the container's in-process scheduler never ran the Zabbix sync beat, since the timer shipped without its row in the schedule table. It runs every minute now, like the systemd timer.
A region's colour, or any other field, could come back as it was after an edit: the save went through, but the edit form kept a cached copy of the object for up to thirty seconds, and saving from there wrote the old values back. A save now refreshes every cached query for that object, for every form (#169). Notify me on a device page sent an empty scope and was refused; it names the device now. An Outpost's writes to audited models raised in the audit signal and were lost; an Outpost is recorded by name with no linked user. A masked address matched no prefix policy and no inherited assignment. Cable ends carry their site, so a hidden site's undrawn cables disappear with it. The status donut on the Monitoring page wrapped its legend as three-and-one; it is balanced in pairs now.
Upgrading
The upgrade is the usual one-click or danbyte upgrade online, and it now takes a Before upgrade backup through the backup engine first and stops if that fails. Migrations apply automatically: the search index and extensions (api.0157 to 0160), VLAN scoping (api.0161), NAT rules (api.0162), monitoring statuses (api.0163), IPsec keys in the secret store (api.0164), the L3VNI link and VNI uniqueness (api.0165), read-only tokens and LDAP superuser grants (auth_api.0022, 0023), the secret-store registry, post-upgrade notices, AI and Azure settings (core.0048 to 0051), integration toggles and virt-sync options (integrations.0038 to 0042), Telegram, driver engine kinds, device engine bindings, policy scopes and filters and the check-state detail (monitoring.0082 to 0089), and the new agents, assistant, backups, routing (0001 to 0009), scripting and zabbix apps. PostgreSQL's pg_trgm and unaccent are created by migration; they are trusted extensions on PostgreSQL 13 and later, so the danbyte role needs no superuser. On an older server run CREATE EXTENSION IF NOT EXISTS pg_trgm; and CREATE EXTENSION IF NOT EXISTS unaccent; once as a superuser before migrating.
New units
danbyte-fastlane, the sub-minute lane, and danbyte-materialise.timer, which rebuilds check state from assignments every five minutes, are new. The upgraders link and start them, and the installer sets them up on a fresh install; both show on Settings, Updates under Services with the other units. The container image carries postgresql-client-17 for backup and restore. Outposts want agent 0.8 for the fast lane; an older agent keeps working, its sub-minute checks simply run on the minute beat at their ordinary interval until it is upgraded.
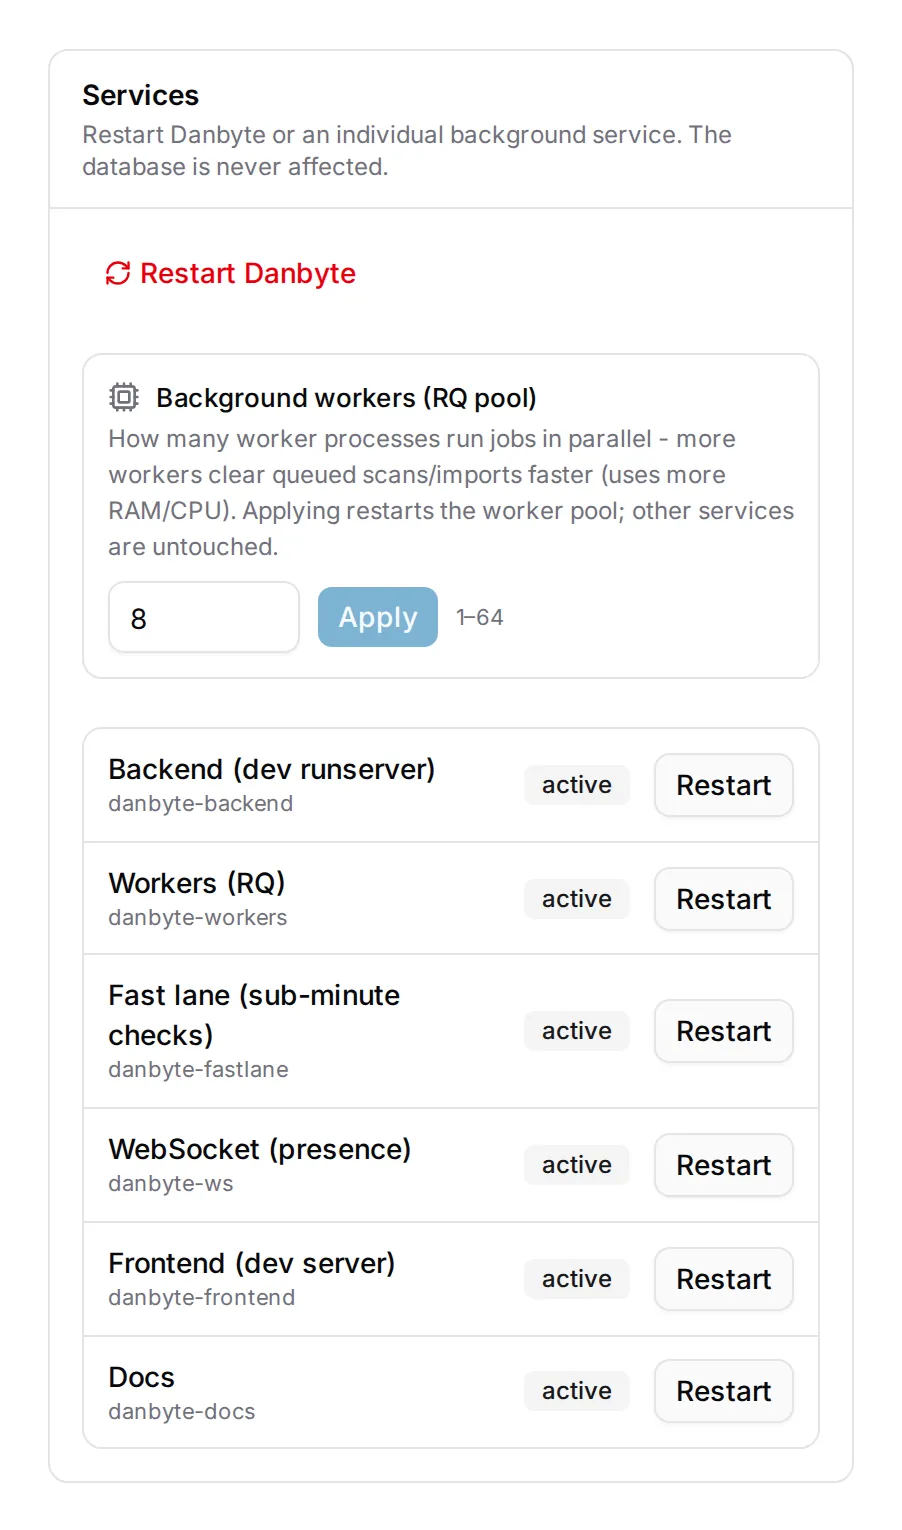 The Services card on Settings, Updates, with Fast lane (sub-minute checks) among the units. Shot on a development host; a production install lists danbyte-web and danbyte-frontend-prod.
Three host-side steps are new for systemd installs, and after the upgrade deployment admins see an amber After upgrade badge in the top bar and a card at the top of Settings, Updates listing them, each with its snippet, a docs link and a Done button. They stay listed until you say they are done. From a shell, manage.py upgrade_notes prints them and --ack all marks them done. A fresh install from the installer starts with nothing pending.
- Install the site-certificate apply unit:
sudo make install-tls-unit, once, on a host installed before 0.16.0. This step hides itself once the unit file exists. - Hand ACME challenges to Danbyte in nginx: the
/.well-known/acme-challenge/location in the port 80 server, only if you want Let's Encrypt over HTTP-01 for the site's own certificate. Skip it otherwise. - Add the backup upload location to nginx:
/api/backups/withclient_max_body_size 8gand request buffering off, for hand-managed configs. The installer's templates already carry both locations.
One more thing to do by hand if it applies to you: a Zabbix server on an internal address must be added to the outbound allow-list under Settings, Security, Outbound connections (or DANBYTE_SSRF_ALLOWLIST) before Danbyte will reach it.