
SLAs, a new topology Diagram, racks and cabinets in 3D, MAC tracking, capacity on the maps, safer upgrades
Availability targets off the monitoring history, burn-rate alerts, a topology that exports to draw.io and PDF, live ports on racks, DIN rails, MACs per port.
0.16 started recording every status change. 0.17 measures availability targets off that record: an agreement says what you owe over a period, and the figure comes from the same history the History tab shows, with the error budget, the service credit and burn-rate alerts that fire in the first hours of a bad month rather than at the end of it.
The rest is the drawings. The topology map opens on a new Diagram and exports as a PNG, an SVG, a PDF with a title block or an editable draw.io file, so what you hand to a contractor is the thing you maintain. Racks draw their faceplates as hardware with every port in its speed tier and a live SNMP dot, in 2D and in 3D. Cabinets are new: an enclosure whose gear sits on DIN rails at millimetre offsets, which is how a control cabinet or a distribution board is built. Switch ports show what is behind them, the site map and floor plans colour by link speed and capacity, and an upgrade stops the services before it changes anything and puts everything back, database included, if a step fails.
Service level agreements
An agreement states the availability you promise over a period, the hours it covers and how each status counts. The figure comes from the status changes Danbyte already has: time-weighted, stored per period, recomputed every fifteen minutes and frozen seven days after the period ends. Because it is stored, a report for last month reads the same after the raw results have been pruned.
 Every agreement on one list: this period against the target, the error budget left, the credit owed and how much of the time was actually measured.
Governance → Monitoring → SLAs lists each agreement with who it is for, the target, the period, this period's figure, the state, the budget left, the credit owed, coverage, Last 12 (how many of the last twelve finished periods met the target) and the member count. A target runs over a calendar month, quarter or year in the agreement's own timezone, or a rolling 7, 30 or 90 days. Service hours and a holiday calendar take time out of the measurement altogether. Provided for is the tenant, some sites or locations, a contact, or just a name.
Periods are Open while danbyte-sla recomputes them every fifteen minutes, Closed for seven days after the period ends so an exclusion can still be added, then Frozen. Counting rules are revisioned, so a closed period keeps the rules it ran under. The states are On target, At risk (below the At risk below figure, or three quarters of the budget spent), Breached and No data; a badge takes a dashed outline when coverage is under 90 %.
That last part matters more than it sounds. Unmeasured time counts as neither up nor down: it lowers coverage. A 100 % measured over a third of the period is shown as exactly that, never as a clean pass.
flowchart LR
  H[Status changes - the monitoring history] --> R[Counting rules, service hours, holidays, exclusions]
  R --> U[Units: members and redundancy groups]
  U --> F[Figure per period: availability, coverage, budget, state]
  F --> P[Stored every 15 min, frozen 7 days after the period]
  P --> O[List, Overview, reports, alerts, SLA columns]
Making one
New agreement is three steps: the agreement itself (name, who it is for, target, period), its members, then the checks that count, pre-ticked with the checks the members already run. All settings opens the full form instead, where service hours, counting rules, alerts, latency objectives and credits live.
 Step one: name, who it is provided for, the target and the period. All settings opens the full form.
 Step two: the members. Devices, chassis, roles, types, VMs, addresses, prefixes or circuits, several at once, and more can be added later.
Nothing is seeded: a new tenant has no agreements until someone writes one.
What counts as a member
Members are devices, virtual machines, IP addresses, prefixes (the monitored addresses inside them), circuits and switch stacks. A circuit is measured on the addresses cabled to its ends, followed through patch panels, or on a monitor address such as the carrier's far-end gateway. A stack is measured once, on its master's primary address. Devices can also join by selector (site, role, device type, platform, tag or a name pattern like leaf-*), so they come and go as they change.
Then there is redundancy, which is where most hand-built availability spreadsheets go wrong. A redundancy group counts a pair as one unit, down only while all of it is down. Units combine as Average, Worst member, or All must be up. The last one is a service in series: the carrier circuit, then the firewall pair behind it.
flowchart LR
subgraph AND["All must be up"]
C[Carrier circuit] --> FW
subgraph FW["Redundancy group fw - down only if both are"]
F1[fw1]
F2[fw2]
end
end
AND --> S[Agreement figure] The members of Internet Aarhus: a circuit, a firewall and an address, all in one group called Path, each with its availability, its coverage and the check that did worst.
Exclusions take time out of the measurement with a reason that is required, not optional, and planned maintenance on a member's device or circuit can be left out of the figure.
The Overview
An agreement's Overview computes any period or custom range up to 400 days live, per day or per hour, sliced by check group, site, check type, redundancy group or member from the filter rail on the left.
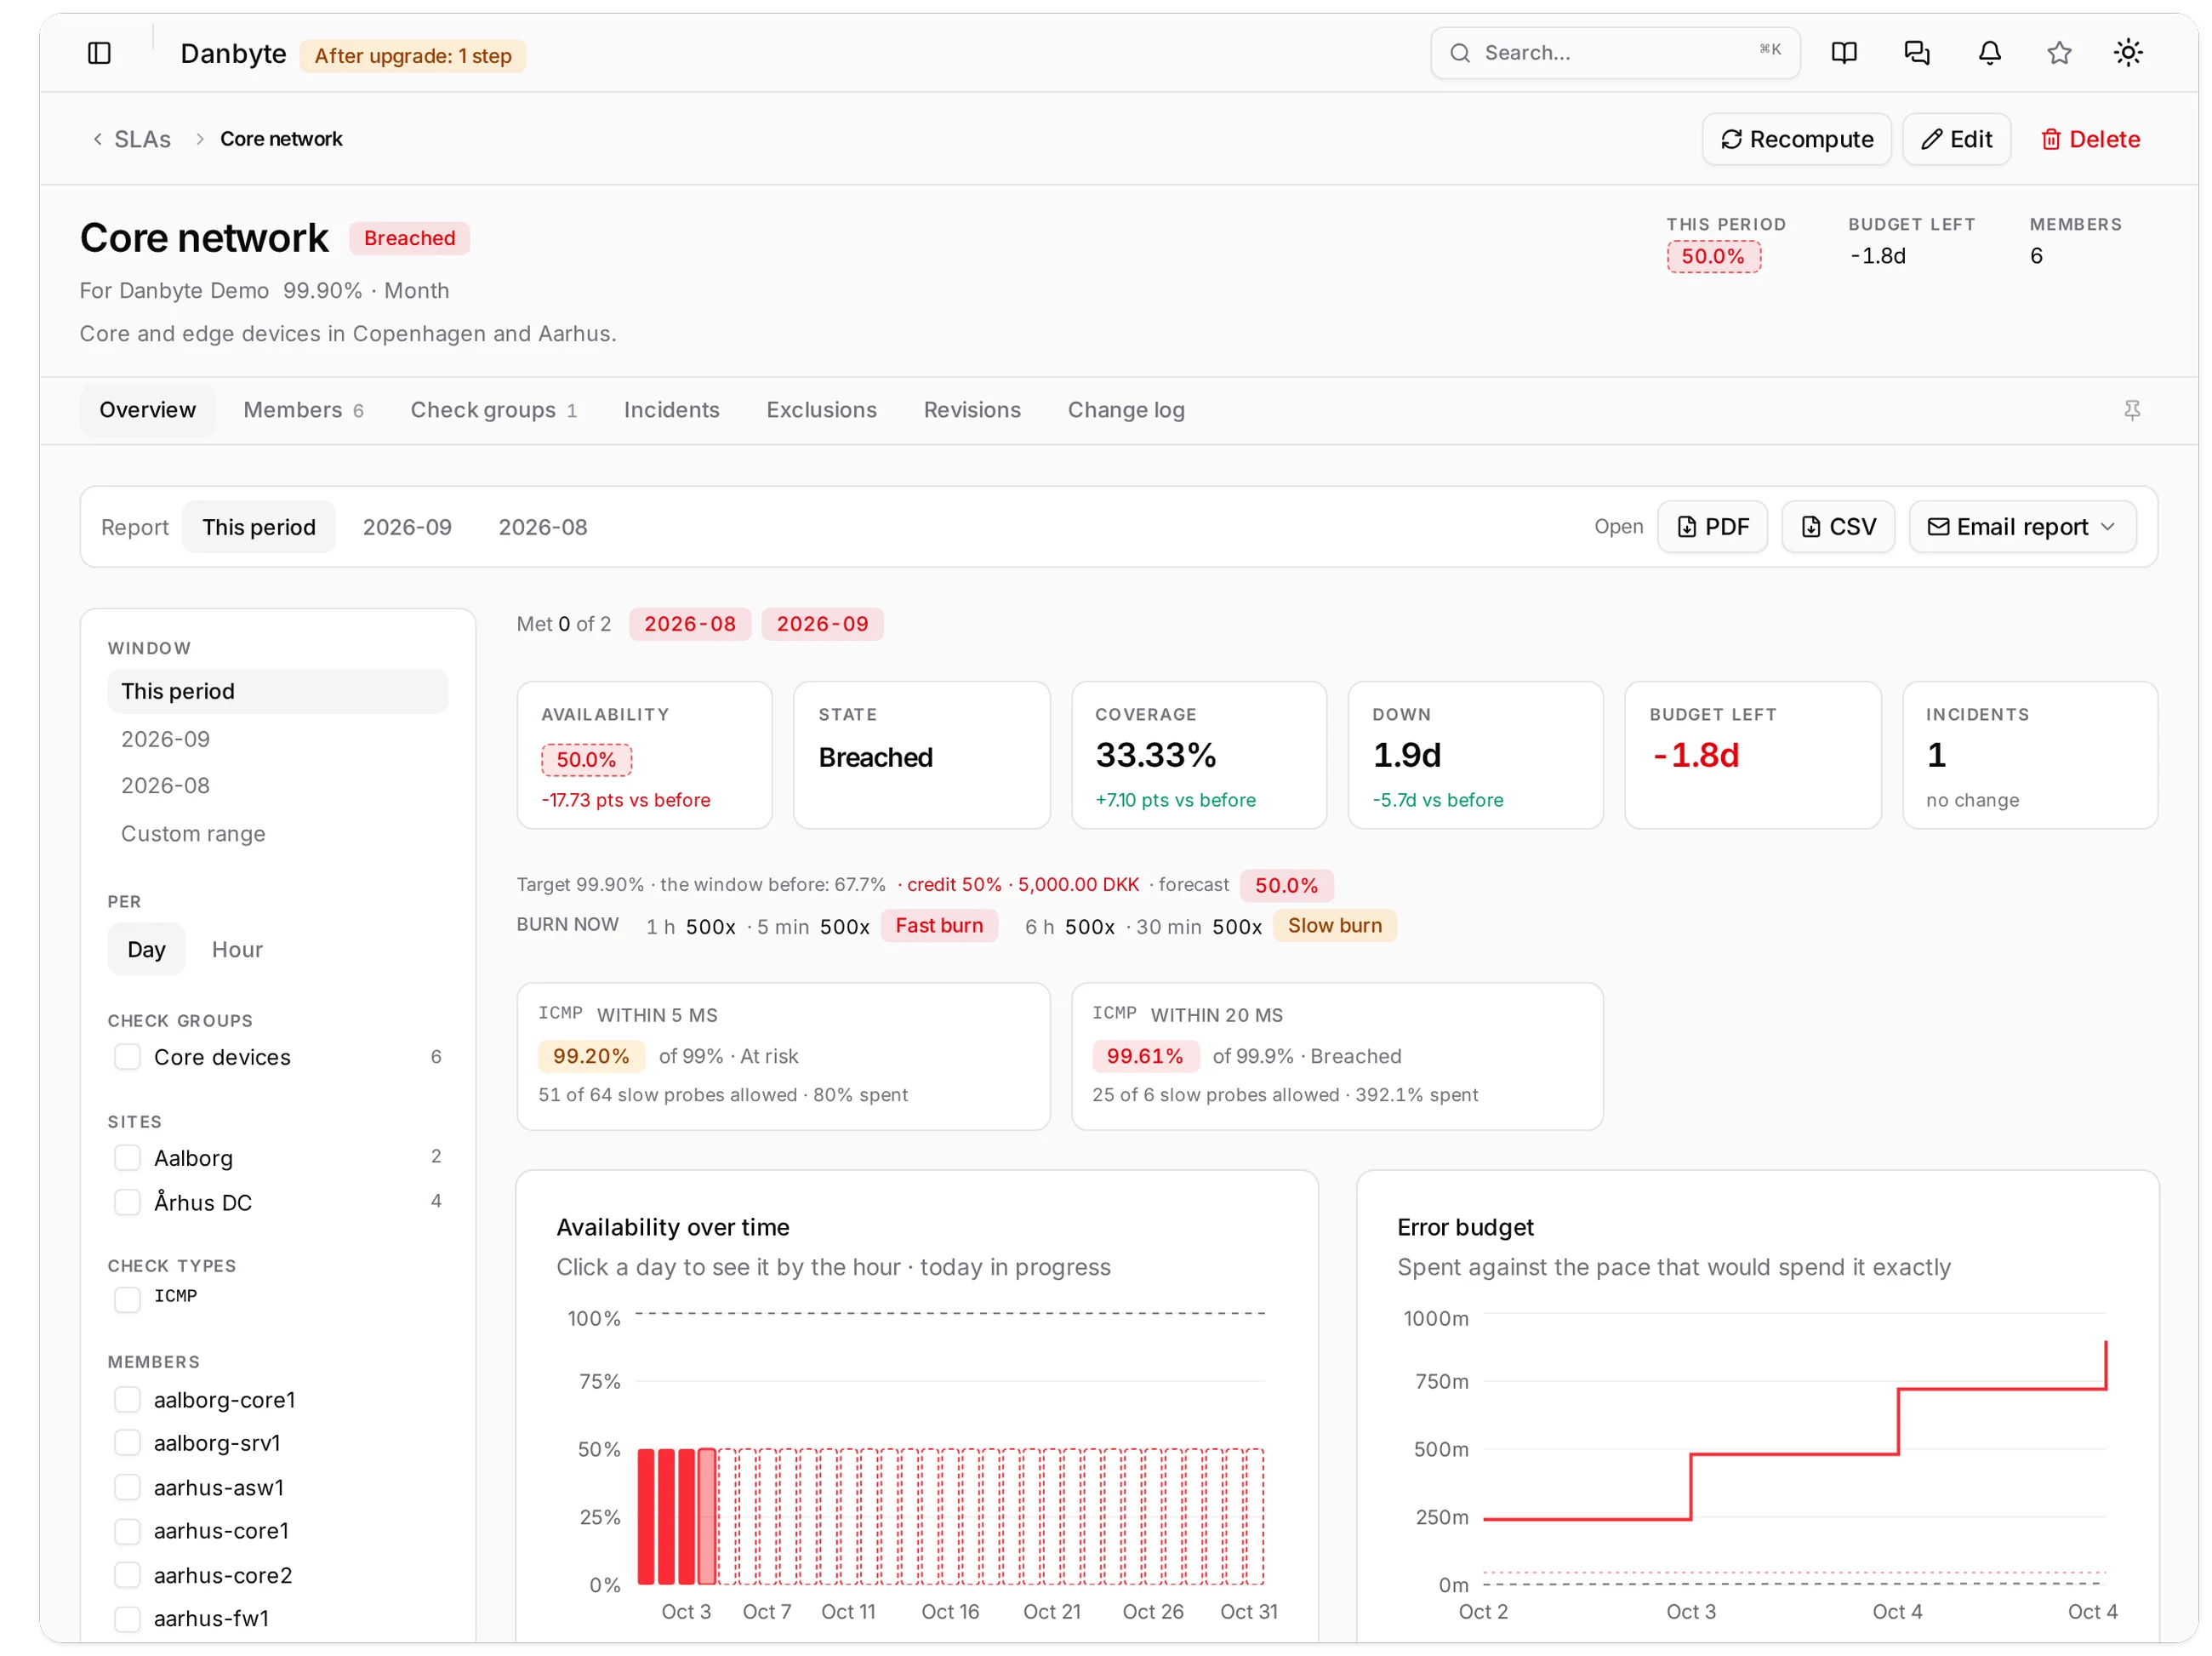
Core network's Overview: the last twelve periods as pills, the headline figures each against the window before, and the first charts under them.
The headline is availability, state, coverage, down time, budget left and incidents, each with its change against the window before. Under it: the target, the window before, the credit, and a forecast once a tenth of the period has passed: the figure so far blended with the last seven days', not a prediction model, and only while the period is open.
 The headline alone: a breached month at 50 % with a dashed outline because only a third of it was measured, the credit owed, and the burn-rate rules and latency objectives under it.
Burn now is the part worth having on a wall. Two rules watch how fast the error budget is being spent: Fast compares a one-hour and a five-minute window at 14.4×, Slow a six-hour and a thirty-minute window at 6×. A rule fires only while both of its windows are burning at or above the threshold, sends one message when it starts and one when it stops, and is checked every minute by danbyte-sla-burn. Windows and thresholds are yours to change. The point is to catch a sharp outage in the first hours of a month, instead of hearing about it when the month is already gone.
flowchart LR
  L[Long window burn ≥ threshold] --> A{Both?}
  S[Short window burn ≥ threshold] --> A
  A -- yes --> F[Firing: one message]
  A -- no --> Q[Quiet: one 'stopped' message when it was firing]
Latency objectives, 99 % of ICMP probes within 20 ms, each get a card with their own figure, budget and state. By default they report and alert without changing the agreement's state; there is a tick for counting them in it.
 Availability per day against the target, with the days still to come drawn hollow.
 The error budget spent, against the pace that would spend it exactly over the period.
 Where the down time went, by member. Also available by group, site and check type.
 When outages happen: weekday against hour. A solid block from Thursday to Sunday is one long outage, not a pattern.
 Incident lengths, with the mean time to recover above them.
 Latency against the objectives: the median and 95th percentile under each objective's line.
 One strip per member over the period, so the member that spent the budget is obvious.
 Members by check: a pill per member and check template, for when one check type is dragging a figure down.
The agreement in these pictures is breached at 50 % with a 500× burn rate because one of its members has been down for days on the demo install. It is honest data, not a demonstration of a limit.
 The same page for an agreement that is fine: 100 %, no down time, 45 minutes of budget left and every burn window at zero.
Credits, reports and alerts
Service credits price the tiers below an availability as a share of the period's fee, with a fee and a currency to turn that into an amount. They are stored with the period and revisioned with the rules, and shown only to people with the new view credits permission. A sliced analysis never shows one.
Reports download the selected period as a PDF or a CSV (the figure, the budget, the incidents, the rules, availability per day, members worst first), and are emailed to recipients when the period freezes, or on demand. Overview on the SLAs list gives every agreement for a period as one file. Changing the recipients needs view credits and an unrestricted view of every member.
 The report bar with the Email report menu open: the period's PDF or CSV, recipients when the period freezes, or one address right now.
Alerts go to any notification channel, once per period: breached, at risk, coverage low, latency objective breached, p95 above its alert, plus the burn-rate rules. And every report cell that begins with =, +, -, @, a tab or a return is written as text, so a spreadsheet cannot be talked into running it.
On lists and object pages
Device, VM, virtual chassis, IP address, prefix, circuit, site and cluster lists, and a provider's Circuits tab, gain an SLA column with the strictest agreement's figure coloured against its target (hover for all of them), and an Availability column over a window you pick on the toolbar, which says 68 % measured when part of it went unmeasured. An object in no agreement shows a dash, not a failing figure.
 The Devices table with SLA and Availability over 30 days, and how much of that window was actually measured.
 A device's Monitoring tab lists the agreements it belongs to, each with its figure, period, state and budget left.
 Add to SLA, from the object or from the device list's selection bar for many at once, with the redundancy group to put it in.
Holiday calendars
Calendars are shared across the tenant. A year view: click a day to toggle it, mark fixed dates Every year (they get an inner ring), Import to paste dates and ranges or open an .ics file, with Undo. Every agreement using the calendar skips its days; frozen periods keep the figures they already had.
 A year of Danish holidays, with the every-year switches beside them.
The topology Diagram
Maps → Topology now opens on the Diagram: one solid card per device in its role's colour, a pill in the corner for monitoring or lifecycle state, and a few card lines under the name. Wiring and Flat are gone, folded into Detailed and Simple, and old ?tab=wiring and ?tab=flat links open the one that matches.
 Århus DC in Detailed: every cabled interface gets its own nub and cable with the port name on it, the stack packed into one frame, the legend bottom left.
Cards take the role's colour with black or white text, whichever reads. At most one pill: the monitoring pill while the device is down or degraded, otherwise its lifecycle status. Card lines default to the monitoring pill, IP, loopback and serial, and are set under Settings → Topology → Card lines for all devices, per role, per saved view or per device. Most specific wins.
 Card lines, set for all devices or per role, from any field the device has including custom ones.
Detailed draws every cabled interface. Simple draws one line per device pair with a count chip, which is the view to hand someone who wants to understand the shape rather than trace a cable.
 The same map in Simple: one line per pair, compact cards. Cards are placed by their centre, so the arrangement survives the switch.
Lines are Straight, Elbow, Bendy or Cyclical, for the whole view or for one link, and link labels carry the subnet on the middle chip with each end's port and address on the cable.
 Detailed with Bendy lines.
 A spine-and-leaf fabric in Simple, with the loopbacks as card lines and the BGP sessions as faint dotted lines. The layout follows cables; sessions are drawn, not laid out.
Switch stacks stand packed in one frame with the chassis name on a strip, and Unstack draws the members apart. On big maps the layout runs in a web worker, only the cards in view are mounted, and a map too large to fit opens on its busiest device with a Partial map chip.
Photos, bands and zones
Display → Draw as → Photo draws each device as its type's front photo, with every cable landing on its actual port, or on the photo's edge when there is no marker for it. One device can be switched over on its own from the right-click menu, and gear that is not rack-mounted can be drawn at its real size.
 The same site drawn as photos, cables landing on their ports. Here in role bands, with the servers hidden and a chip offering them back.
The bands in that picture are the other half of it. Arrange ▸ Bands by role (or by device type) stacks the map into titled layers and moves every card in one undoable step. Bands merge and split, side bands span rows, and in Detailed they keep room for the port names.
 After Bands by role: Core, Firewall, Access and Server, top to bottom. Arranged for the picture and not saved; a saved view is a deliberate act now.
 The Arrange menu: reset, bands by role or device type, clear bands, and the layout direction.
 Display: group by, draw as card or photo, virtual chassis, the four line shapes, labels, colour by, LAG bundles, patch panels and card lines.
Notes add text, cloud, globe or building markers; zones frame a few cards; both take any colour from the preset grid. And a single line, whether a cable, a bundle, an LLDP neighbour or a BGP session, can be hidden from its right-click menu, with its own eye in the sidebar to bring it back.
Taking it with you
 Export: PNG, SVG, PDF, draw.io or print, for the whole map or just what is on screen.
Export writes a PNG at 2×, an SVG where each card and cable links back to Danbyte, a PDF on A4, A3, Letter or Tabloid with a title block naming the view, tenant, filters, date and Danbyte version, or an editable draw.io file, as shown or Simple or Detailed, with or without photos. Everything is drawn from the map's data rather than captured from the screen, so the cards that were off-screen are in the file. Hierarchy, Logical, Virtual topology, trace maps and a tunnel's map all export the same way.
Saved views behave like documents now: undo and redo a hundred steps, Ctrl/Cmd+S, a prompt before you leave unsaved edits, and a save over someone else's newer save is refused with Save as… or Reload rather than quietly winning. A star beside the Views select sets the tenant's default view. Site map, Floor plans, Topology and Virtual topology share one toolbar, one Objects sidebar and one Display popover.
Racks, in 2D and 3D, with live ports
A rack page now puts its facts on the left and the rack on the right under Elevation, front and rear side by side, zoomed to fit, with a 2D | 3D switch.
 DCT-A01 in Images: photos of the real hardware, each block's ports in use over ports counted, and the servers' rear photos between the PDU strips.
Three ways to draw it: Names, Images and Render. With Ports on, Images marks the ports on the photos that have markers, and Render draws each faceplate as hardware: cabled ports in their speed tier, free ones outlined, reserved amber, disabled dashed, trunks notched, and a live SNMP dot where the port is polled.
 CL-R02 in Render: faceplates drawn as hardware, drive bays and all, with the rear plates beside them.
Every block shows ports in use over ports counted. Hover a port for the same card the device page shows, including the far end; click a cabled port for its trace, a free one for its page. On the rear, a full-depth server shows its rear photo, NICs and power inlets live, instead of hatching.
 A whole rack in Render.
 The Capacity card: height, devices, units used and free, ports, panel ports, power and weight.
The Capacity card splits ports from panel ports, reads power over a kilowatt in kW, and where a rack has no primary feed it falls back to its PDUs' inlet rating, treating two or more as an A/B pair rather than adding them up.
3D
 DCT-A01 in 3D: drag to turn, scroll to zoom, double-click a device to frame it.
3D is the floor plan's own 3D room narrowed to one rack: photo faceplates, coloured ports, Front, Rear and a PNG button. Cables are not drawn in 3D yet.
 The rear: server rears between the red and blue PDU strips.
 Display over the elevation: names over photos, ports, and on racks whether to show everything or only what is mounted front or rear.
Showing only front- or rear-mounted gear leaves the rest as nameless hatched space, so the units used still read true.
Part status puts a disk, PSU or fan marker in its part's own status, on the device page, on the rack and cabinet drawings and in 3D. Its card lists the statuses as pills and a right-click turns them into a menu. A port's state is not settable this way; that still comes from its cable and its enabled flag.
 Right-clicking a disk bay: the part, and its status as a menu of pills.
Export
 A rack's Export: PNG, SVG, PDF or print, with the paper size.
PNG at 2×, SVG with its fonts and photos inside the file, PDF on A4, A3, Letter or Tabloid with a title block the server writes (name; site, location, type, units used and free; date, version, page), or print. Front and rear side by side, in whichever mode is on screen, light-themed, drawn from the data, and named after the rack and the day. In Render the PNG is a picture of the screen; SVG and PDF draw the Images look.
DIN-rail cabinets
A cabinet is an enclosure whose gear sits on DIN rails rather than in rack units: a control cabinet with a PLC and industrial switches, a distribution board. Positions are in millimetres, so it is a model of its own beside racks, not a rack of some other height.
 A cabinet in 3D with the door open: the mounting plate, two rails, six devices with their photos and marked ports.
 Close door. The enclosure at its outer size, where it will actually sit on the wall.
Cabinets have types, a model carrying plate and box sizes and rail templates with Sync from type, plus roles, statuses, tags, custom fields, documents, a journal and a change log, and a Cabinets tab on sites and locations. Rails are TS 35, TS 15 or G 32, placed by their left end and centreline on the plate and checked for overlap, edited beside the drawing.
 The plate in Images: calibrated photos at true size on both rails, with the speed key under them.
 The same plate in Render, cabled ports in their speed colour.
 Names: each device a box in its role's colour. The PLC has no role, so it stays neutral.
A device type carries its size in millimetres and the profiles it fits; a device sits on a rail at an offset. The device form's Mounting card switches between Rack and Cabinet and draws the plate with the device's outline on it, snapping to its neighbours and turning red where it would overlap.
 Mounting: the cabinet, the rail, the offset in millimetres, and the free space the device could take.
 Arrange turns the plate into a placer: move several devices and save them in one go, so two can swap places.
 The cabinet's Export, A4 landscape by default.
A floor plan tile can link to a cabinet. Its panel shows the plate and the devices rail by rail, and in the 3D room it stands as a box whose card opens the door.
 A floor-plan tile linked to the cabinet: status, devices, rails, outer size, facility ID, the plate and the devices rail by rail.
 The tile's popover, with Open cabinet and Contents & trace.
MAC tracking
Switch ports now show what is behind them, and a MAC page answers where a MAC is.
 A MAC's page: where it is, what address it has and where that came from, what it is called, and how many ports and switches have seen it.
Danbyte reads a switch's MAC address table over SNMP (Q-BRIDGE-MIB with VLANs, BRIDGE-MIB as the fallback, and per-VLAN tables where a switch needs them), keeps only the learned entries and maps each to its real port. Learned MACs show per port on the SNMP tab and under Components → Interfaces, and every interface gets a MACs tab.
 sw-acc-03's interfaces with a Learned MACs column: the phone and the PC behind each desk port, with their addresses.
 The same column on Components → Interfaces, beside type, LAG and the interface's own MAC.
 An interface's MACs tab: vendor, VLAN, address, name, first and last seen, and state.
Uplinks have to be told apart from access ports or every MAC in the building lands on the trunk. Danbyte uses an LLDP switch neighbour, a LAG, a count above Uplink above, or the interface's own Uplink setting: Automatic, Always or Never, on the form and in bulk edit. An IP phone with a PC behind it stays an access port.
 Uplink on the interface form, beside Status.
flowchart TD
  S[Polled switches report MAC on port + VLAN] --> A{Seen on an access port?}
  A -- yes --> L[Location: that switch, port, VLAN]
  A -- no, only uplinks --> U[Location: the nearest uplink, marked 'behind uplink']
  A -- not reported any more --> G[Gone, with last seen; kept 30 days]
A MAC's page gives its Location (switch, port, VLAN and since when; behind uplink when no polled switch has it on an access port), its IP with the source that claimed it, whether an ARP table, DHCP or an IP record, and its Name, from an interface or MAC object first, then reverse DNS, DNS records and DHCP names. The Observed tab lists every port and ARP table that has seen it.
 Observed: the access port and the uplink that both saw it, and the router whose ARP table has its address.
 The Learned tab on /macs: one row per MAC at its location, with uplink chips where that is the best Danbyte can say.
 A MAC pasted into search, in any notation, finds the port it was learned on.
Each MAC keeps its first and last seen per port and per VLAN and stays as history for as long as Forget MACs unseen for says. Refresh MACs re-reads a switch's table in the background. Nothing here writes inventory: a learned MAC never becomes a MAC object on its own.
 The MAC tracking card: how many to show per port, the uplink threshold, LLDP neighbours, and how long to remember a MAC that has gone quiet.
 Per-VLAN MAC tables on an SNMP profile: auto, always or off.
VLAN-aware and per-VLAN tables through an Outpost need danbyte-outpost 0.9.0. An older agent keeps working the way it always did.
Capacity and speed on the maps
Link speeds
Circuits, tunnels and cables between sites now carry their speed on the site map: a circuit's commit rate, else its port speeds, else the cabled interfaces; a tunnel's own capacity; a cable's slower end, followed through patch panels. Unknown is left blank, never guessed.
 Denmark by link speed: the figure on the line, and the legend for the tiers.
 Display on the site map: labels by name or speed, and Color by type, status or speed.
Floor plans by capacity
Floor plans, in 2D and in the 3D room, colour by Type, Space, Power, Ports, Panel ports, Rack role or Status. The measures share one scale: green to 80 %, amber above, red above 95 %, grey where there is nothing to measure. The figure is written on the tile, so nothing rests on colour alone, and monitoring keeps its red outline. The legend, with a count per level, goes into the PNG.
 Hall C coloured by space, with the figure on every tile and the rack table under the plan.
 The same hall by power.
Coloured by racks, a sortable, filterable rack table opens under the plan: name, role, status, devices, used, power, ports, panel ports, tags. Pointing at a row rings its rack; clicking zooms to it. On a hundred-rack hall that is the difference between a picture and a tool.
 A hundred racks by ports, with the table under it: used, power over supply in red, and ports.
 The 3D room, racks tinted by space.
A site's Capacity tab
A site's Capacity tab adds its racks up floor plan by floor plan (racks, devices, space, power, ports and panel ports) with a thumbnail coloured by the measure you pick, and the racks that are on no floor plan kept apart. The racks list gains Power, Ports and Panel ports columns on the same scale.
 Capacity Lab by space: each hall's totals, the PDU-rating and no-supply counts, and the racks on no floor plan at the bottom.
 The same tab on power.
Upgrades that check themselves and roll back
Every path into an upgrade, whether the in-app button, an uploaded bundle, automatic updates, danbyte-admin upgrade or a re-run of install.sh, now hands over to the target release's upgrade stage, run as the service user's danbyte-upgrade.service. A fix to the upgrade therefore reaches the upgrade to that release, instead of arriving one release too late.
flowchart LR
  subgraph UP1[Site up]
    P[preflight] --> B[backup] --> PR[prepare: build, deps]
  end
  subgraph M[Maintenance page]
    Q[quiesce: stop timers, workers, web] --> SW[swap] --> D[deps, check] --> SN[snapshot] --> MI[migrate in one transaction] --> ST[static] --> V[verify]
  end
  subgraph U503[503]
    S[start + health checks]
  end
  subgraph UP2[Site up]
    R[resume: timers back] --> DN[done]
  end
  PR --> Q
  V --> S --> R
  Q -. any failure before resume .-> RB[roll back code, venv, frontend, .env, units, and the DB from the snapshot]
Services stop before anything changes (timers, workers, the fast lane, web, websockets, frontend, docs) and start again only once the new release has migrated and /api/health/, the admin page and the units all pass. Migrations run in one transaction where they can, after a database snapshot only the service account can read. A failure before users are let back in puts back the code, the virtualenv, the frontend, the static files, the .env, the unit links and, when the migration ran, the database.
The downtime is quiesce to resume: the dump when migrations are pending, the migrations, the checks. The frontend build and the dependency download happen before any of it.
 The installer re-run on a 0.16.13 host: the stage's steps, then the host steps, then the version it ended on. Both units carry on if the SSH session drops.
A killed upgrade recovers itself: a recovery unit finishes it or rolls it back before any Danbyte service starts after a reboot, and danbyte-admin upgrade recover runs that by hand. The upgrade also waits up to twenty minutes for the system's own package updates before it stops anything. Settings → Updates gains a Last upgrade card, an automatic or failed upgrade is mailed to the digest recipients and listed on the Jobs page, and automatic updates retry a failure that happened before any service stopped after 1, 4 and 12 hours, and refuse to migrate unattended when the database could not be rolled back.
A rollback is promised up to resume, and not after it. Once users are writing again, a later problem keeps the new release and says so.
 Upgrade from a bundle: uploaded, checked, backed up, migrated, restarted.
The app never gets root. What needs root (nginx, logrotate, the certificate unit) runs from a root-only copy of the bundle as danbyte-install-host.service, and after an upgrade from the app Settings → Updates shows one card with one command.
 After this upgrade: one card, one command, and the list of what it covers. Do it by hand opens each step's own snippet; Mark all done closes it.
 Do it by hand, for an install where one step needs doing differently.
 The top bar says there is a step waiting, until someone says it is done.
A downgrade is refused however the upgrade starts, and install.sh ends by saying what it did: from and to, the root steps, the warnings.
Also new
Bulk actions with a preview
Bulk delete arrives on circuits, providers, provider networks, circuit types, wireless LANs and groups, and virtual chassis, each with a preview of what goes, what is released and what is kept. Virtual chassis get bulk edit; MACs can be removed, cleared from interfaces or unpaired from IPs in bulk, with a dry run. Selections stay on their rows, drop the rows a filter hides, offer Select all N, and run past a thousand rows in batches with progress on the button.
 Two circuits ticked, and the floating bar that appeared for them.
 The preview before anything happens: what will be deleted, and what goes with it.
The space map
A prefix's Map tab draws its children and zooms in when you click one. A free block offers New child prefix here and Register an IP here; IP ranges show as amber strips; rows past eight bits draw as strips rather than thousands of boxes. Aligned draws each row under the blocks it splits, and the zoom path is in the address bar.
 The space map of a /16, one row per prefix length, with the partly used block outlined at the start of each row.
One rule for counting ports
Physical interfaces and front ports count. Virtual interfaces count only when Count virtual interfaces is on, deployment-wide. Rear ports never count. That one rule now feeds every port figure in Danbyte (racks, floor plans, the device card, the stack card, Port utilization, the Devices list, spec sheets and alert rules), so a 48-port switch with a hundred SVIs reads 38/48 instead of 38/148.
 The Port counting card: one setting, and every port figure follows it.
Smaller things
VLANs get a status of their own, Active, Reserved or Deprecated, and bulk edit across groups. Wi-Fi gains WPA2, WPA3 and OWE security modes with PMF. Virtual machines can carry routing. Module and rack types import from the library. Sites, regions and locations take a marker colour and icon in bulk. Spec sheets sort naturally, so DIMM 2 comes before DIMM 10, and show RAM in GB. Every field can be a list column now, including related objects one step out and all custom fields. Dashboards can be named, with a TV mode. Monitoring history outlives the raw results, hourly for thirty days and daily for good, with Explore and Latency over it. And an address can be excluded from monitoring, or have its availability reset.
Fixes
Bulk delete and bulk update answered 500 for ids that were not ids, or for a body that was not an object; they answer 400 with the reason now (#280). Dashboards and monitoring filters do the same, and the topology API reads an absurd depth as unreadable rather than trying it (#273, #275). A bulk delete used to report every row the database removed along with the selection, so one monitored IP read Deleted 7000 IPs, and logged each delete twice.
LLDP links to a switch stack were drawn once per member (#283). The API and the spreadsheet imports now refuse a status the catalog does not offer that object type, as the forms always did (#292). Changing one SNMPv3 key on a profile or check template wiped the other; an edit keeps the keys it does not send, and null removes one; saving a profile also keeps the settings its form has no field for (#302). Settings → Updates no longer shows two contradicting steps for the nginx backup location (#242).
nginx can read Django's static files again: since 0.16.12 the admin and the browsable API came without styling, because /static/ answered 403. A prefix's address list answered 500 for an address a script had stored with a mask. A patch panel's photo showed its front ports with the rear ports' state, and clicking one opened the cable dialog on the wrong port. SNMP interface samples are pruned after three days; nothing pruned them before. The fast lane reconnects after a database restart. The alert list's silenced flag ignored silences scoped to a device, and a layout saved with Set as new-user default was ignored. Business hours on contacts and providers showed a clipped AM/PM under a 24-hour clock. A cable or status colour saved without its # painted nothing on the topology map. The Regions list's bulk bar offered Rename and Clone, which never worked there. And scripts/build-release.sh builds on a host without clang.
Faster
A site-scoped user's permissions load once per request rather than per object: /api/me/ went from 178 queries to 25, and a site-scoped list of 960 addresses from 3.7 s to 0.9 s. The IP, interface, cable, VM, status and permission lists no longer query per row, so a page of ten devices takes about 100 ms instead of 280 (#241, #254, #288). Tags load into plain lists, taking those 960 addresses to 0.5 s (#296). The site-separation setting is read once per request (#297), the interface list fetches parents, LAGs and bridges only for the rows on the page (#298), a bulk delete's preview costs the same whatever the row count and the delete about half as much per row (#282), the dashboard reads statuses and address counts with their rows (#299), and one- and two-letter searches no longer scan the whole index (#300).
Security
Operator and Read-only no longer reach users, groups and permissions. All object types included them, which meant an Operator could edit groups and grants to give itself more, and a Read-only account could read every account on the install. It now covers every type but those three; a grant reaches them only by naming them. Holding change on Users is what opens the Admin pages and tenant settings, and permissions can no longer be staged through a planned change. The migration that rewrites existing grants is described under Upgrading (#272).
People pickers (notification subscriptions, script sharing, viewer invites, task assignees, user and group custom fields) list the tenant's people without their email addresses unless you may view users. Export and label templates stay inside the tenant: a relation hands a template only this tenant's rows the user may view, accounts and grants cannot be a template's subject, and a template that filtered through a relation, called values/values_list or printed an owner's email now renders nothing or fails outright. Sign-in mail for superusers, deployment admins and people in several tenants goes through the deployment's mail server rather than a tenant's relay.
A site certificate upload could replace another site's certificate on a shared nginx; the apply unit and danbyte-admin tls now touch only Danbyte's own site and leave certbot's links alone (#279). The installer runs nothing from the app directory as root, and bundles are packed with root as the owner. Config renders and bundles run with the requesting user's permissions (#255). CSV and XLSX exports, the label sheet and SLA reports write a cell starting with =, +, -, @, a tab or a return as text (#256). An import could reference another tenant's ports; MAC rows and port or VM interface references now resolve inside the active tenant. An Outpost writes SNMP results only for the devices it polls (#293, #295). Dashboard monitoring widgets stay empty without IP view, and a photo marker for a port you cannot view stays unresolved (#268, #294). Uploaded photos and image attachments lose their metadata, GPS position, camera and serial number, XMP, IPTC and comments, since device type photos are served without a login (#291).
Upgrading
The safest path off 0.16.x is re-running the 0.17 installer from the bundle, because that runs the new upgrade stage in full. An upgrade started from 0.16's Updates page is still run by 0.16's upgrader; 0.17's migrate makes that safer, stopping the services first and migrating in one transaction, but it is not the whole stage.
# The safest path: the 0.17 installer runs the whole upgrade stage
sudo tar xzf danbyte-0.17.0-linux-x86_64.tar.gz
cd danbyte-0.17.0-linux-x86_64
sudo ./install.sh

# After an upgrade from the app: this release's root steps only
sudo ./install.sh --host-only

# Optional: build hourly and daily rollups from the history already on disk
manage.py rollup_checks --backfill 90
After an upgrade from the app, Settings → Updates shows one card, Run this release's root steps: sudo ./install.sh --host-only from this release's bundle applies nginx, logrotate and the certificate unit. 0.16's advice to run sudo make install-tls-unit or host-sync from the app directory is replaced by the bundle.
Access grants are rewritten (auth_api.0024 to 0026). Users, Groups and Permissions are named on the all-object grants that were administrator grants, and taken off every other one, including the built-in Operator and Read-only grants, and the migration prints what it trimmed. If that would leave nobody able to manage users, those accounts get a grant of their own, Kept user management (0.17 upgrade), and Settings → Updates lists it until your administrators are in the Administrator group (#272).
Migrations apply automatically: api.0178 to 0195, auth_api.0024 to 0026, core.0055 to 0058, monitoring.0094 to 0108 and routing.0013. api.0185 stores addresses that were saved with a mask bare, and logs a row whose bare address is already taken.
Three timers are new, danbyte-rollups every five minutes, danbyte-sla every fifteen and danbyte-sla-burn every minute, and the upgrade links and enables them. MONITORING_ROLLUP_HOURLY_RETENTION_DAYS (default 30) sets how long hourly rollups are kept. Rollups record from the upgrade on; manage.py rollup_checks --backfill 90 builds them from the history already on disk.
Outposts need danbyte-outpost 0.9.0 for MAC tracking with VLANs and per-VLAN tables; older agents keep working the old way. Rendered configs may reorder once, because component lists now come in natural order (#244). Existing VLANs start without a status, and existing SSIDs keep WPA Personal, WPA Enterprise and WEP as legacy modes with PMF blank. A topology view last shown on Wiring or Flat opens on the Diagram and brings its arrangement and zones across, waiting for a Save. On Docker: build, stop the scheduler, workers, fast lane and websockets, then up -d. For plugins, list pages pick up the new columns from the plugin's list serializer; mark the getters only a detail page needs with @detail_only.