
New floor plans, rooms, lifecycle, PRTG, pipelines, reports and SBOMs
Floor plans that stack into buildings, rooms of their own, lifecycle and installed software for every device, PRTG monitoring, deploy pipelines and SBOMs.
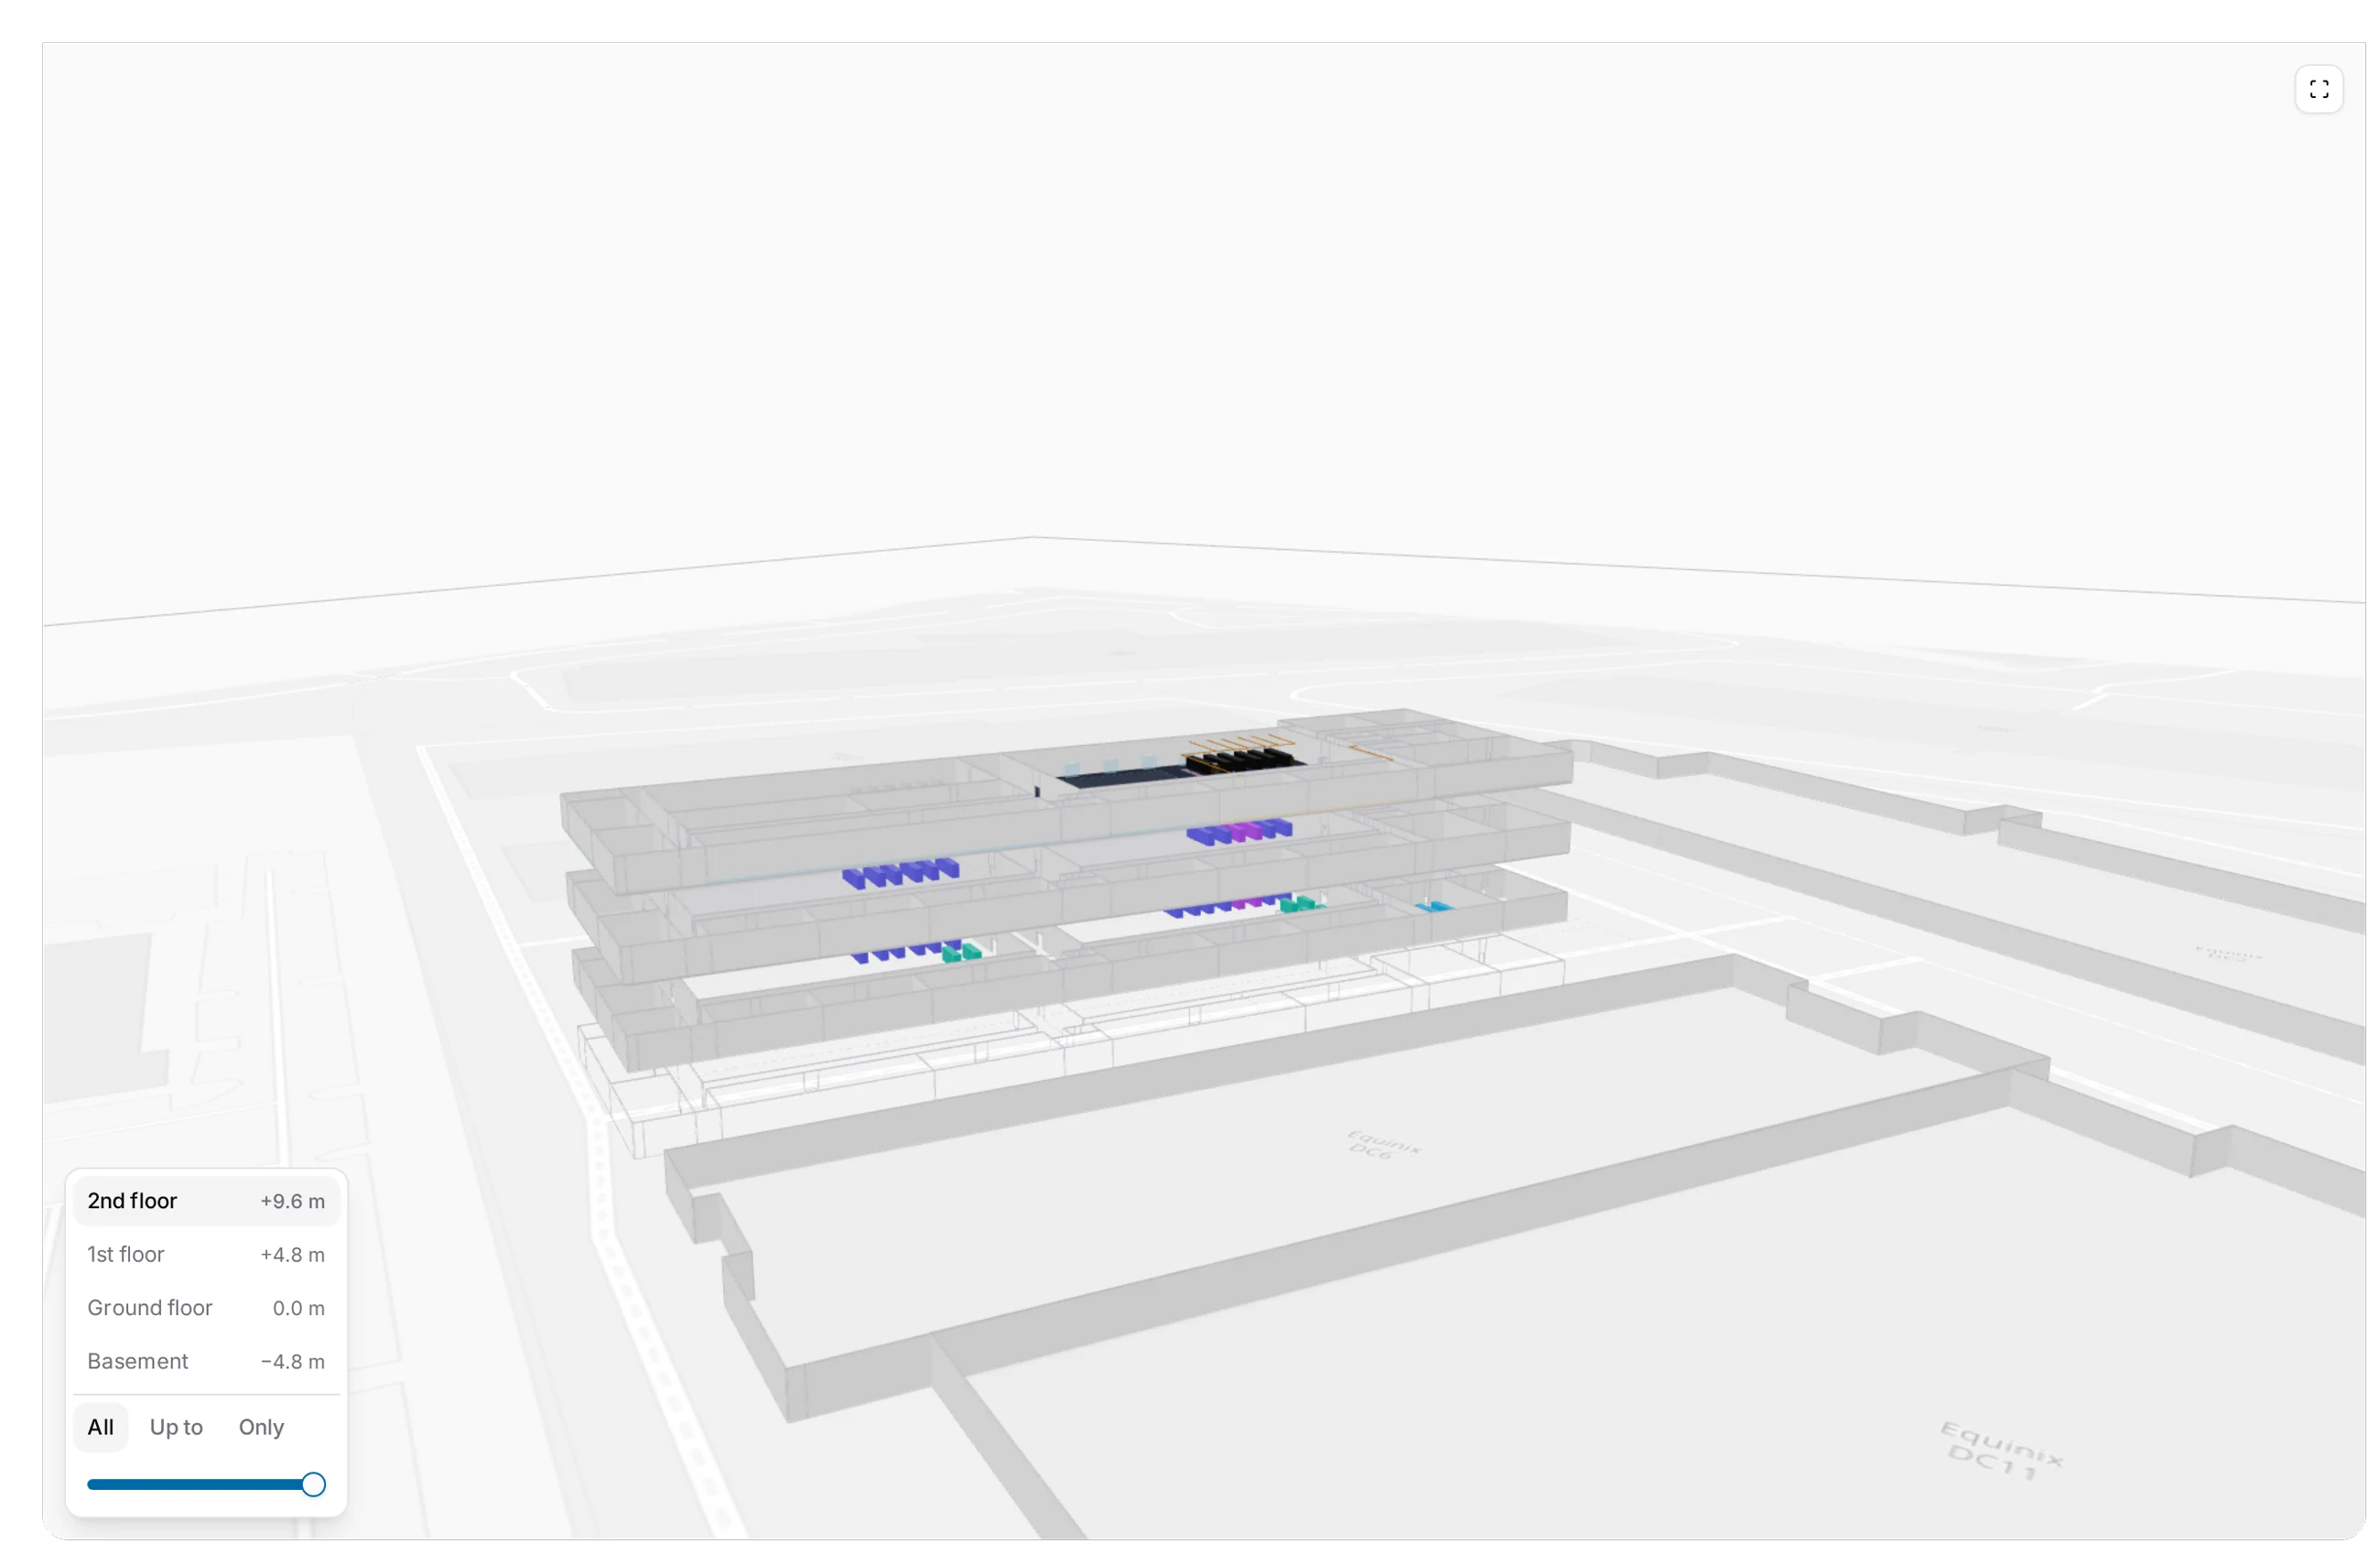
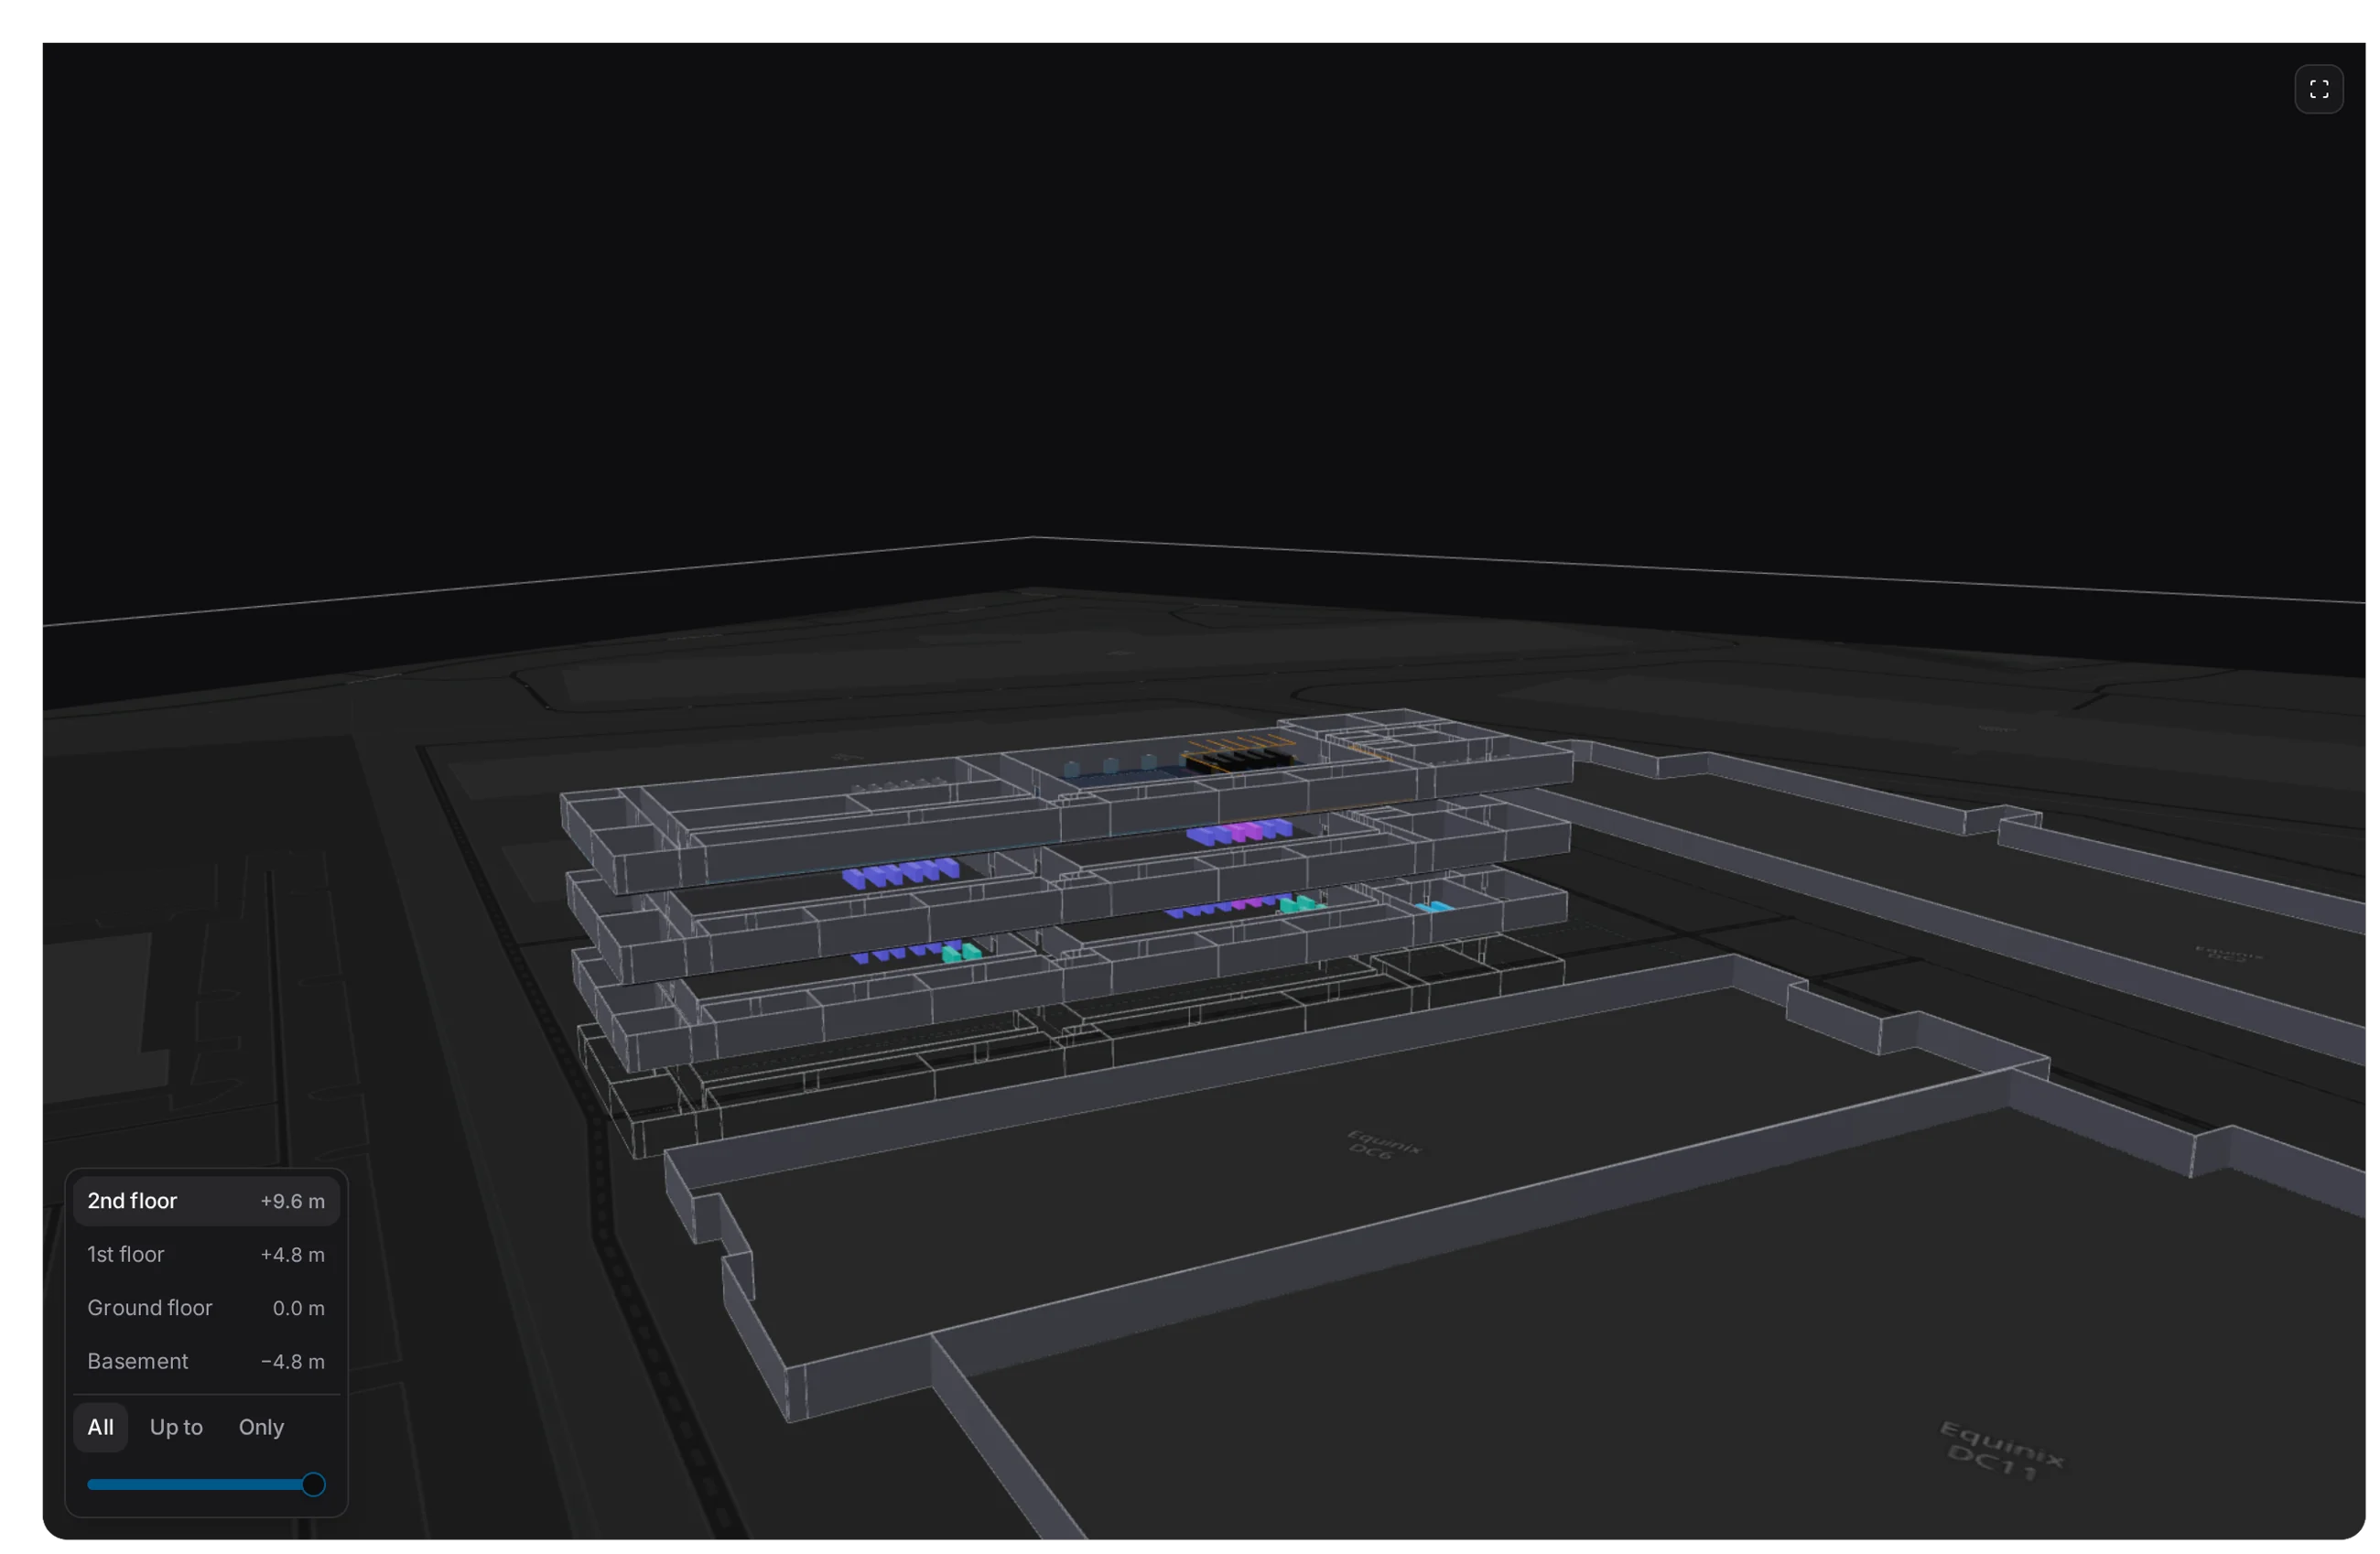
0.19 turns floor plans into buildings. Floors stack into aligned levels you can look at all at once, up to one floor, or one at a time, in 2D with onion skin and in 3D, with rooms, walls, cable routes and camera coverage drawn on them. Rooms are their own thing now, so a device, rack or cabinet names the room it stands in. Lifecycle gets its own page, listing every device and VM against its hardware, OS, support and installed-software end dates, soonest first.
Around those: cooling modelled next to power, application flows on their own map, PRTG monitoring in both directions, deploy pipelines that run automation targets one after another, PDF reports, SBOMs of your inventory, RPKI and MACsec, much faster big lists, and a long run of security and correctness fixes. One migration deletes prefixes whose CIDR is not an address, and systemd installs need one root step afterwards. Both are under Upgrading.
Floor plans become buildings
Floors stack. A plan's floors sit in a switcher, and they line up into one building with basements, a shared footprint and a slab thickness, 300 mm unless you say otherwise. Same footprint as on Add floor copies the outline, the walls and the background to the new floor.
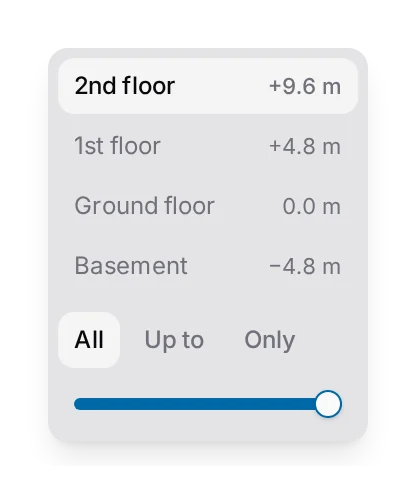
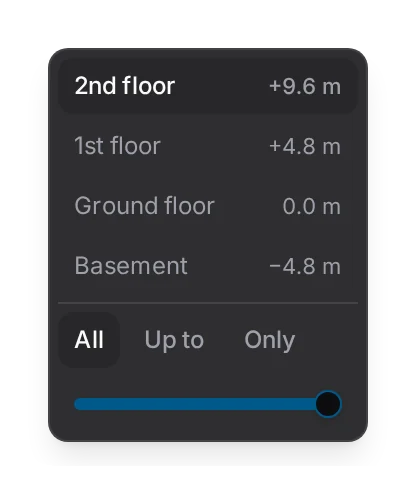
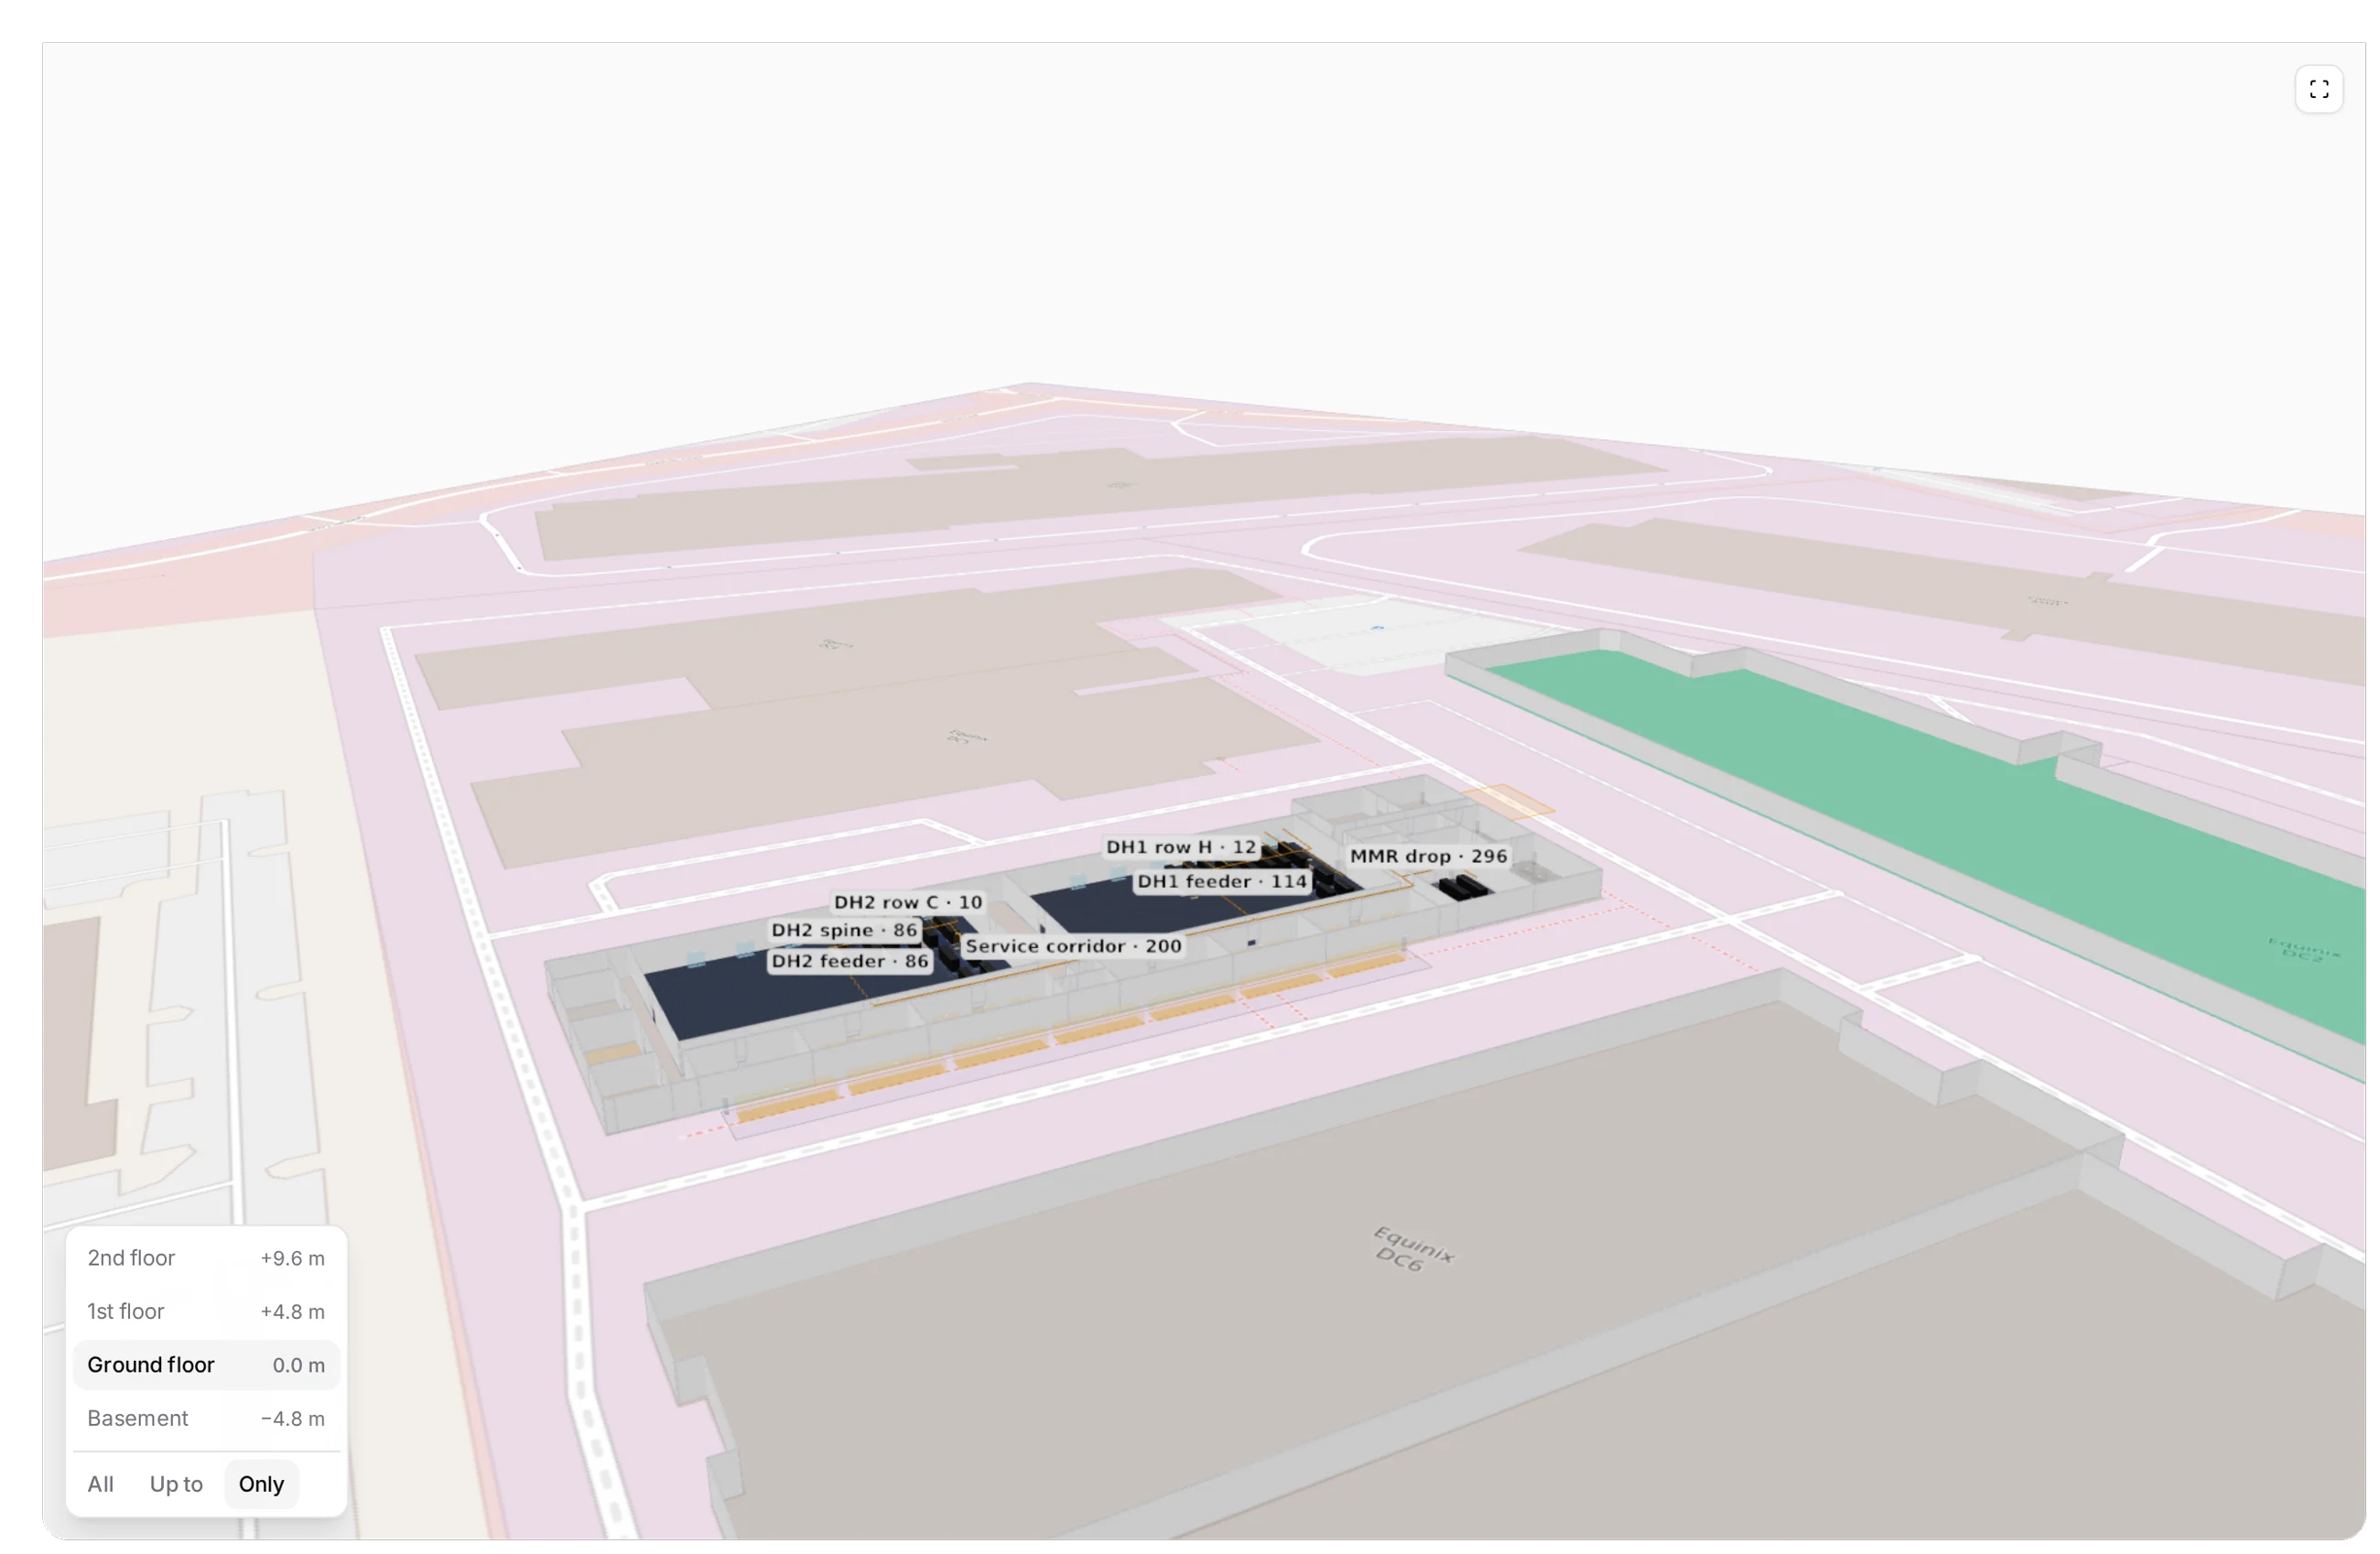
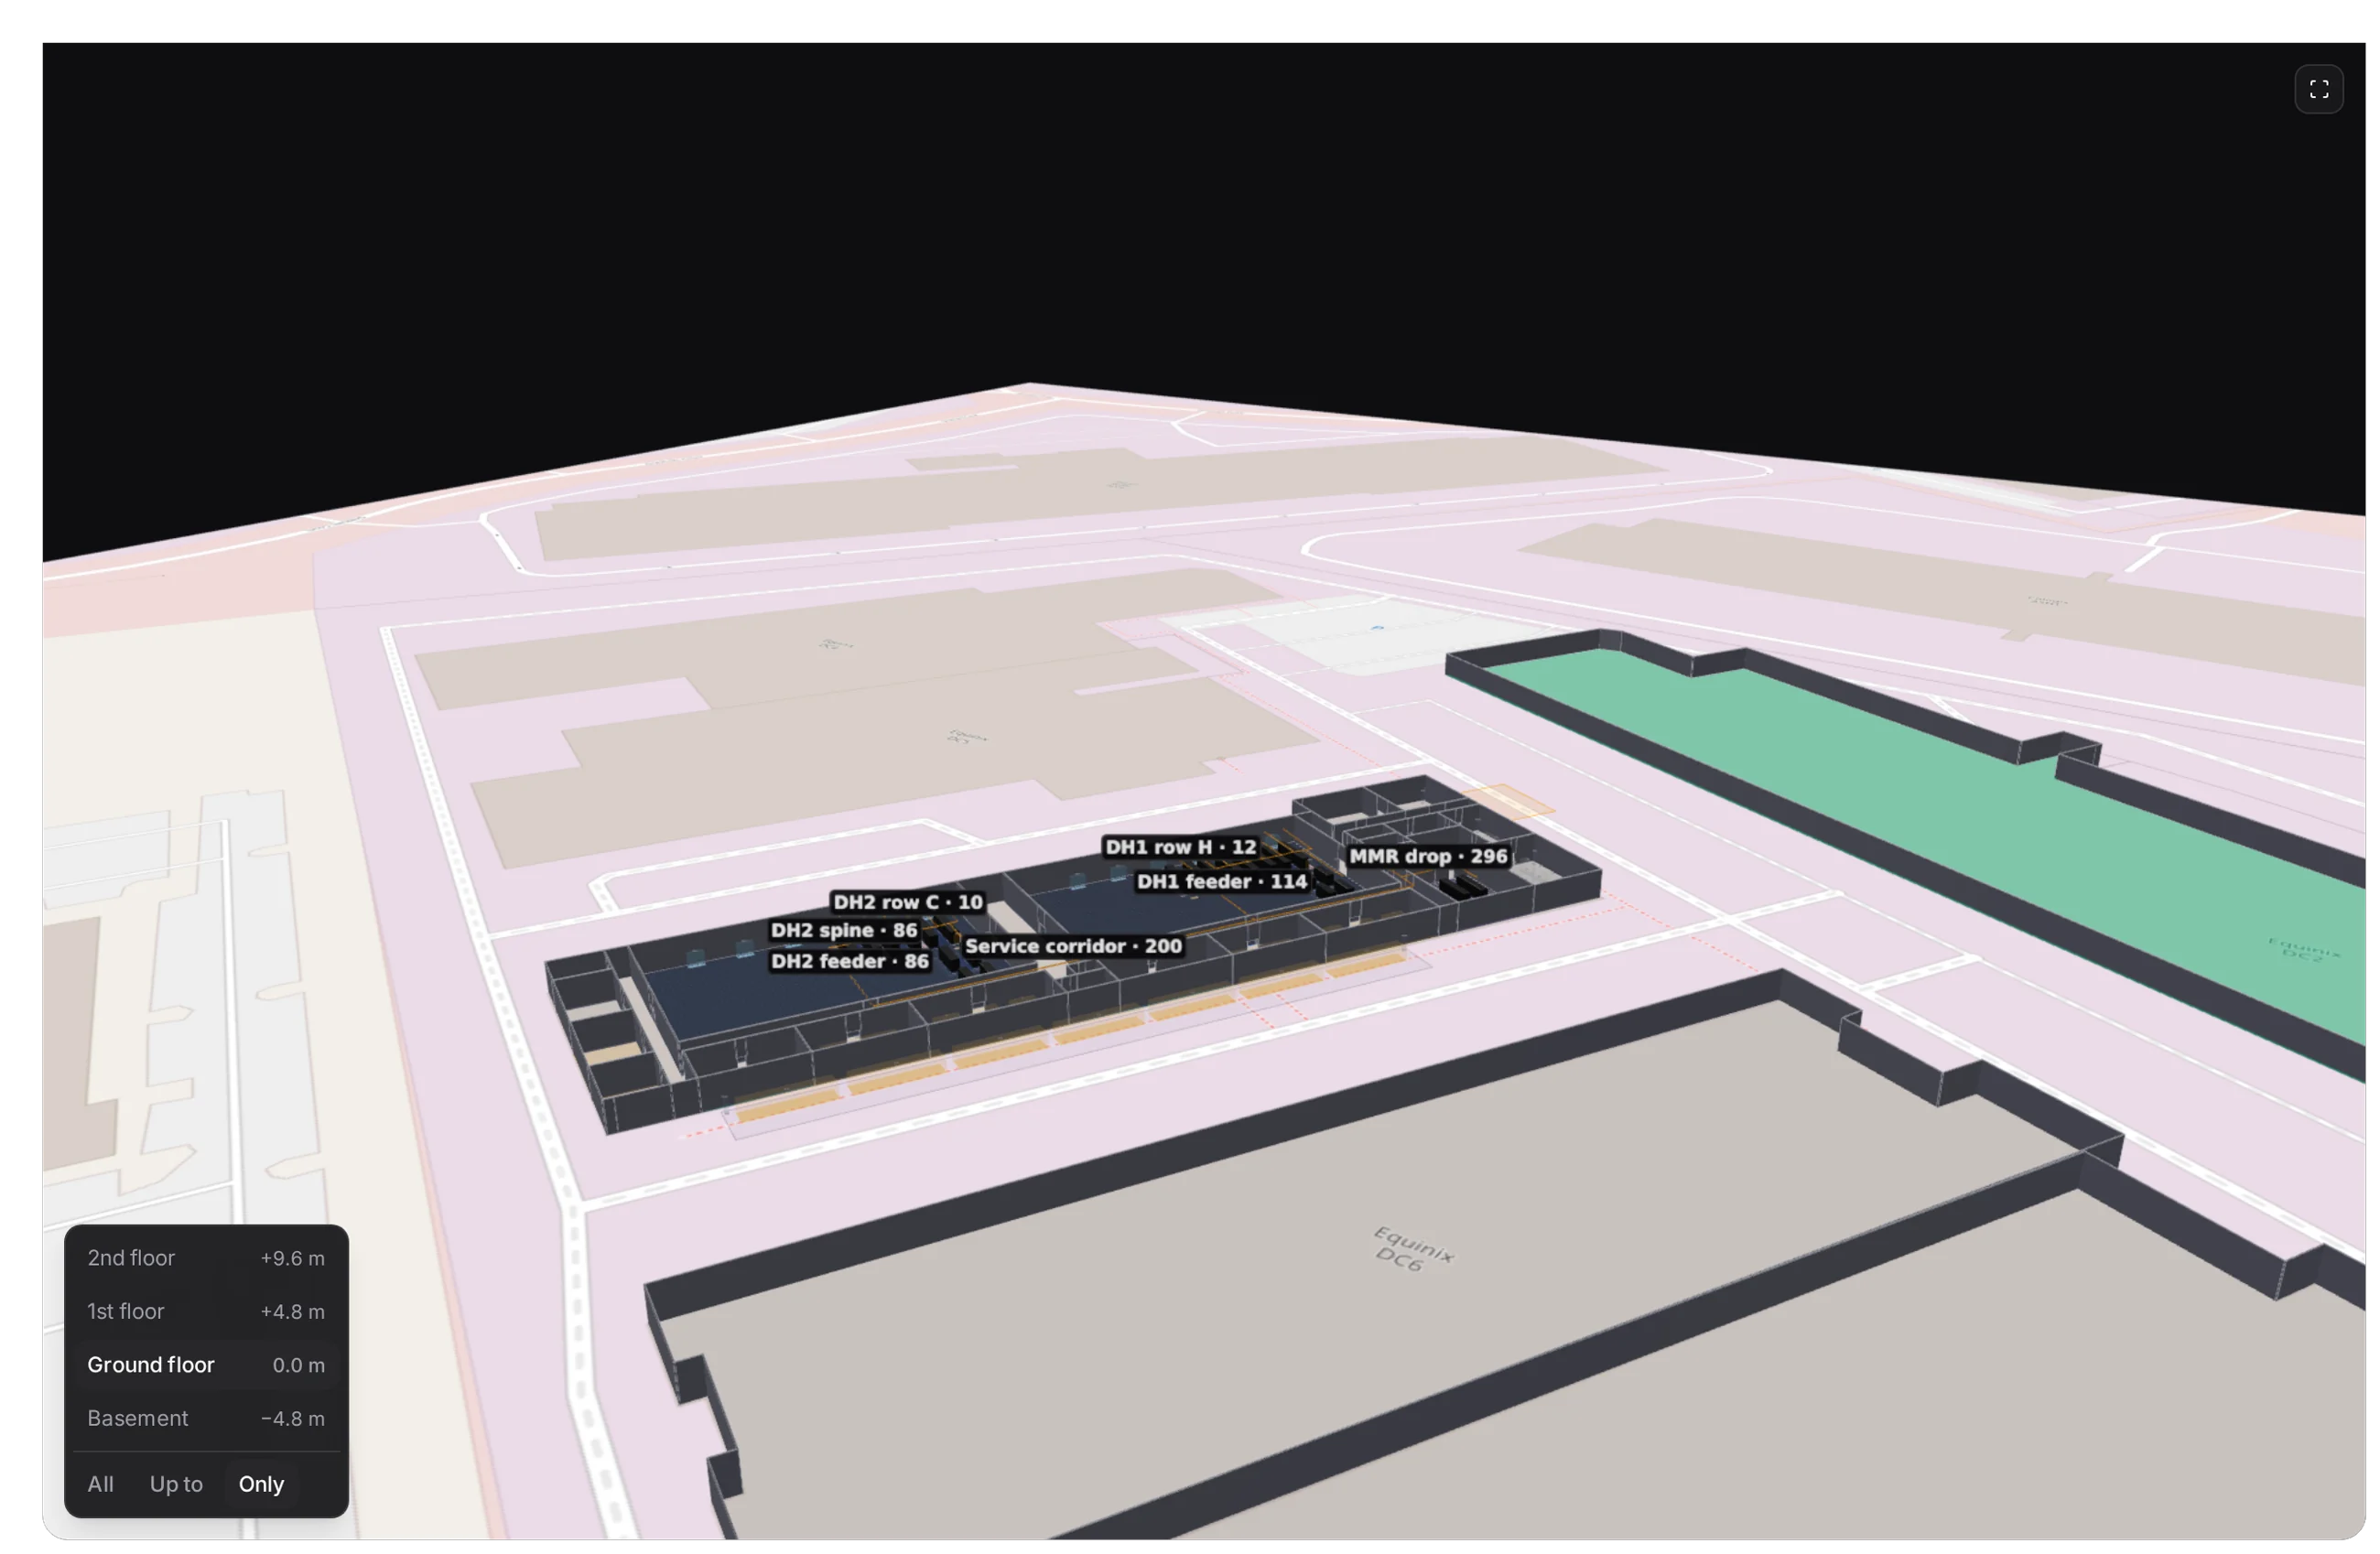
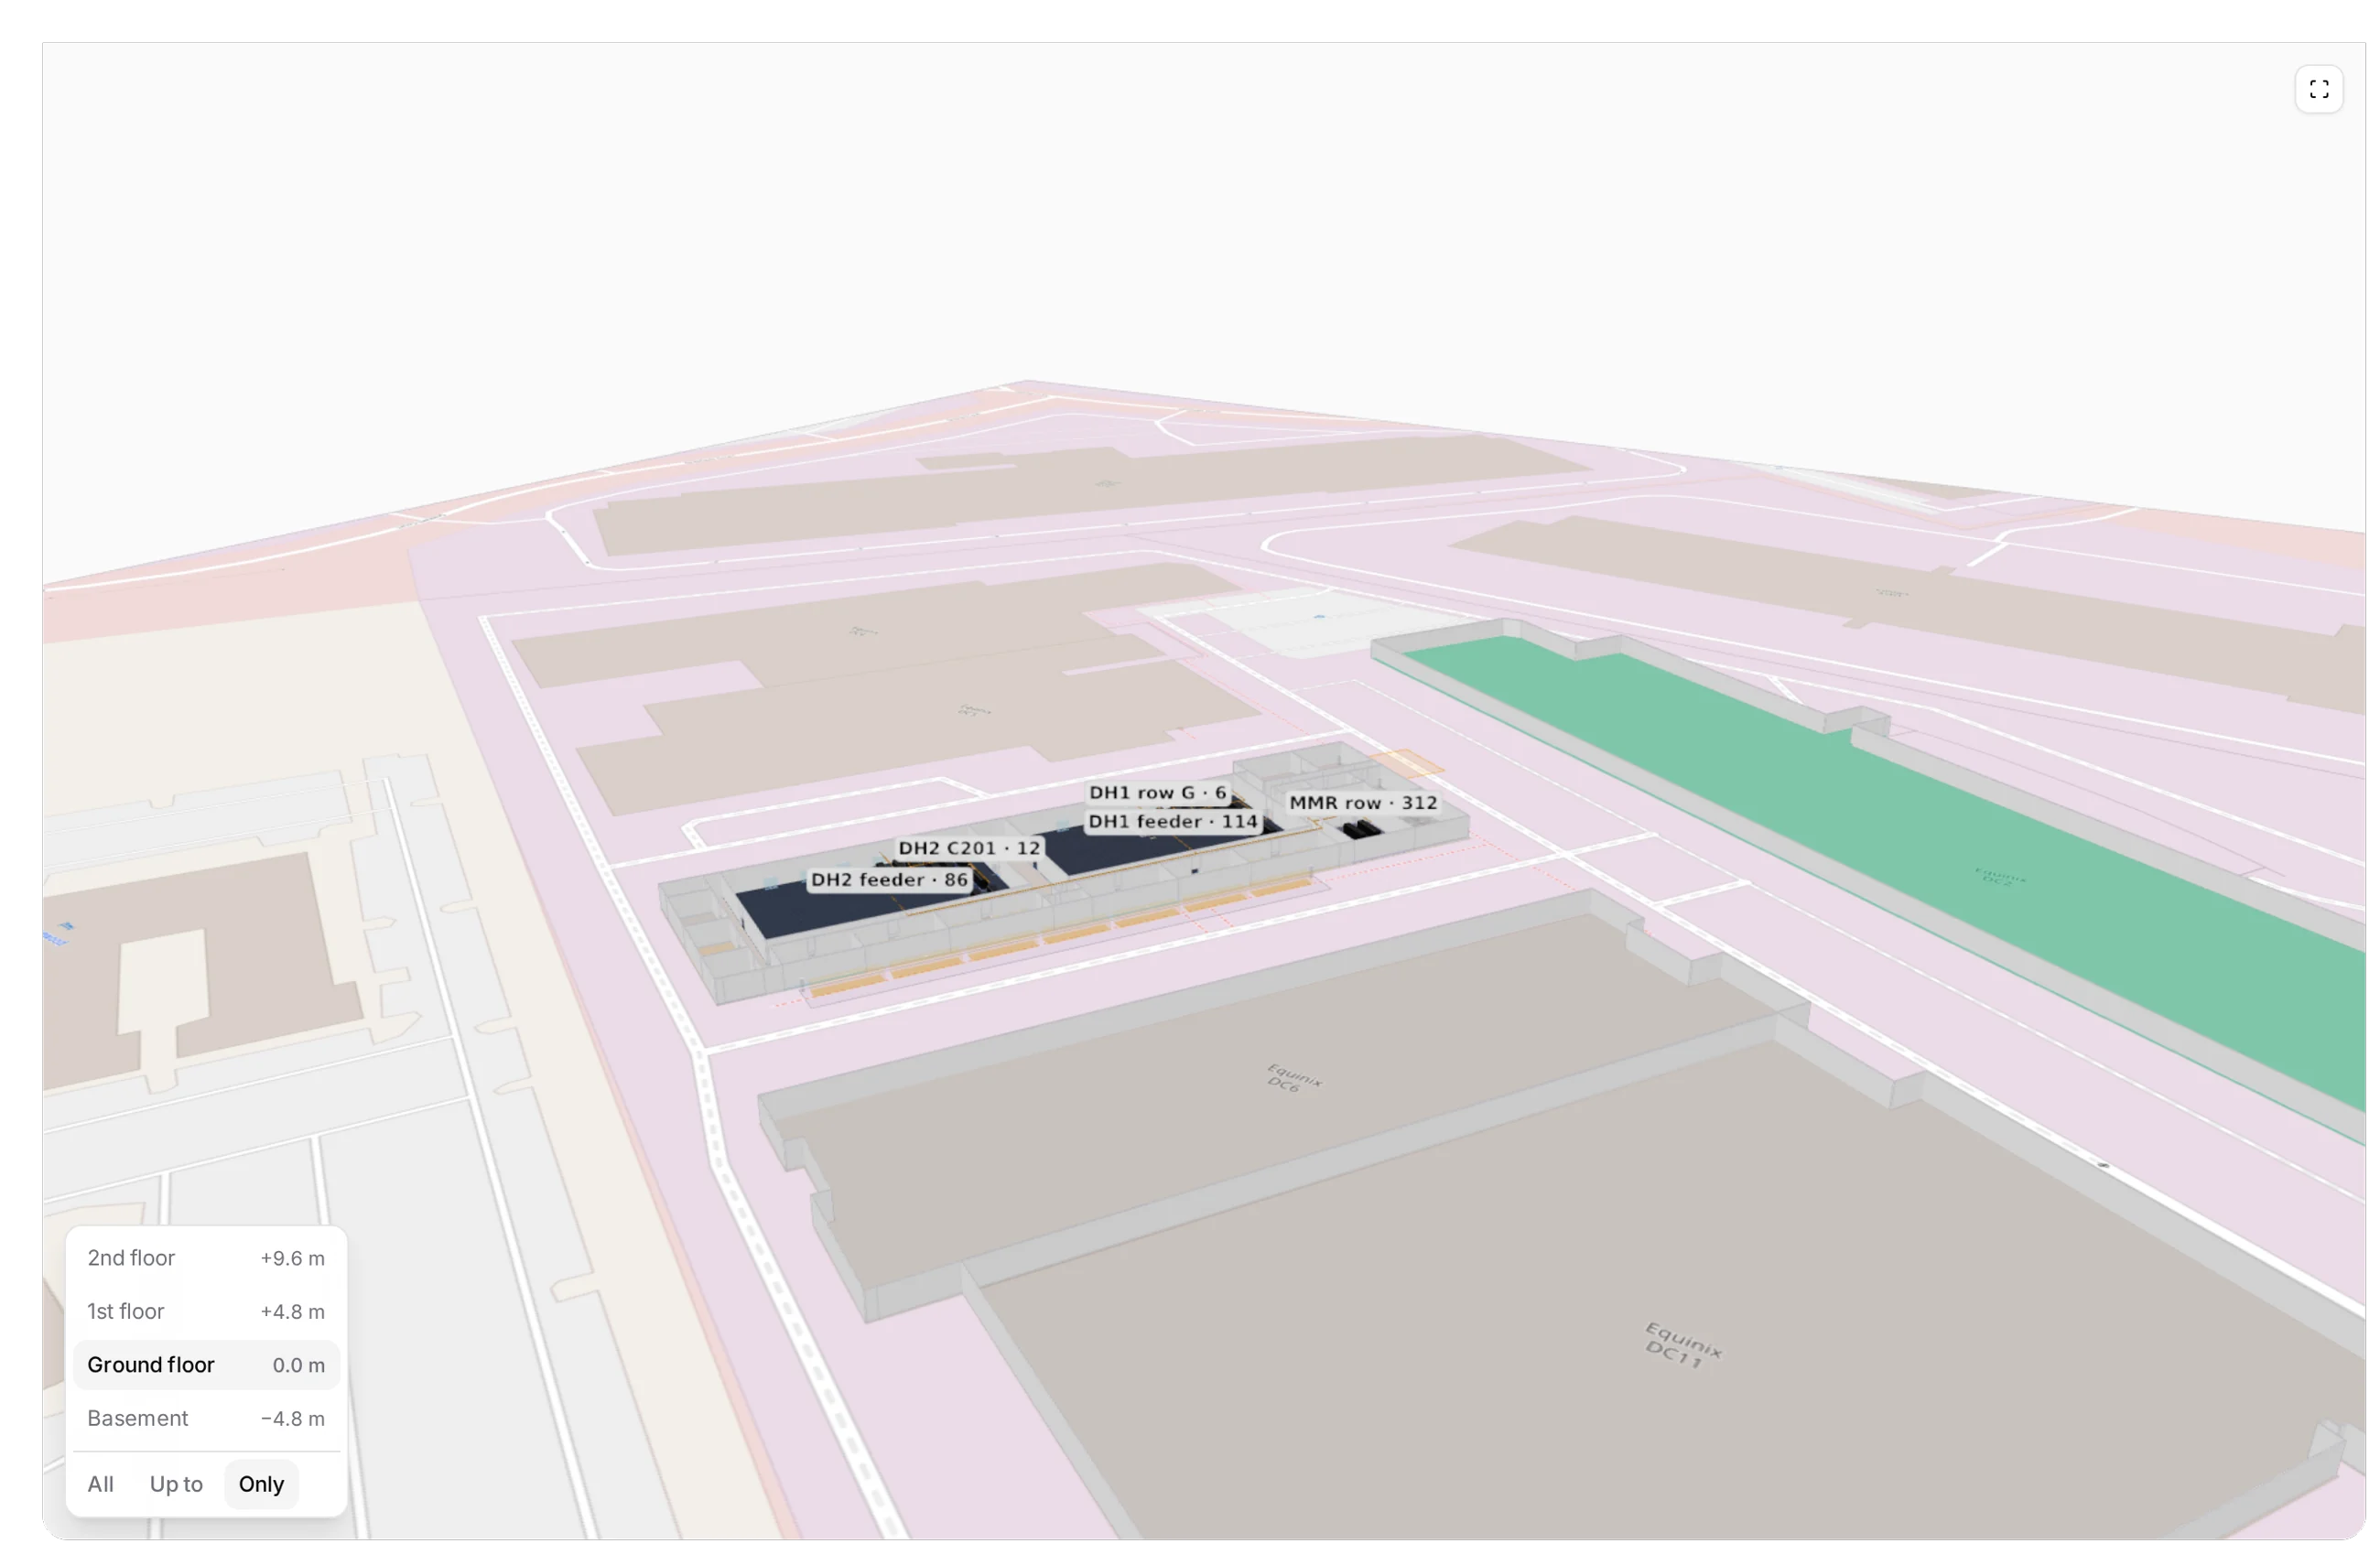
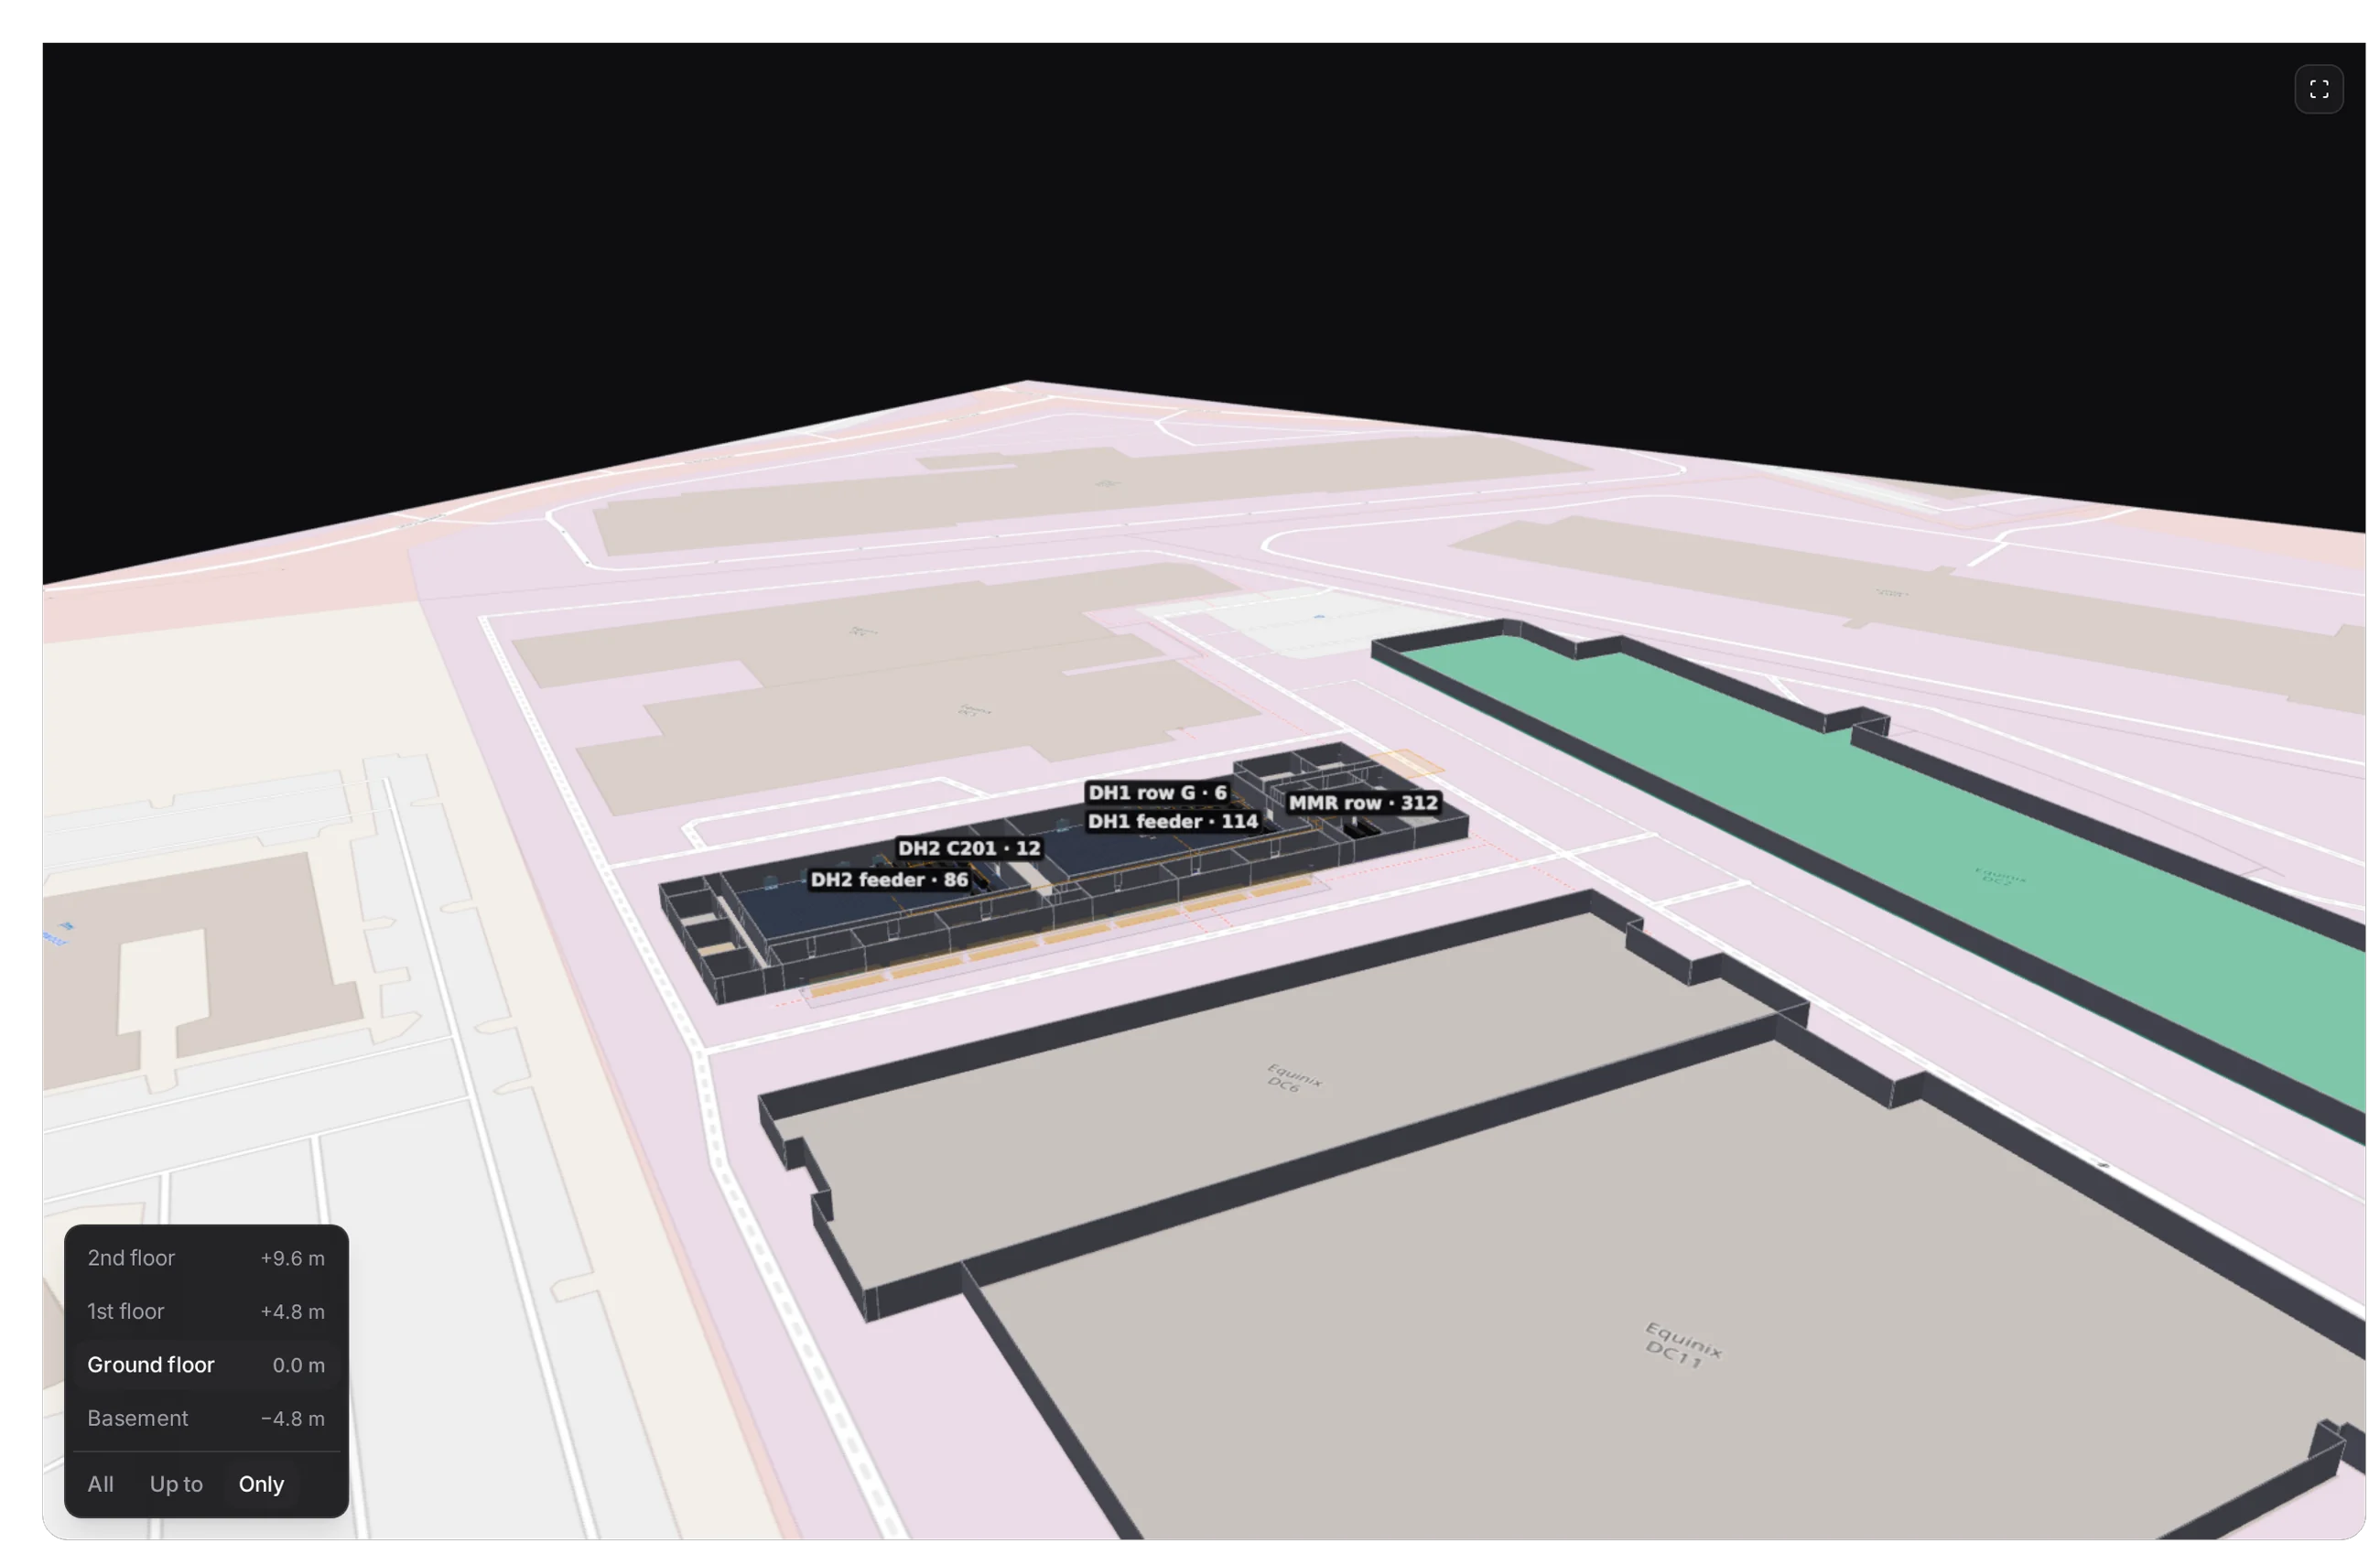
In 3D the level picker has three modes. All draws the whole building, the levels below simplified and the ones above ghosted. Up to stops at the level you picked. Only draws that level alone. The Explode slider under them pulls the levels apart, labels and all, so you can see what runs between them.
Four levels pulled apart with Explode, and what stands on each of them.
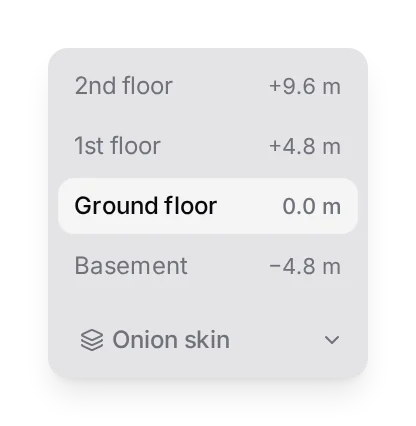
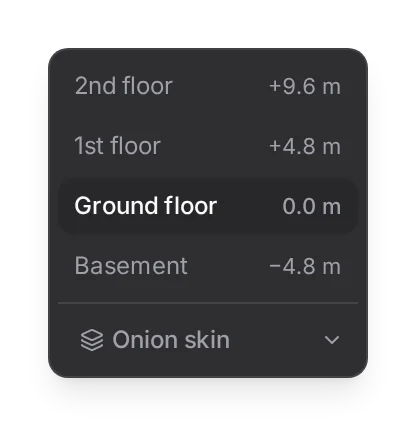
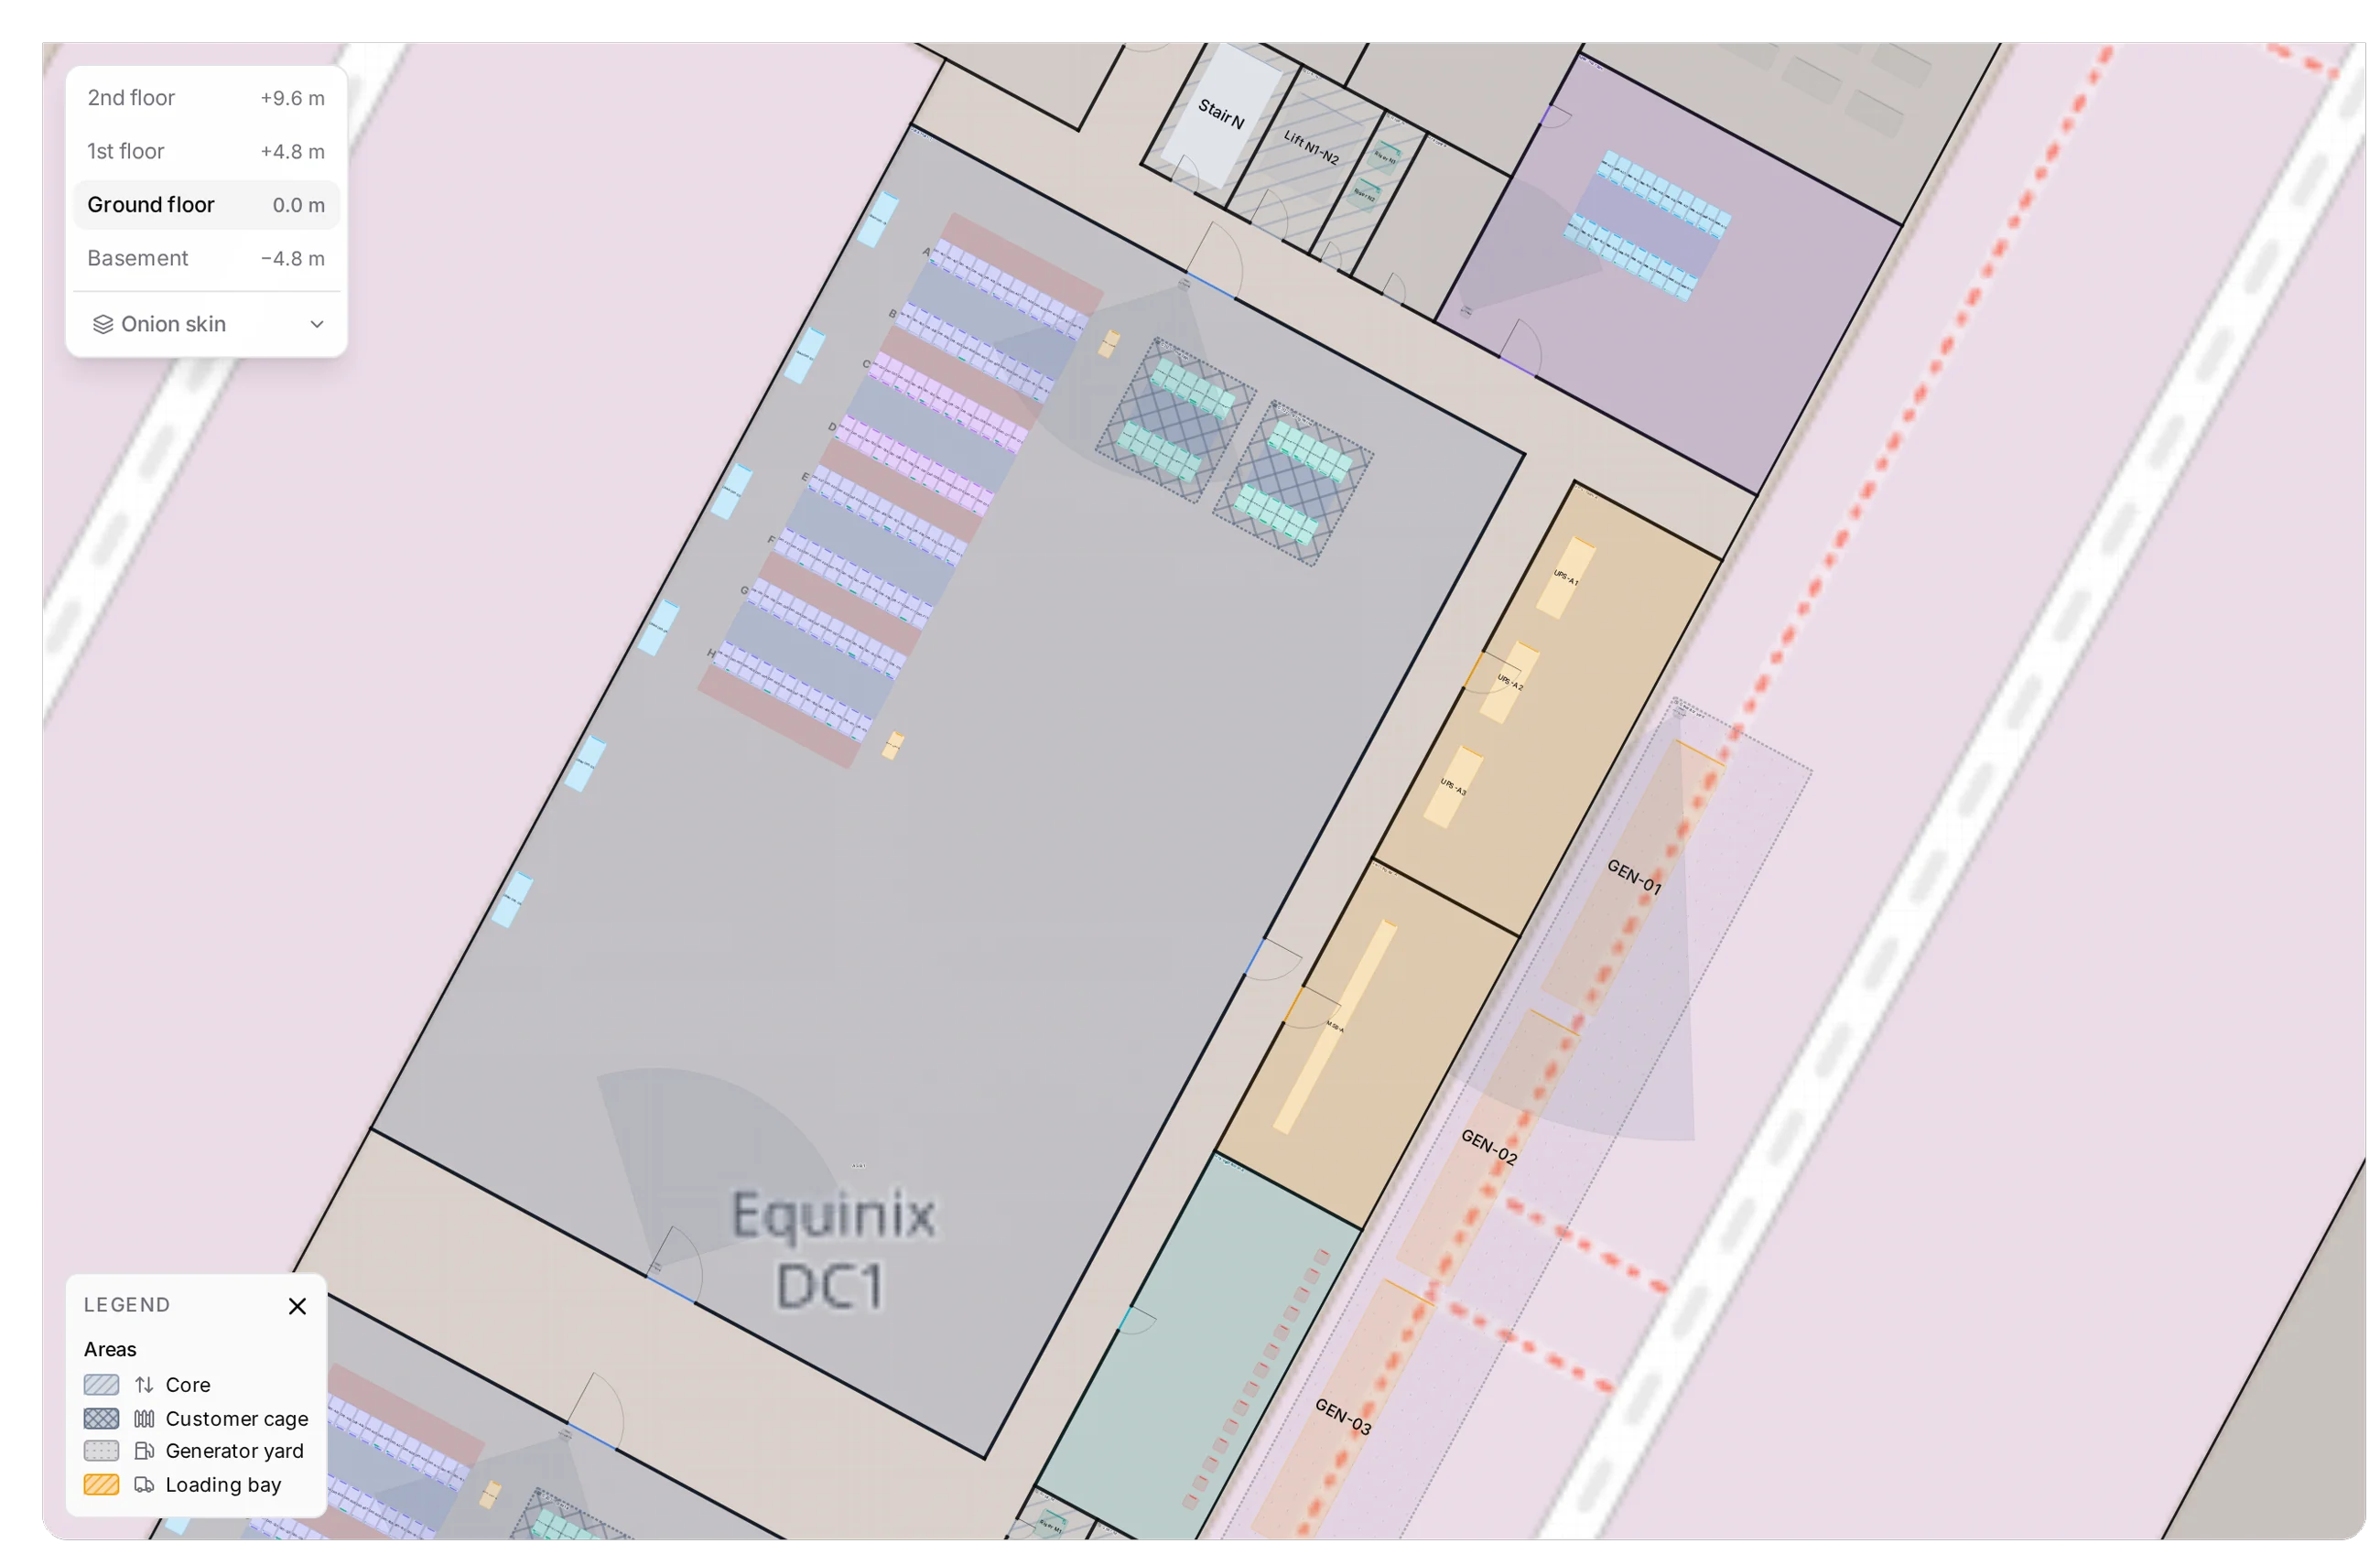
In 2D the picker carries Onion skin instead: off, the level below, or the level above. The ground floor with the basement faintly under it shows where a riser comes up.
A new editor
Every plan opens in View: a canvas to look at, click, search and export. With floorplan · change you also get View | Edit in the header. Press e to switch and esc to go back, and the choice is remembered in the browser. Without the permission the plan is View only, and the server refuses writes anyway.
In Edit a tool rail runs down the left of the canvas. It replaces the Layout, Structure and Cables tabs from 0.18: Select (v), Room or area (r), Polygon area (shift+r), Detect outline (o), Label (t), Tiles (g), Walls and raised floors (w), Door (d), Cable trays (c) and Snapshot (s). The bar above holds Find on plan…, Fit to view, Grid, Objects, Display and Export, and in Edit also Background, plan settings, Undo, Redo and Save. On a narrow window they fold into More instead of being cut off.
Free placement
At the foot of the tool rail is Free placement. On the grid, tiles sit on whole cells and turn in quarter turns. Switch the plan to free and a tile moves smoothly with the pointer, snapping to cell lines and to the edges of other tiles, areas and labels when it comes near them (hold alt for no snapping), and stops wherever you let go. Positions and sizes are kept to a thousandth of a cell, so a rack can stand at the angle it actually stands at.
The site under the plan
A plan can cover a whole site, with a base map under each floor's own drawing. A basement has it off unless you turn its Map eye on. Edit area sets the plan's frame on that map: pick Map or Satellite, drag the rectangle over the site, and the dialog says what you are about to get, here 1314 × 1084 cells · 788.4 × 650.4 m ≈ 0.23 m/px. Growing or shrinking the frame moves nothing that is already placed and applies to every aligned level at once. A trim that would cut something off is refused, and names what. Satellite maps keep their colour, and a plan can now be 2,048 cells a side.
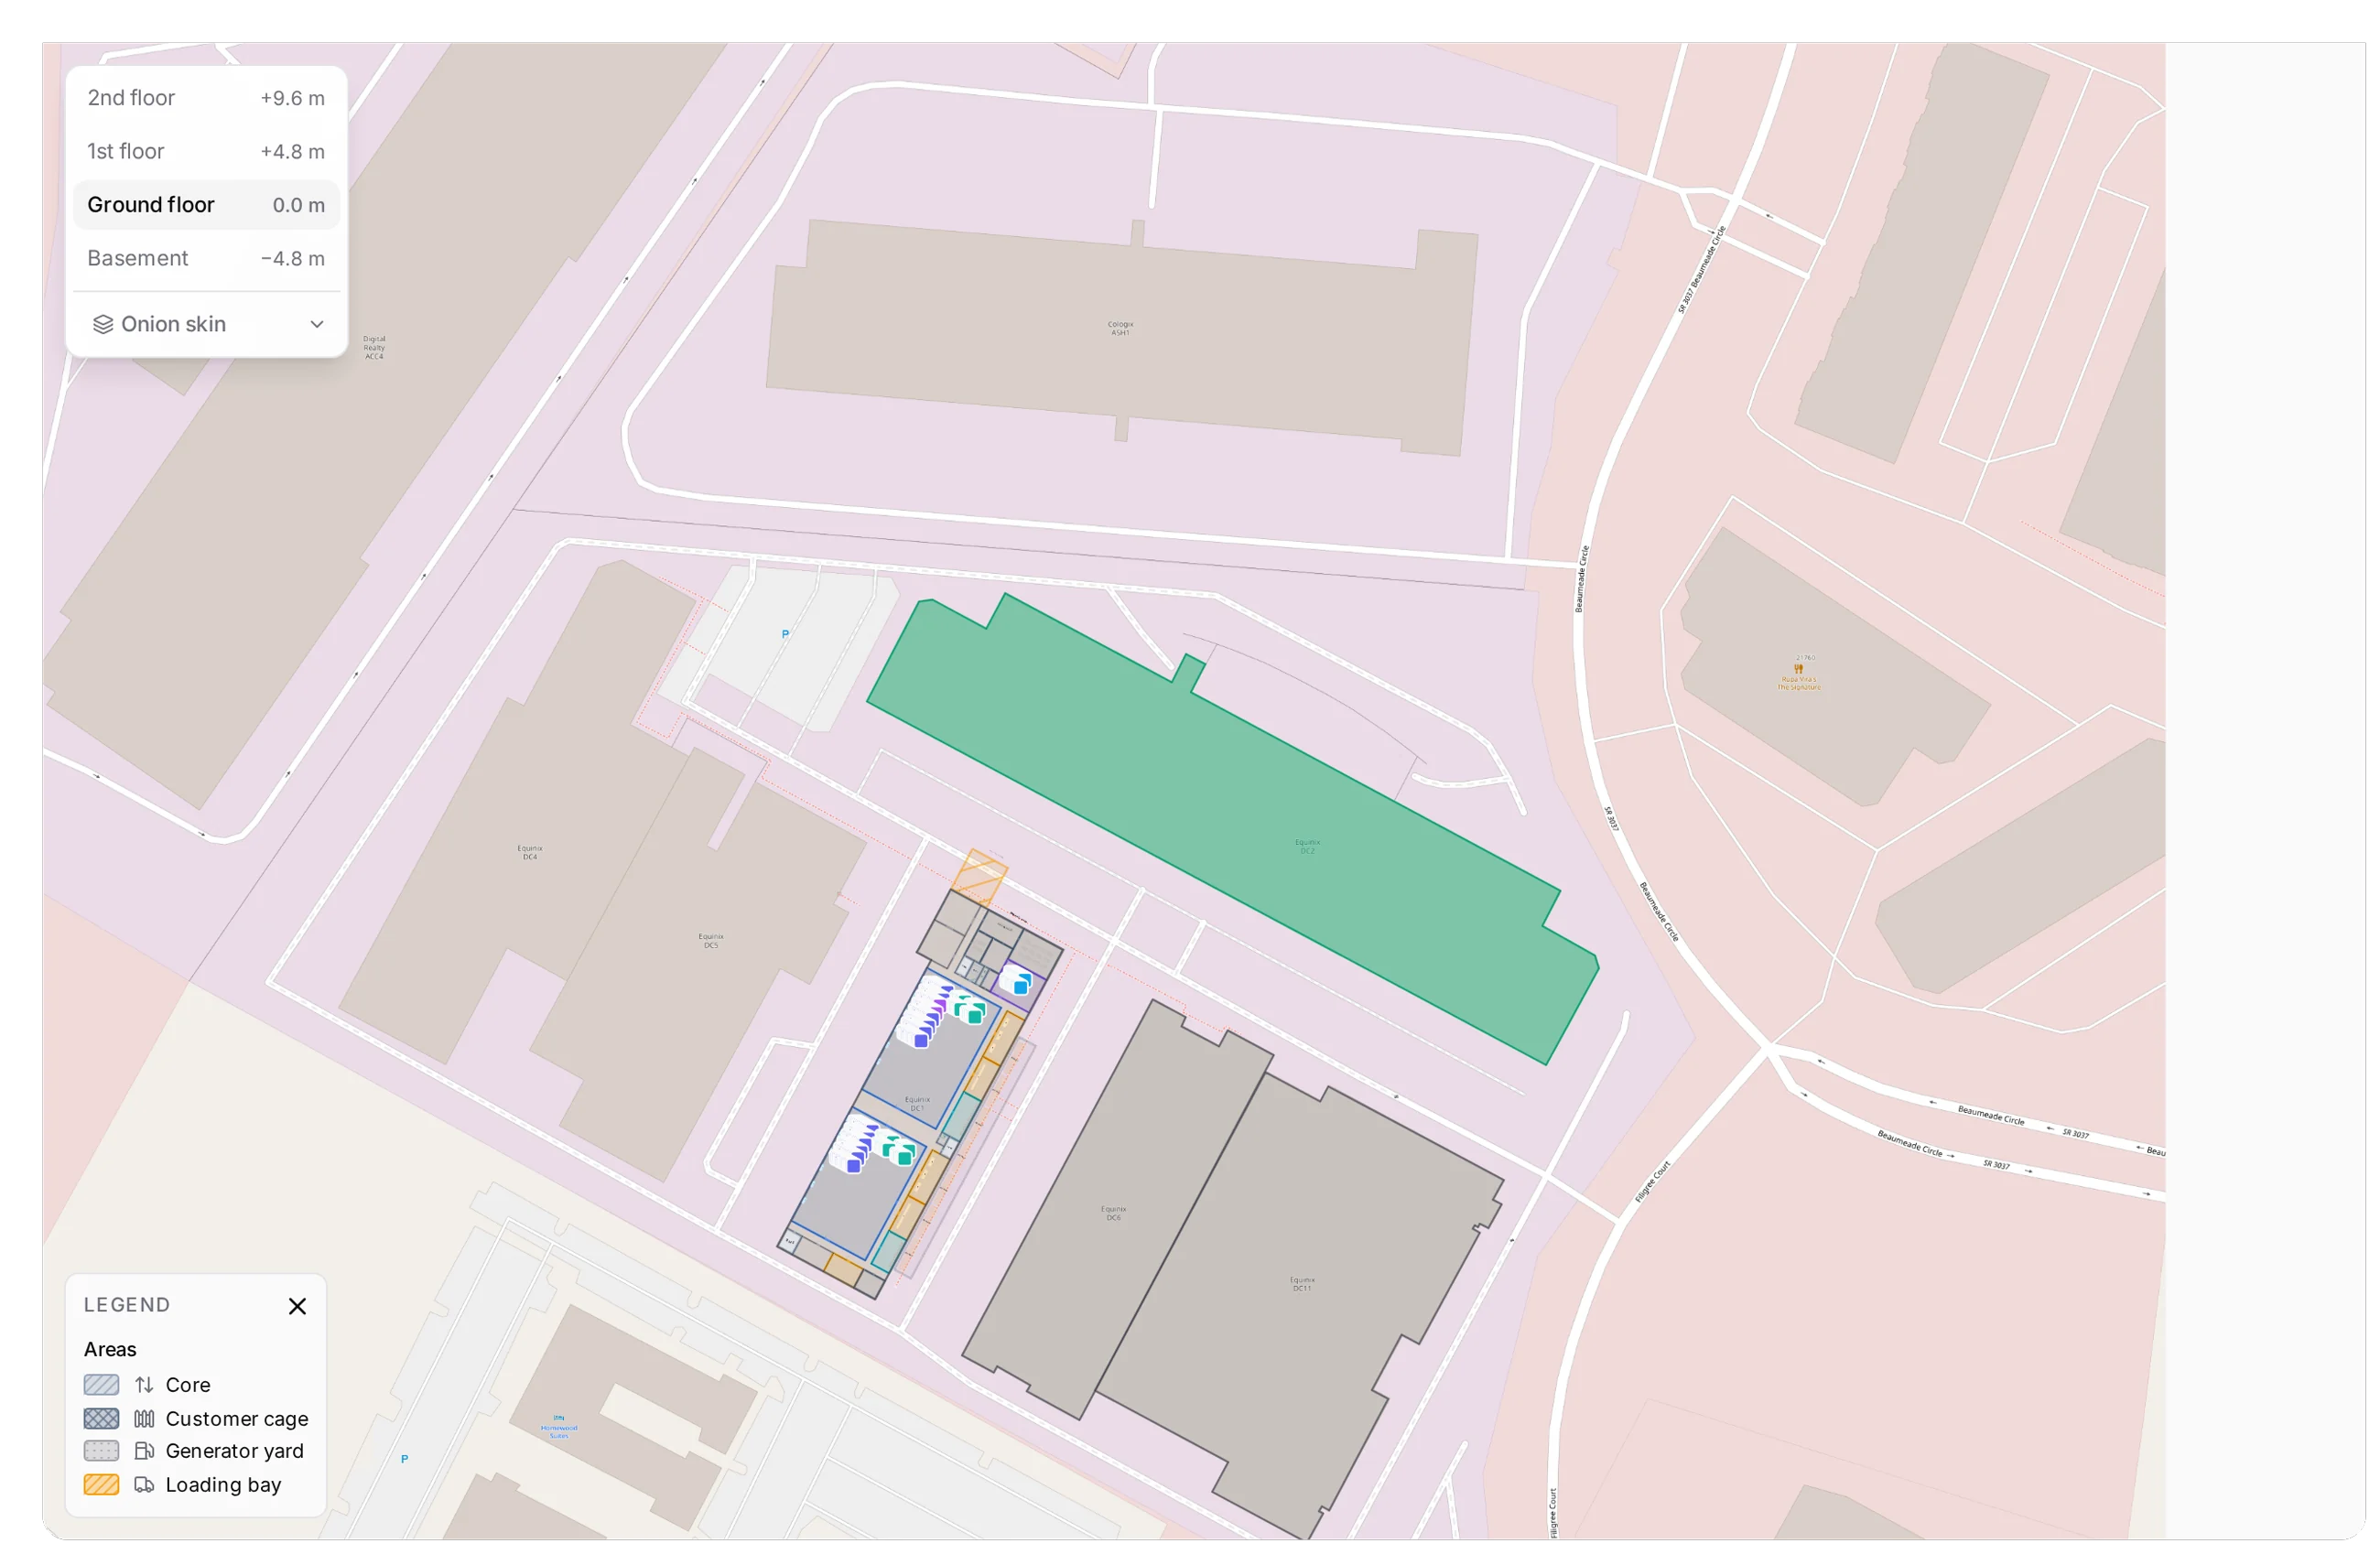
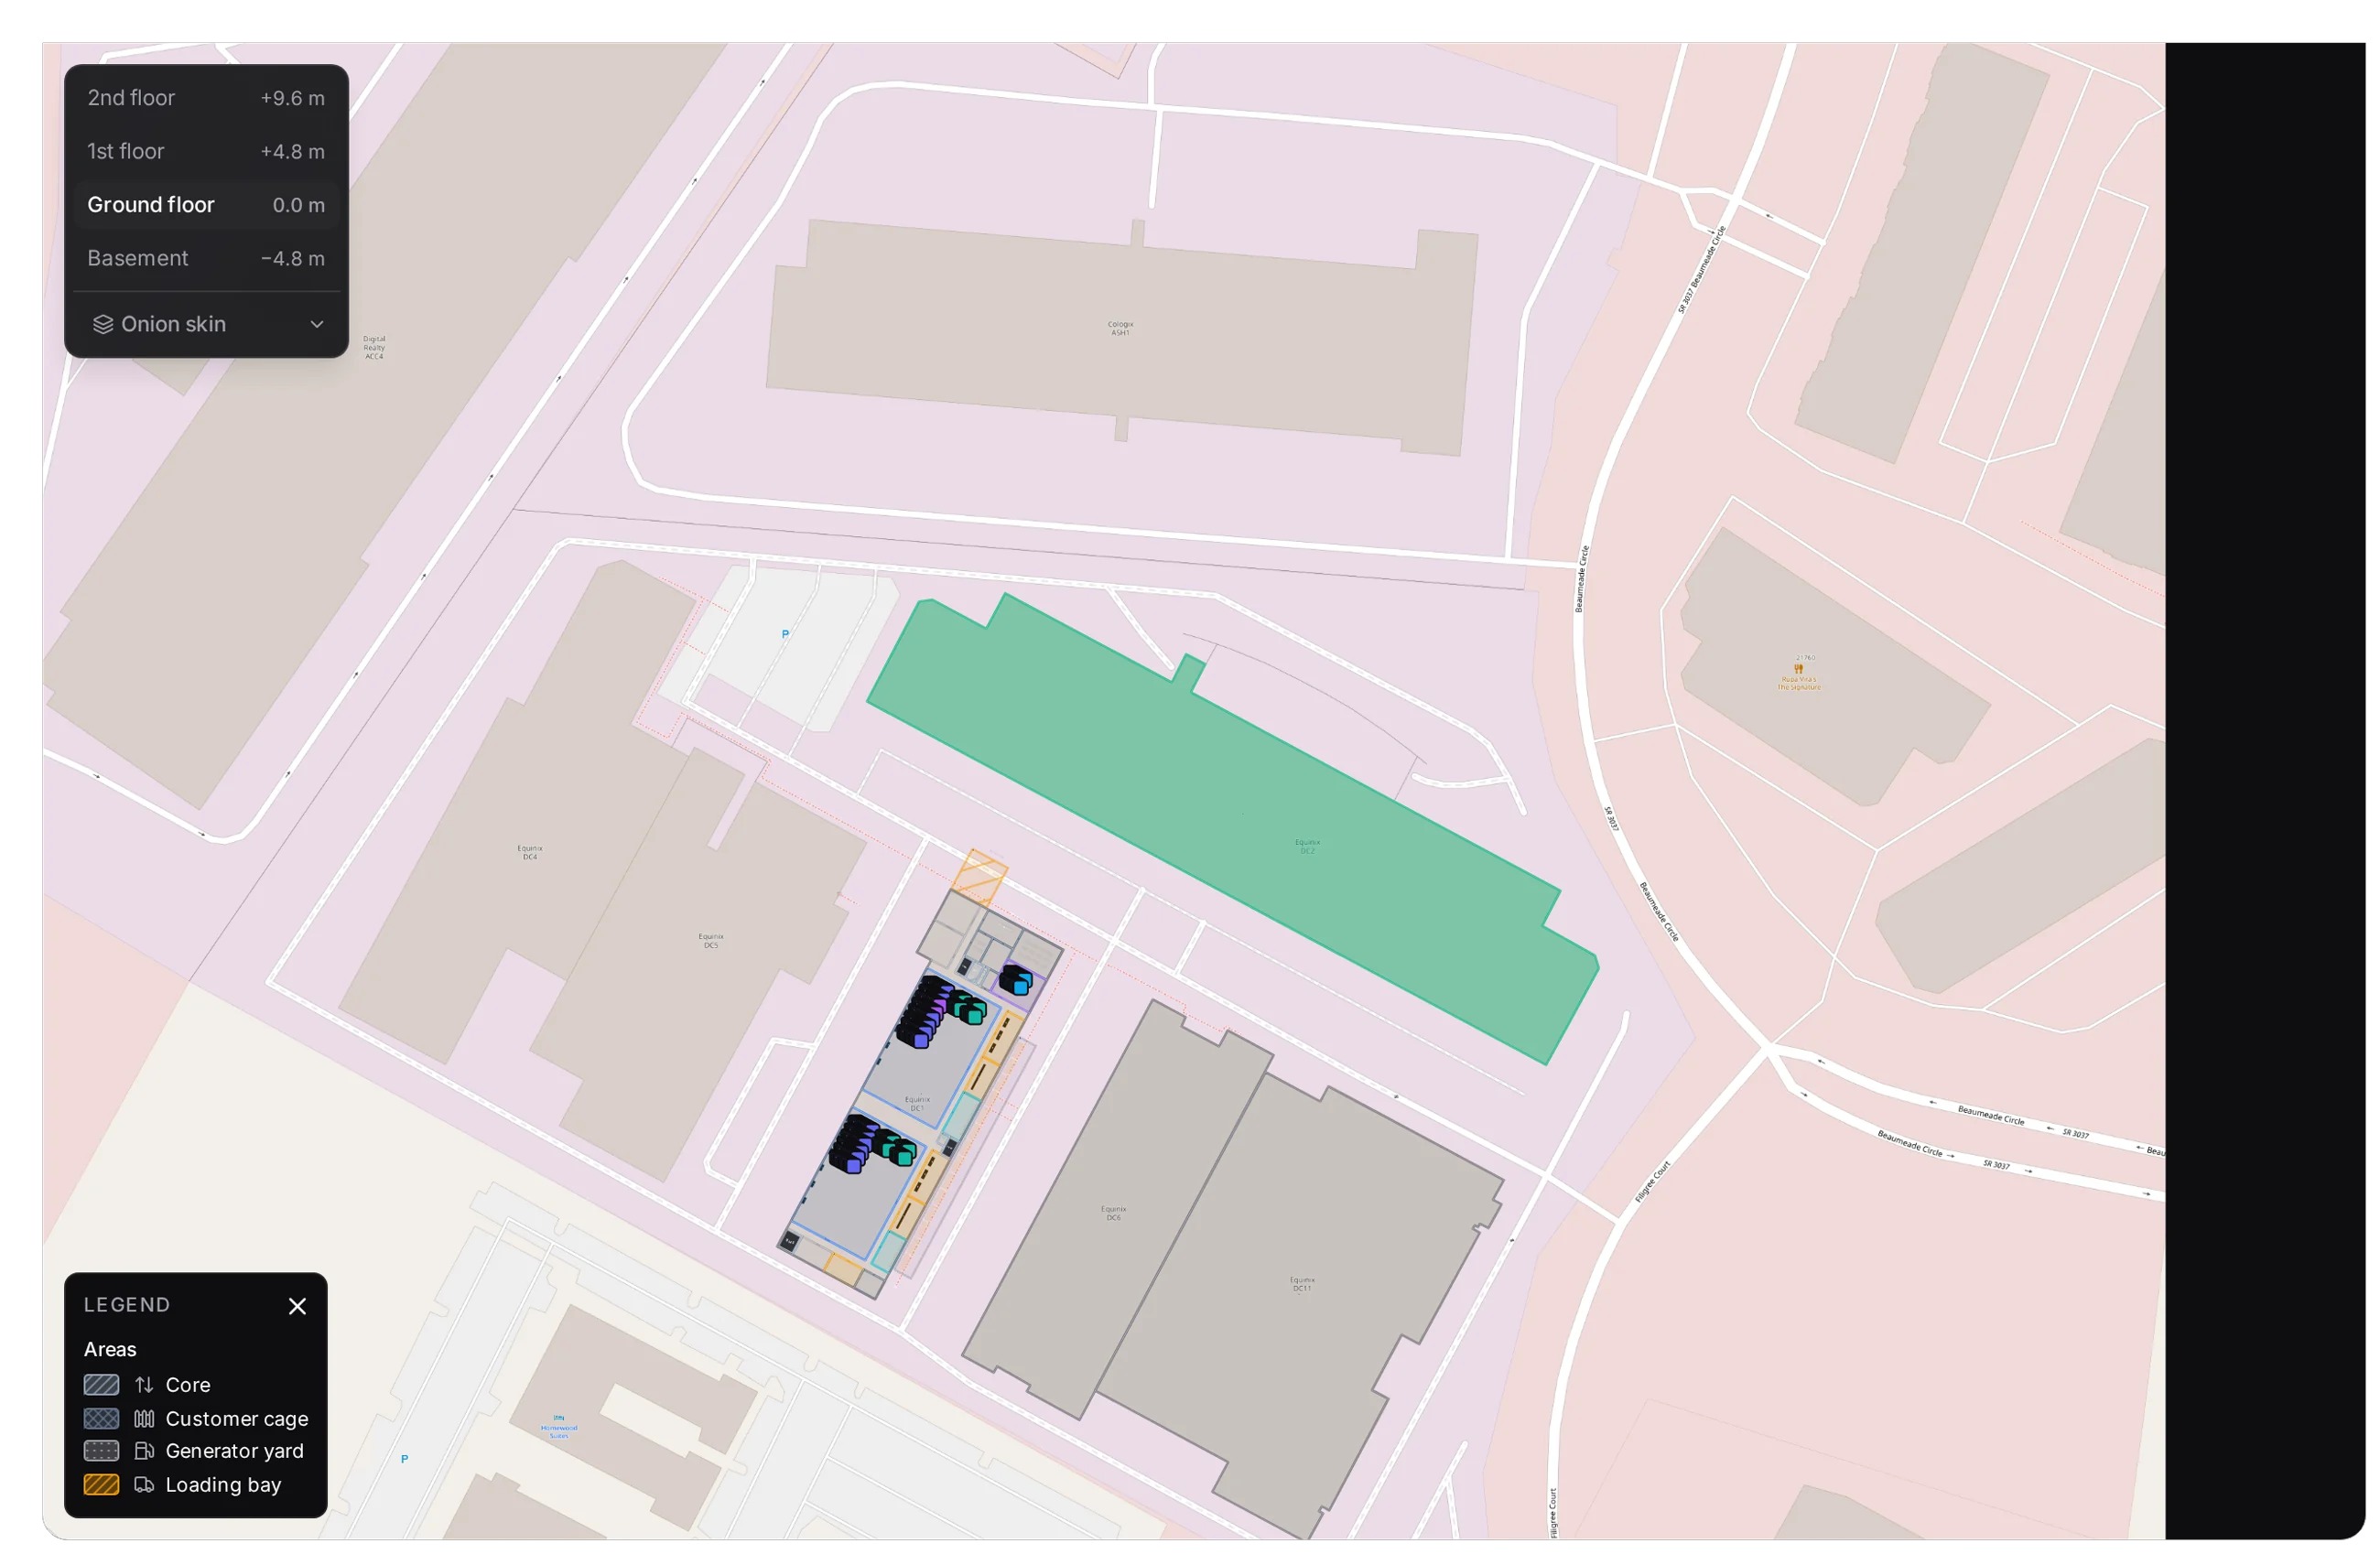
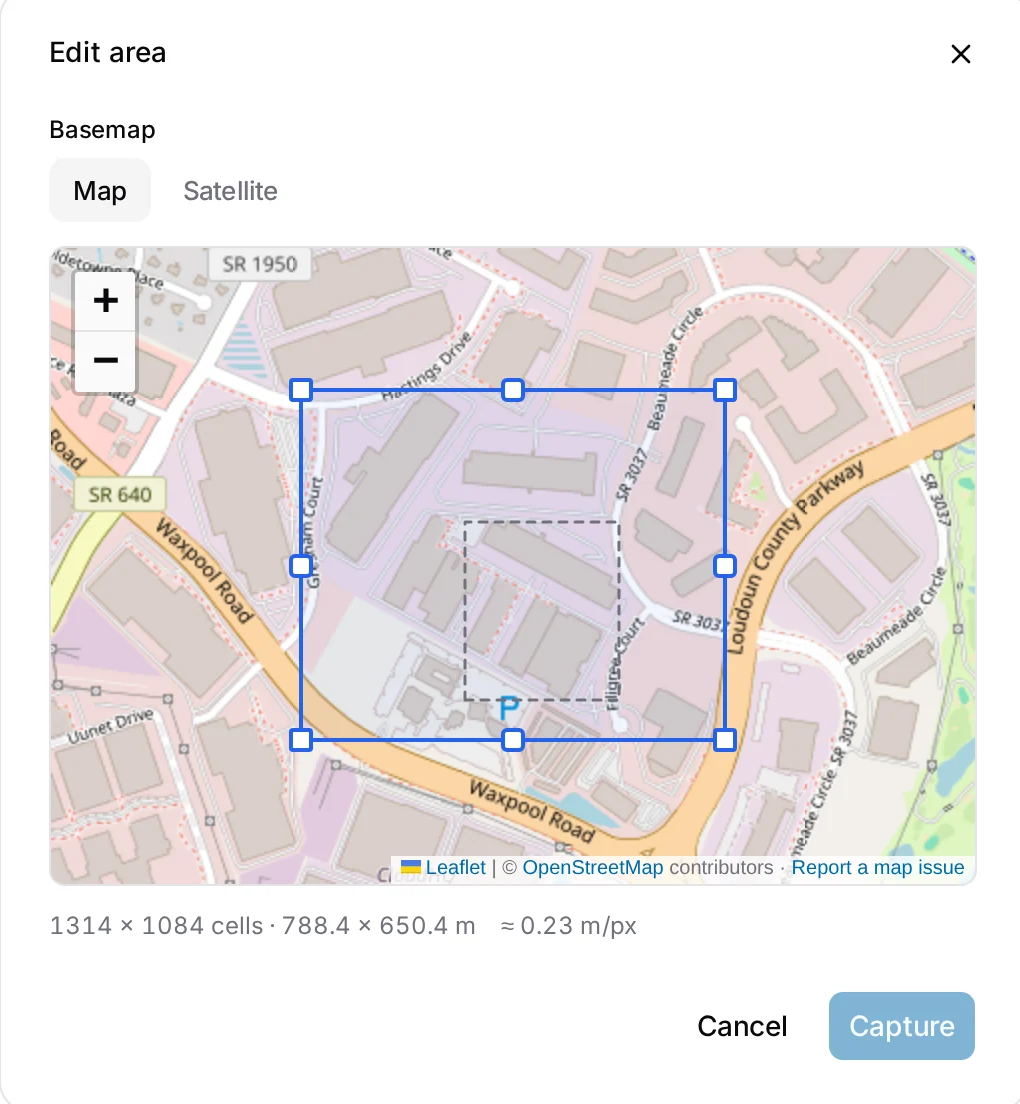
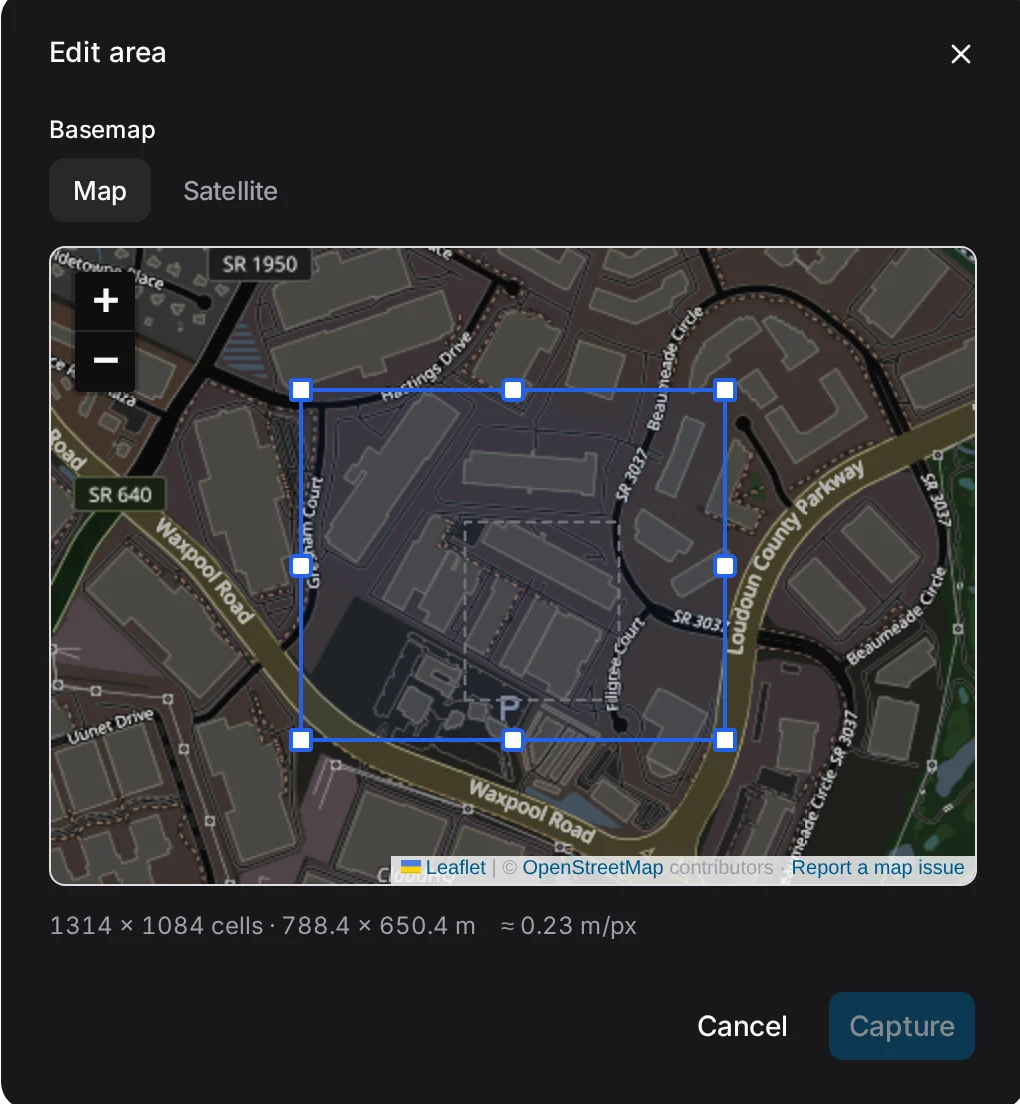
A plan made from the Site map keeps a footprint there: one outline for an aligned building, named after it, listing its levels and opening on the ground floor.
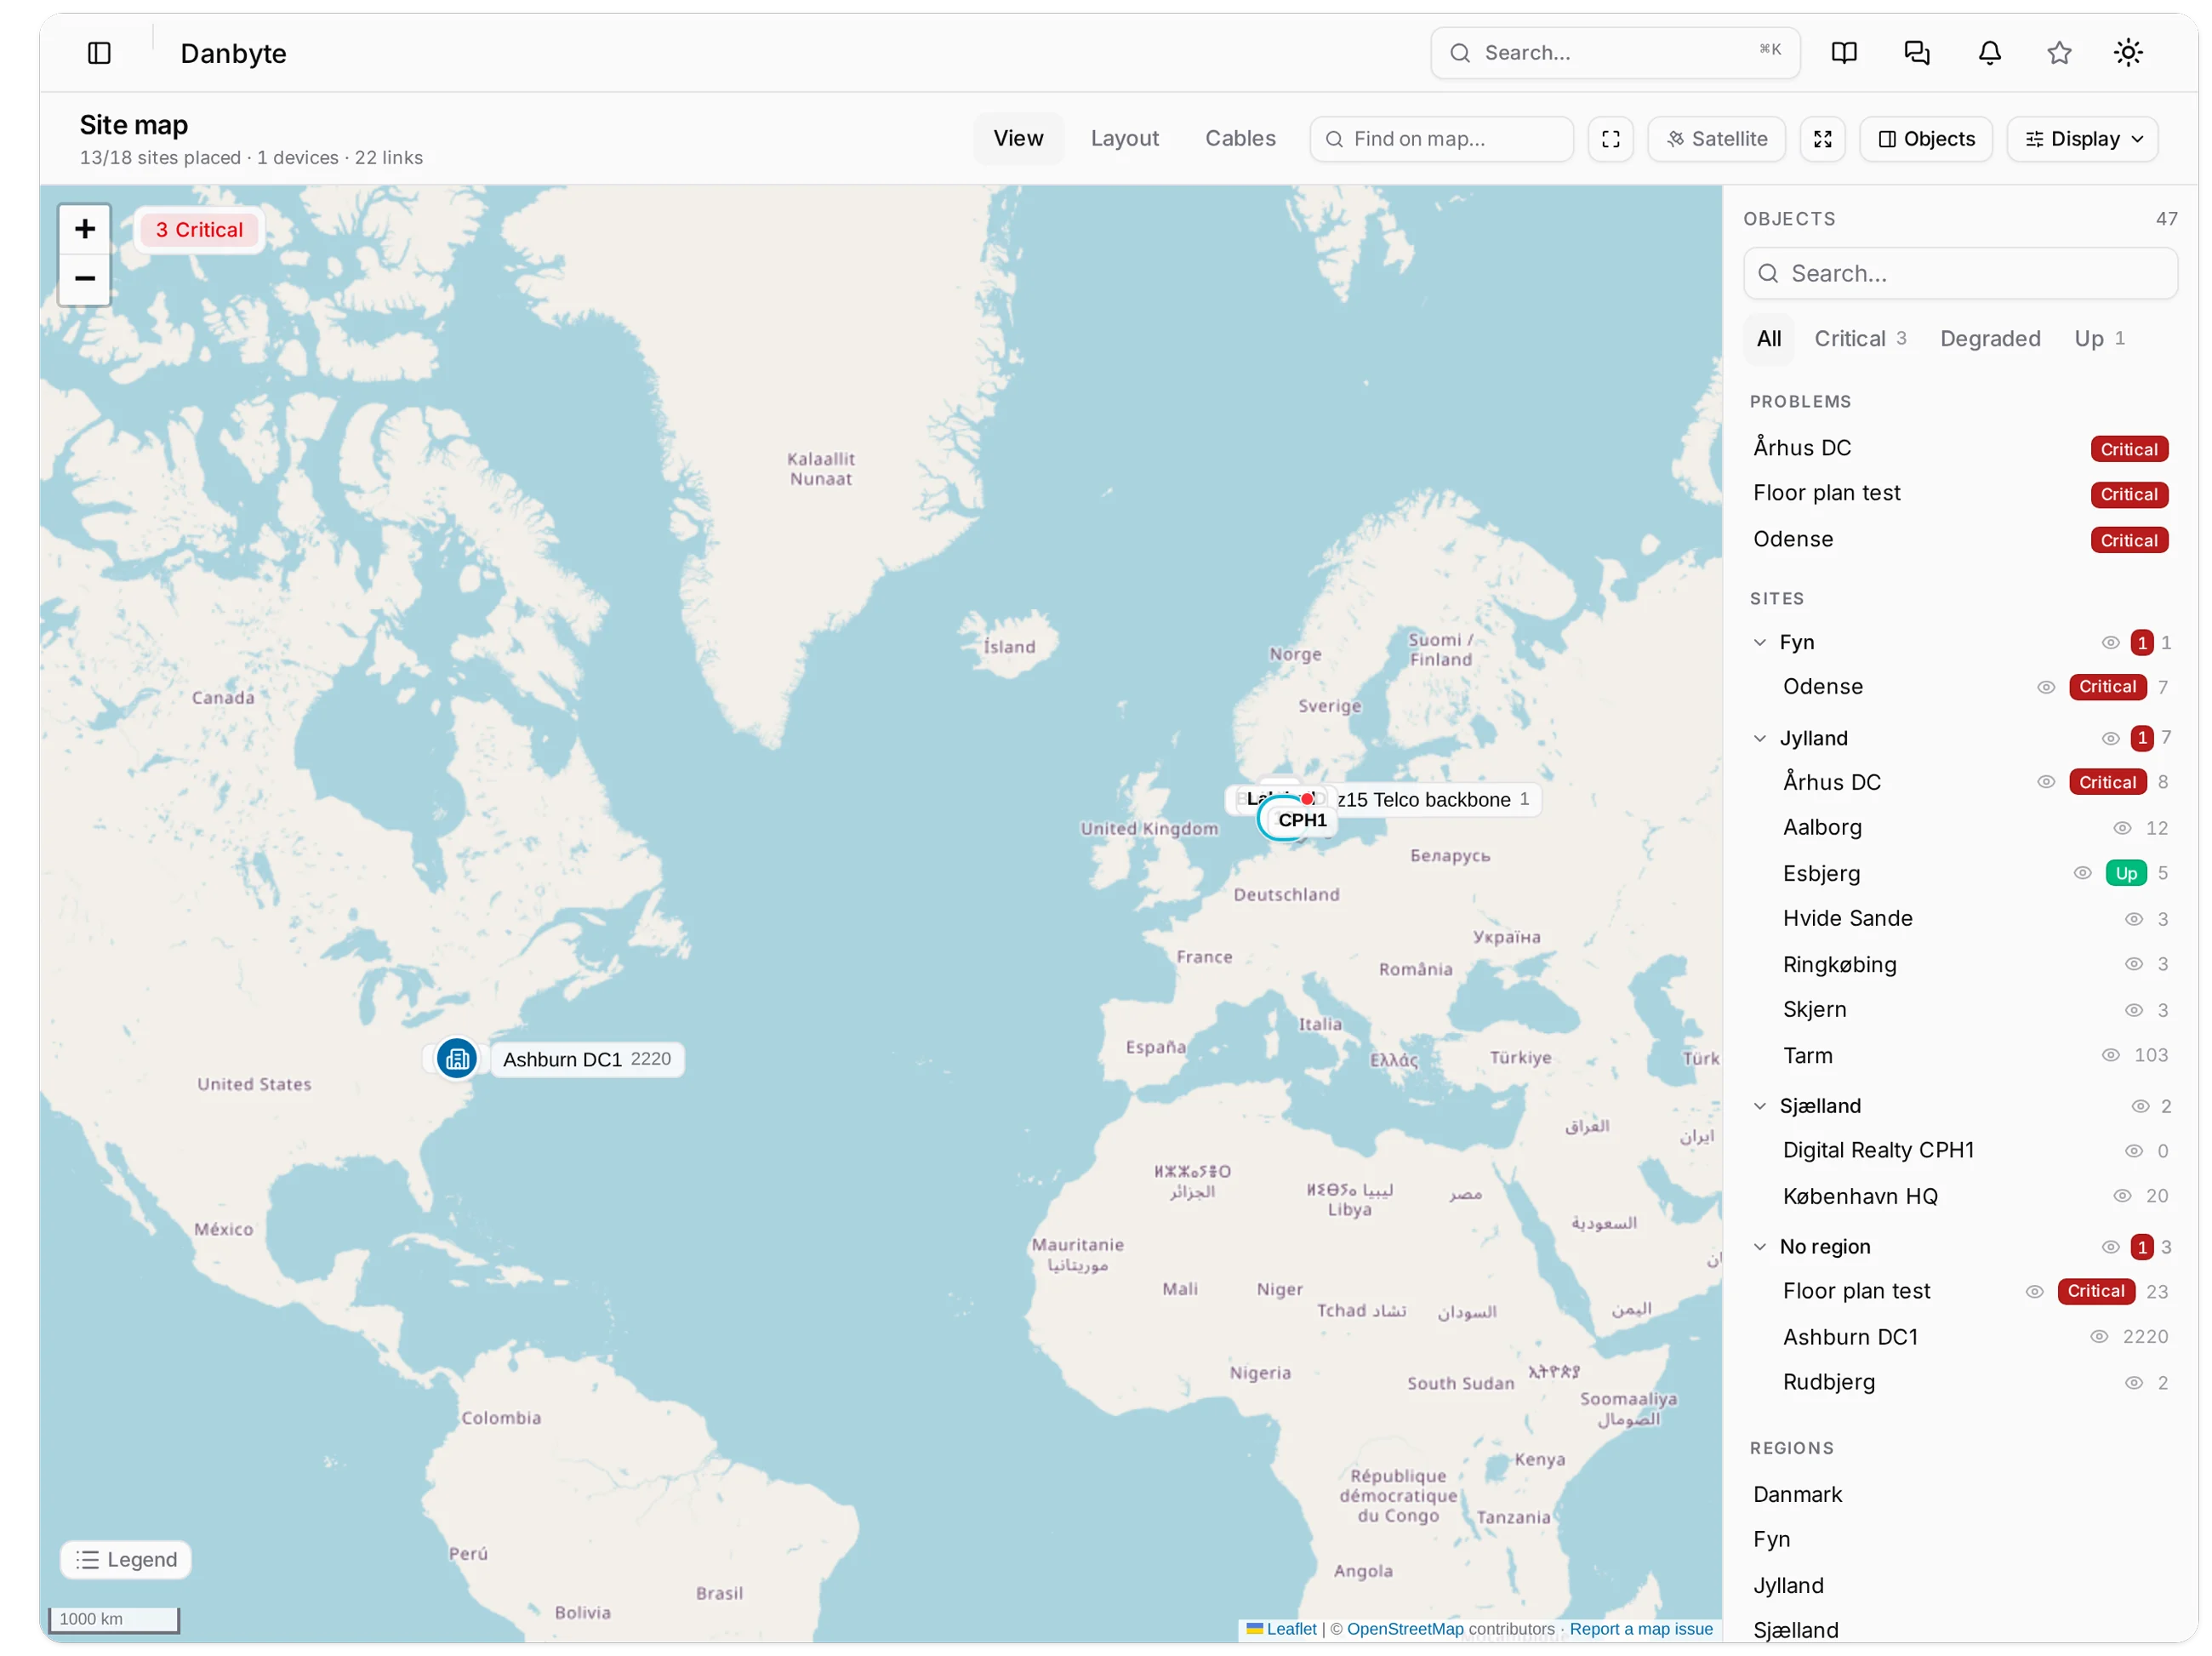
 Ashburn DC1 on the site map, with the problem list and the site tree beside it.
Drawing the building
Areas, labels, walls, doors, trays and raised floors are drawn on the plan. Walls around an area stay linked to it both ways: edit a wall and the area is redrawn in the same undo step, reshape the area and its walls are rebuilt. Detect outline traces walls from the map, a picture or a CAD drawing. Raised floors are polygons, drawn with the polygon tool or made from an area, and touching raised floors of the same depth and colour draw as one pad in 2D, 3D and export.
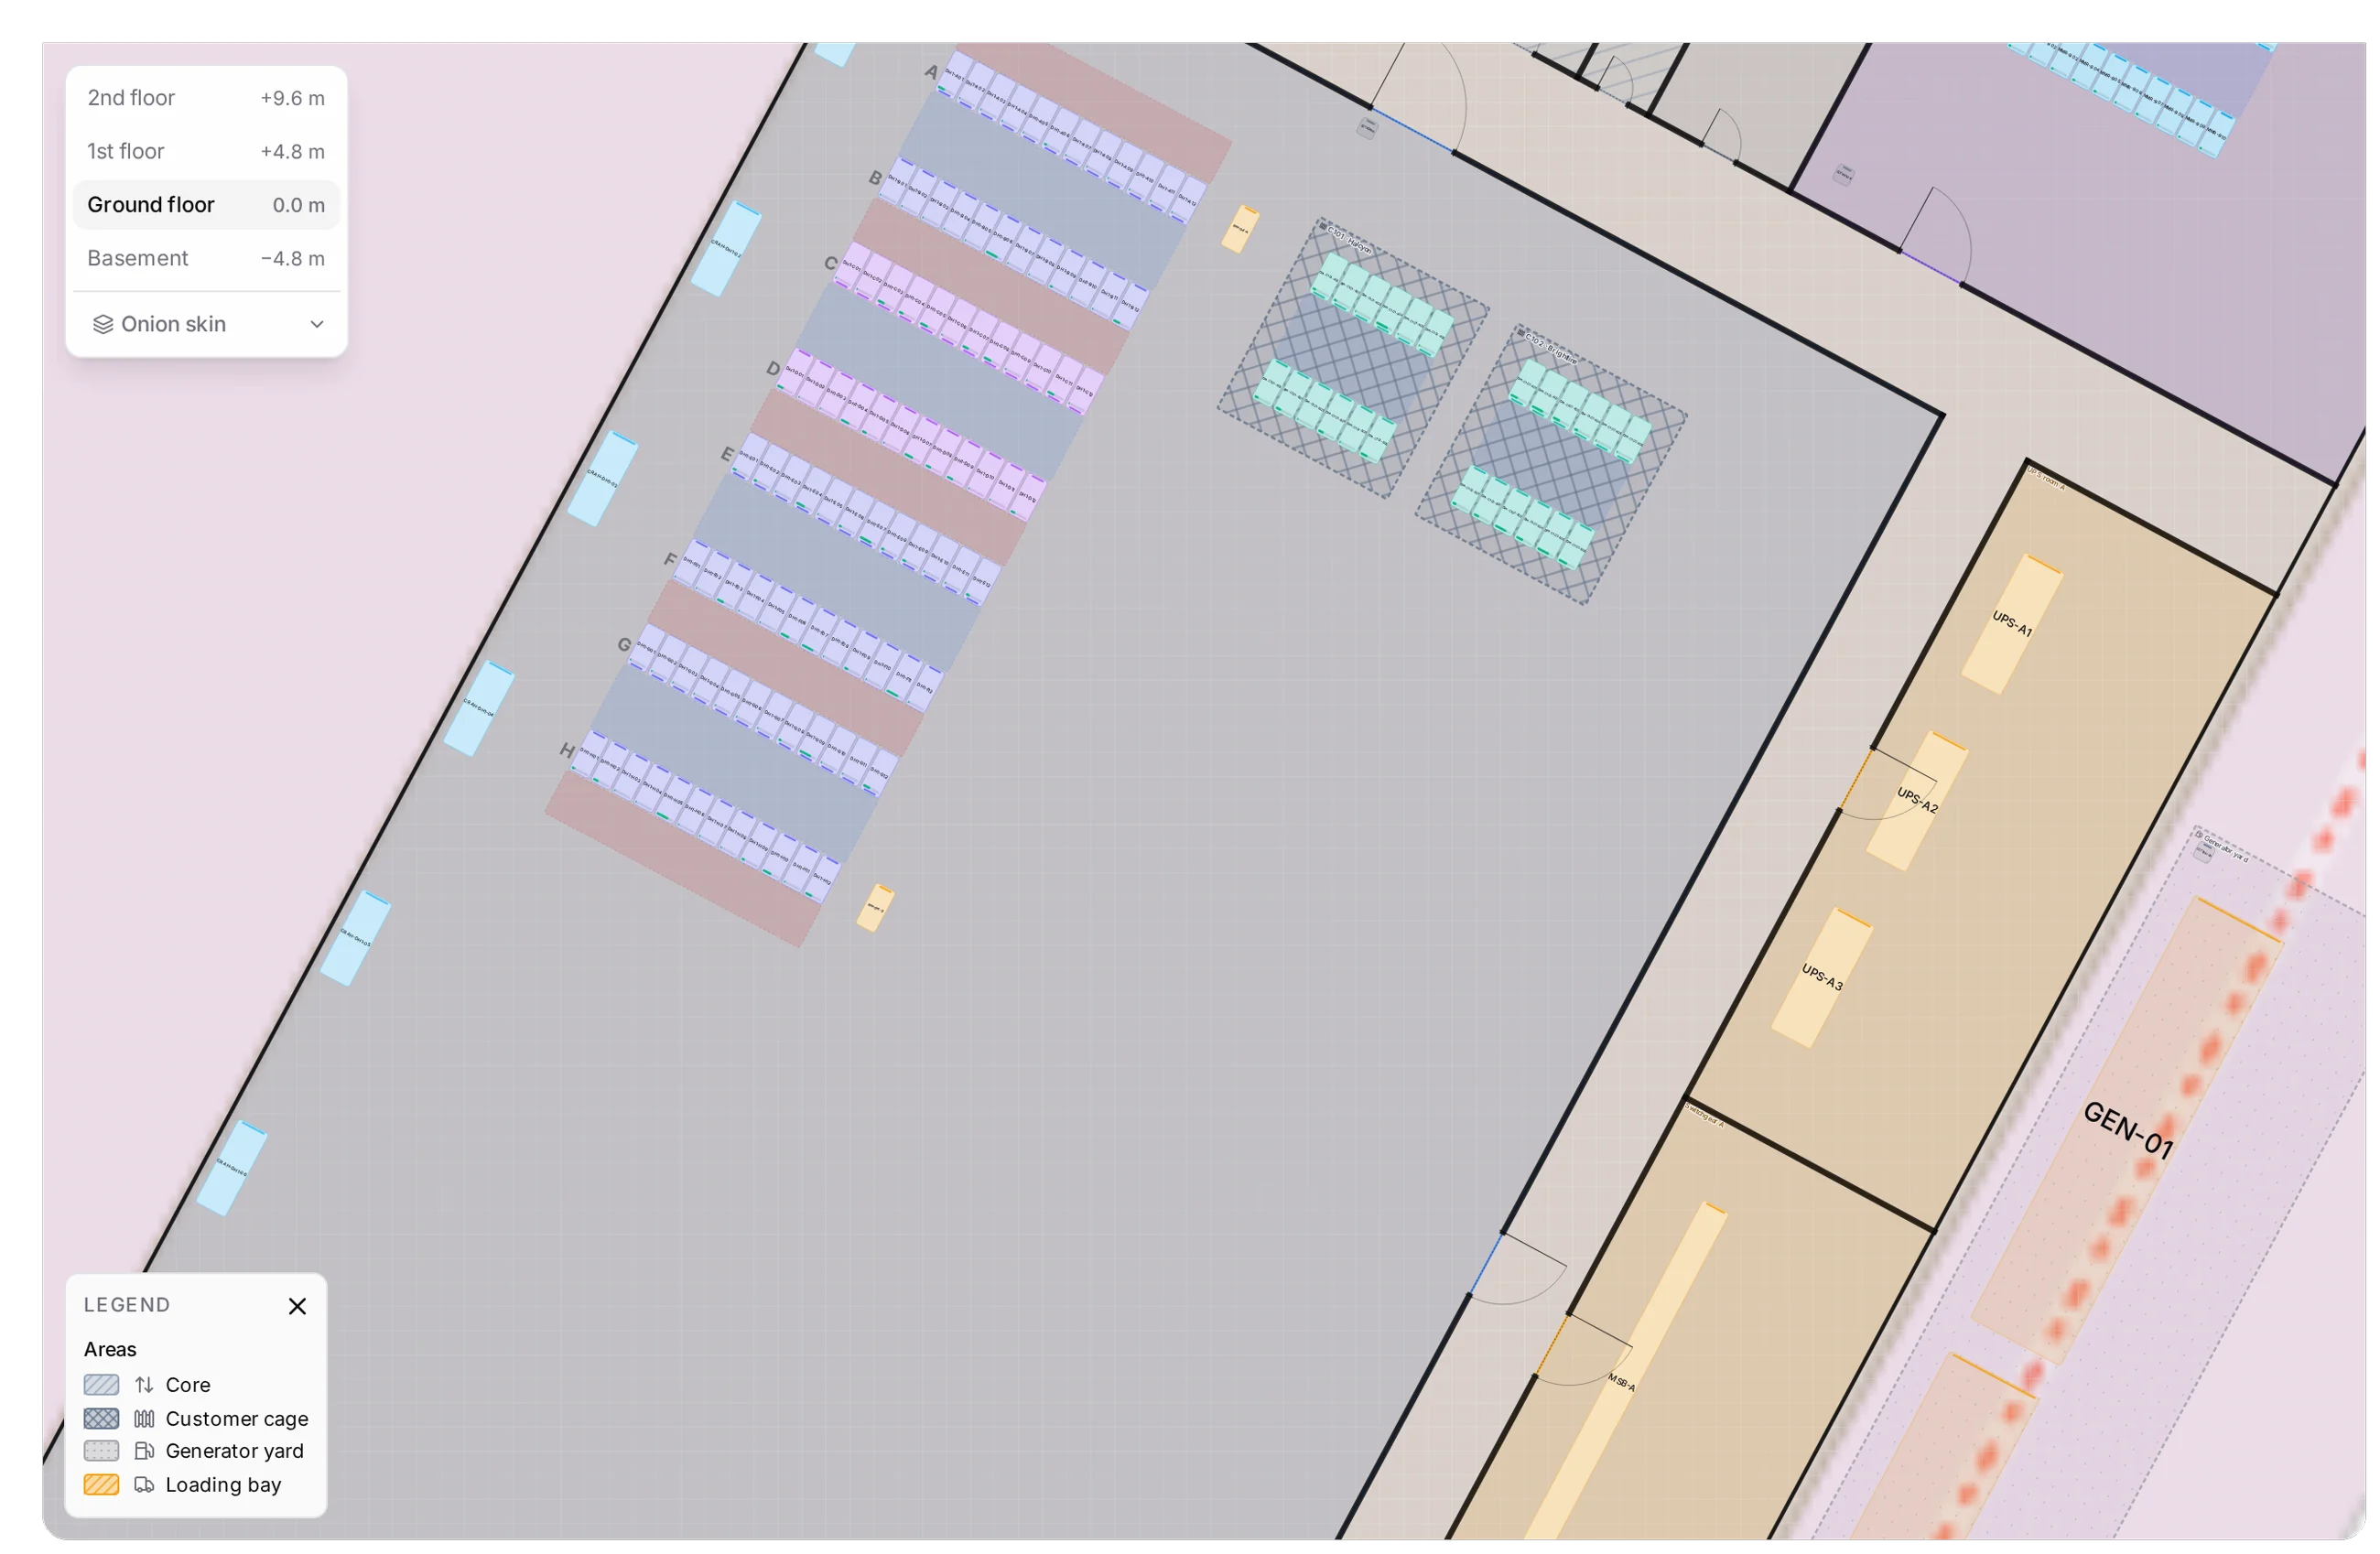
 Rows A to H, two cages, the UPS rooms and GEN-01 along the east wall.
Objects are placed from a picker that checks the room and shows photos, and devices are drawn at the size their type measures. Cable routes have computed lengths, follow the tenant's length rules, run along trays, re-route when tiles or trays move, and are drawn in lanes and bundles. Connect to plans a new cable between two placed objects. Risers carry cables between floors, pair themselves on aligned levels, and a cable between levels is drawn in 3D as one run through the shaft.
A crowded plan stays readable. A row of racks is named once along it, as Row B · B01–B12, and drawn as one bar when you zoom out. Rooms fold into a summary further out and infrastructure is summed per wall. Names that do not fit go to callouts with short leaders, or to one summary plate such as RACK-01–RACK-07, which lists what is under it on hover. In 3D the plate offers Zoom to these; in 2D a click zooms in.
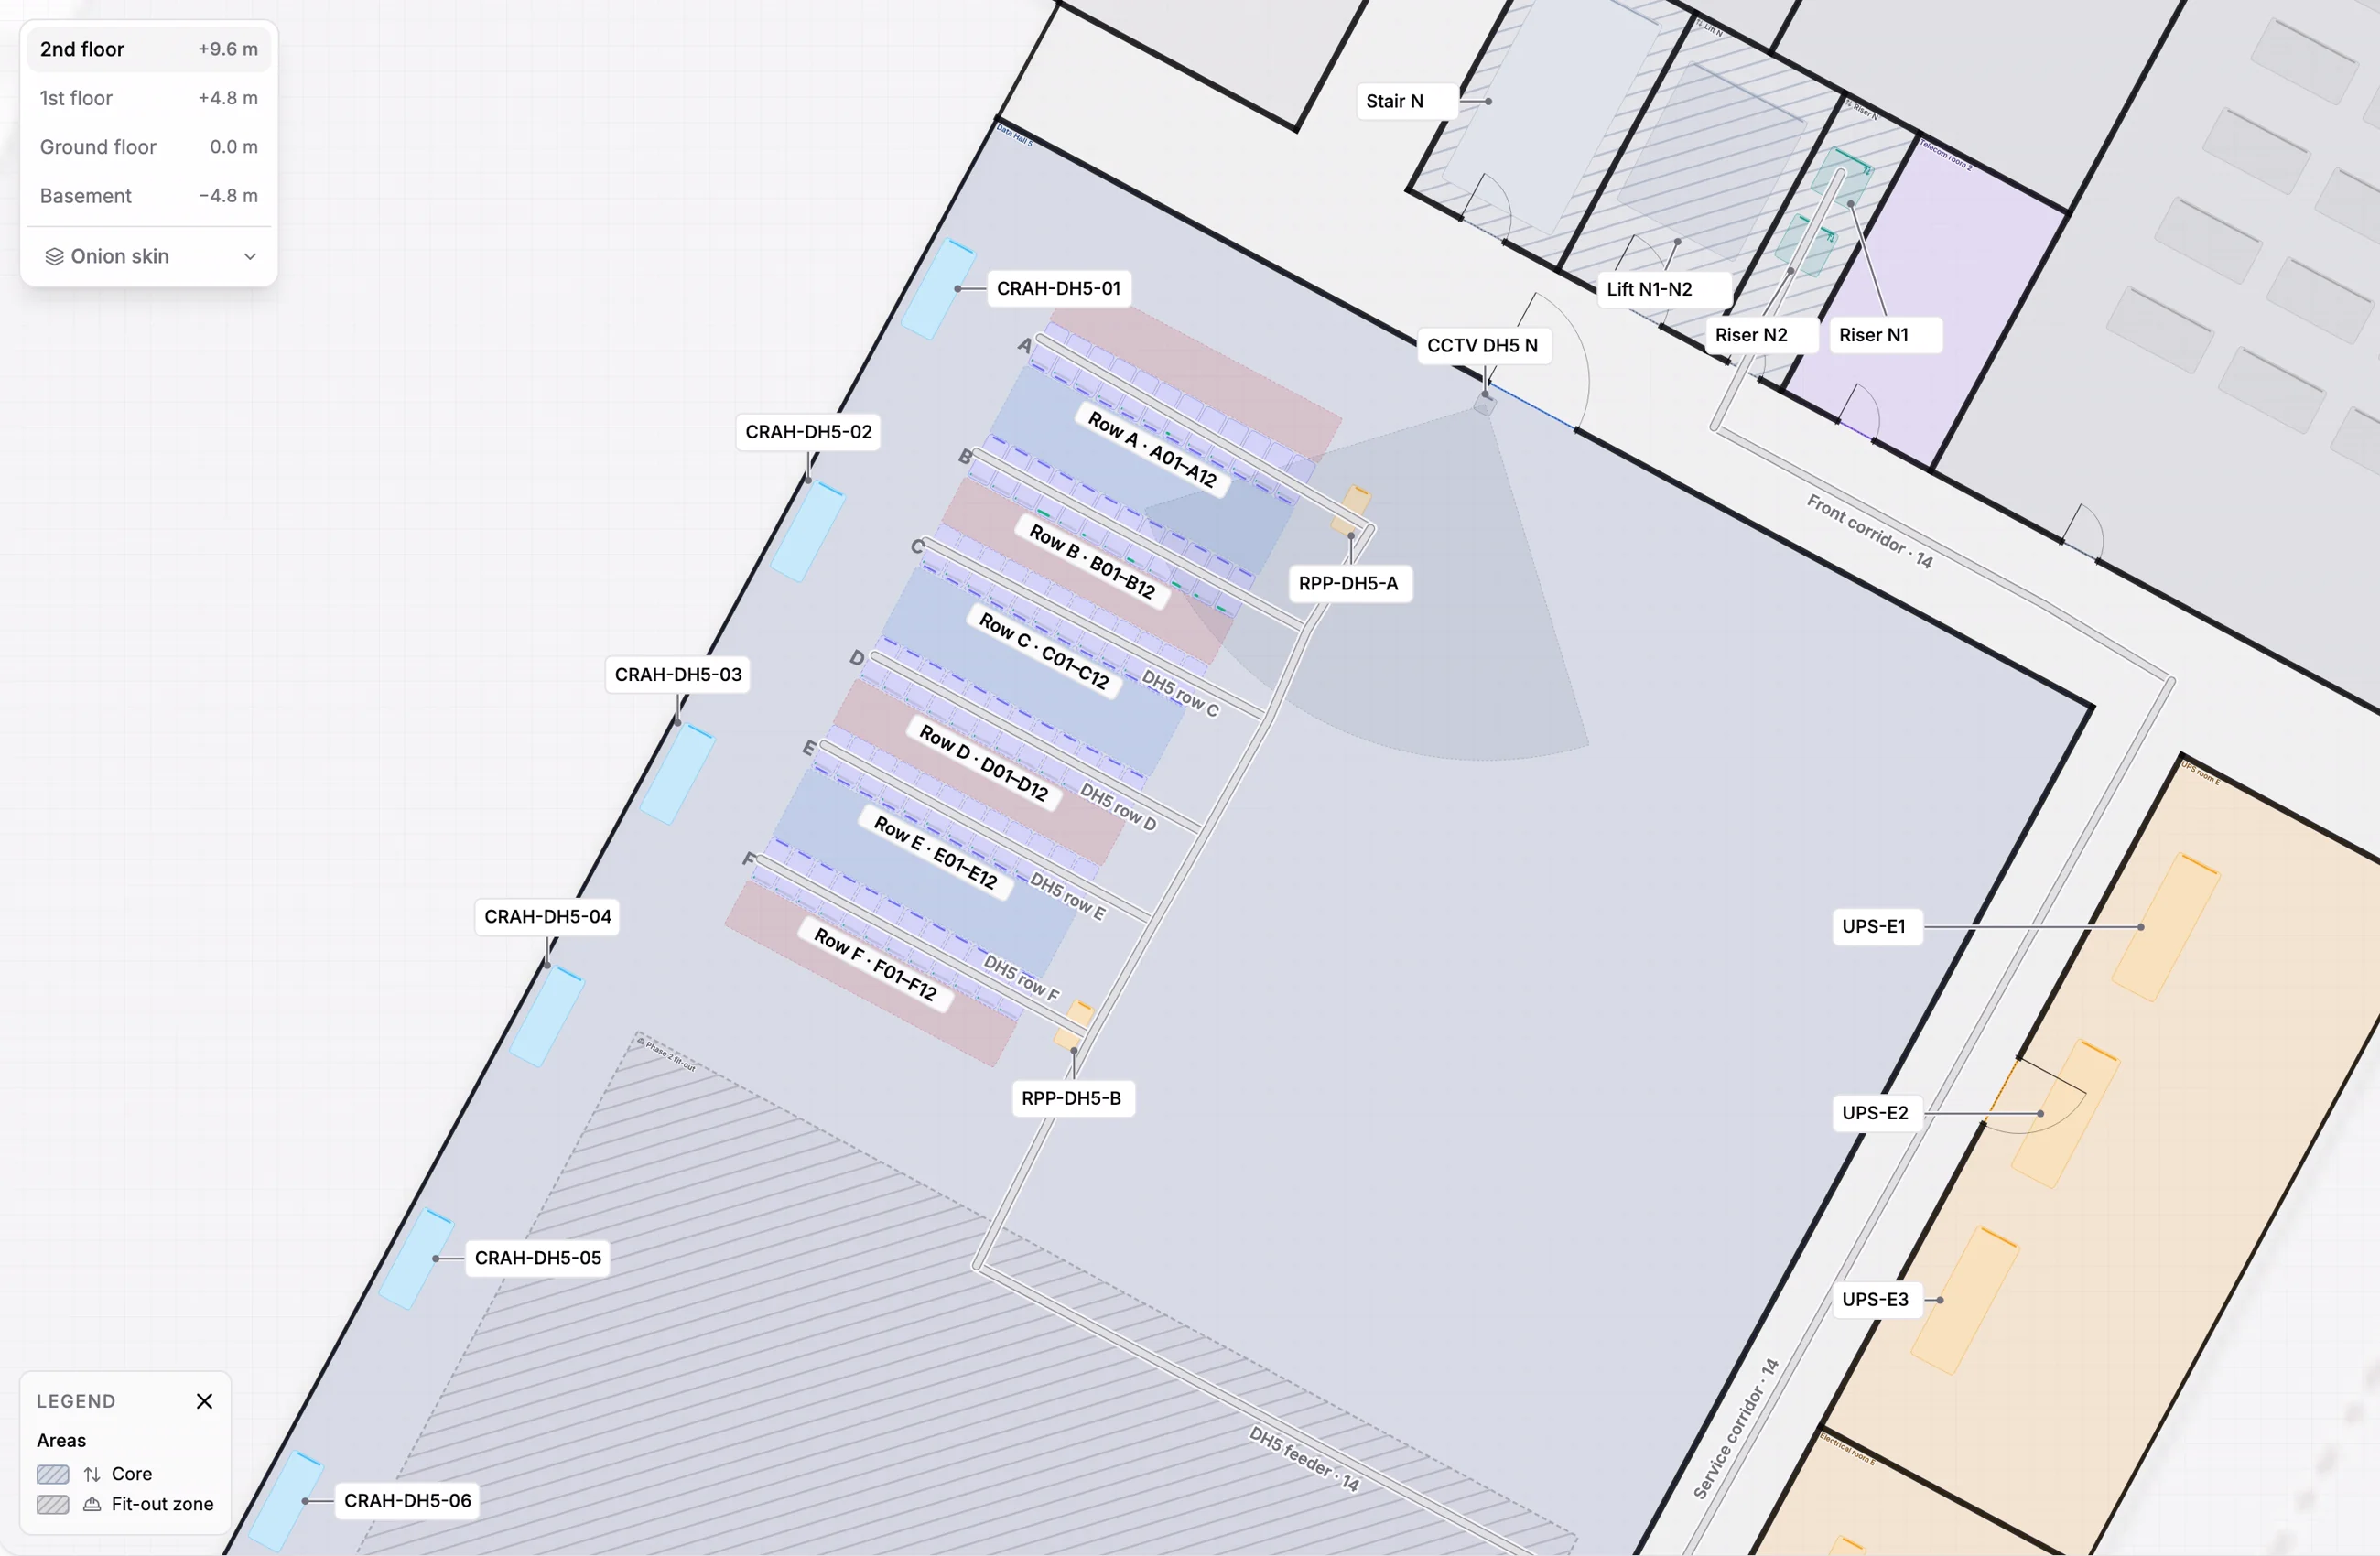
 Six rows named once each, the CRAHs and RPPs on leaders, and the trays named along their runs with the cables they carry.
Cameras
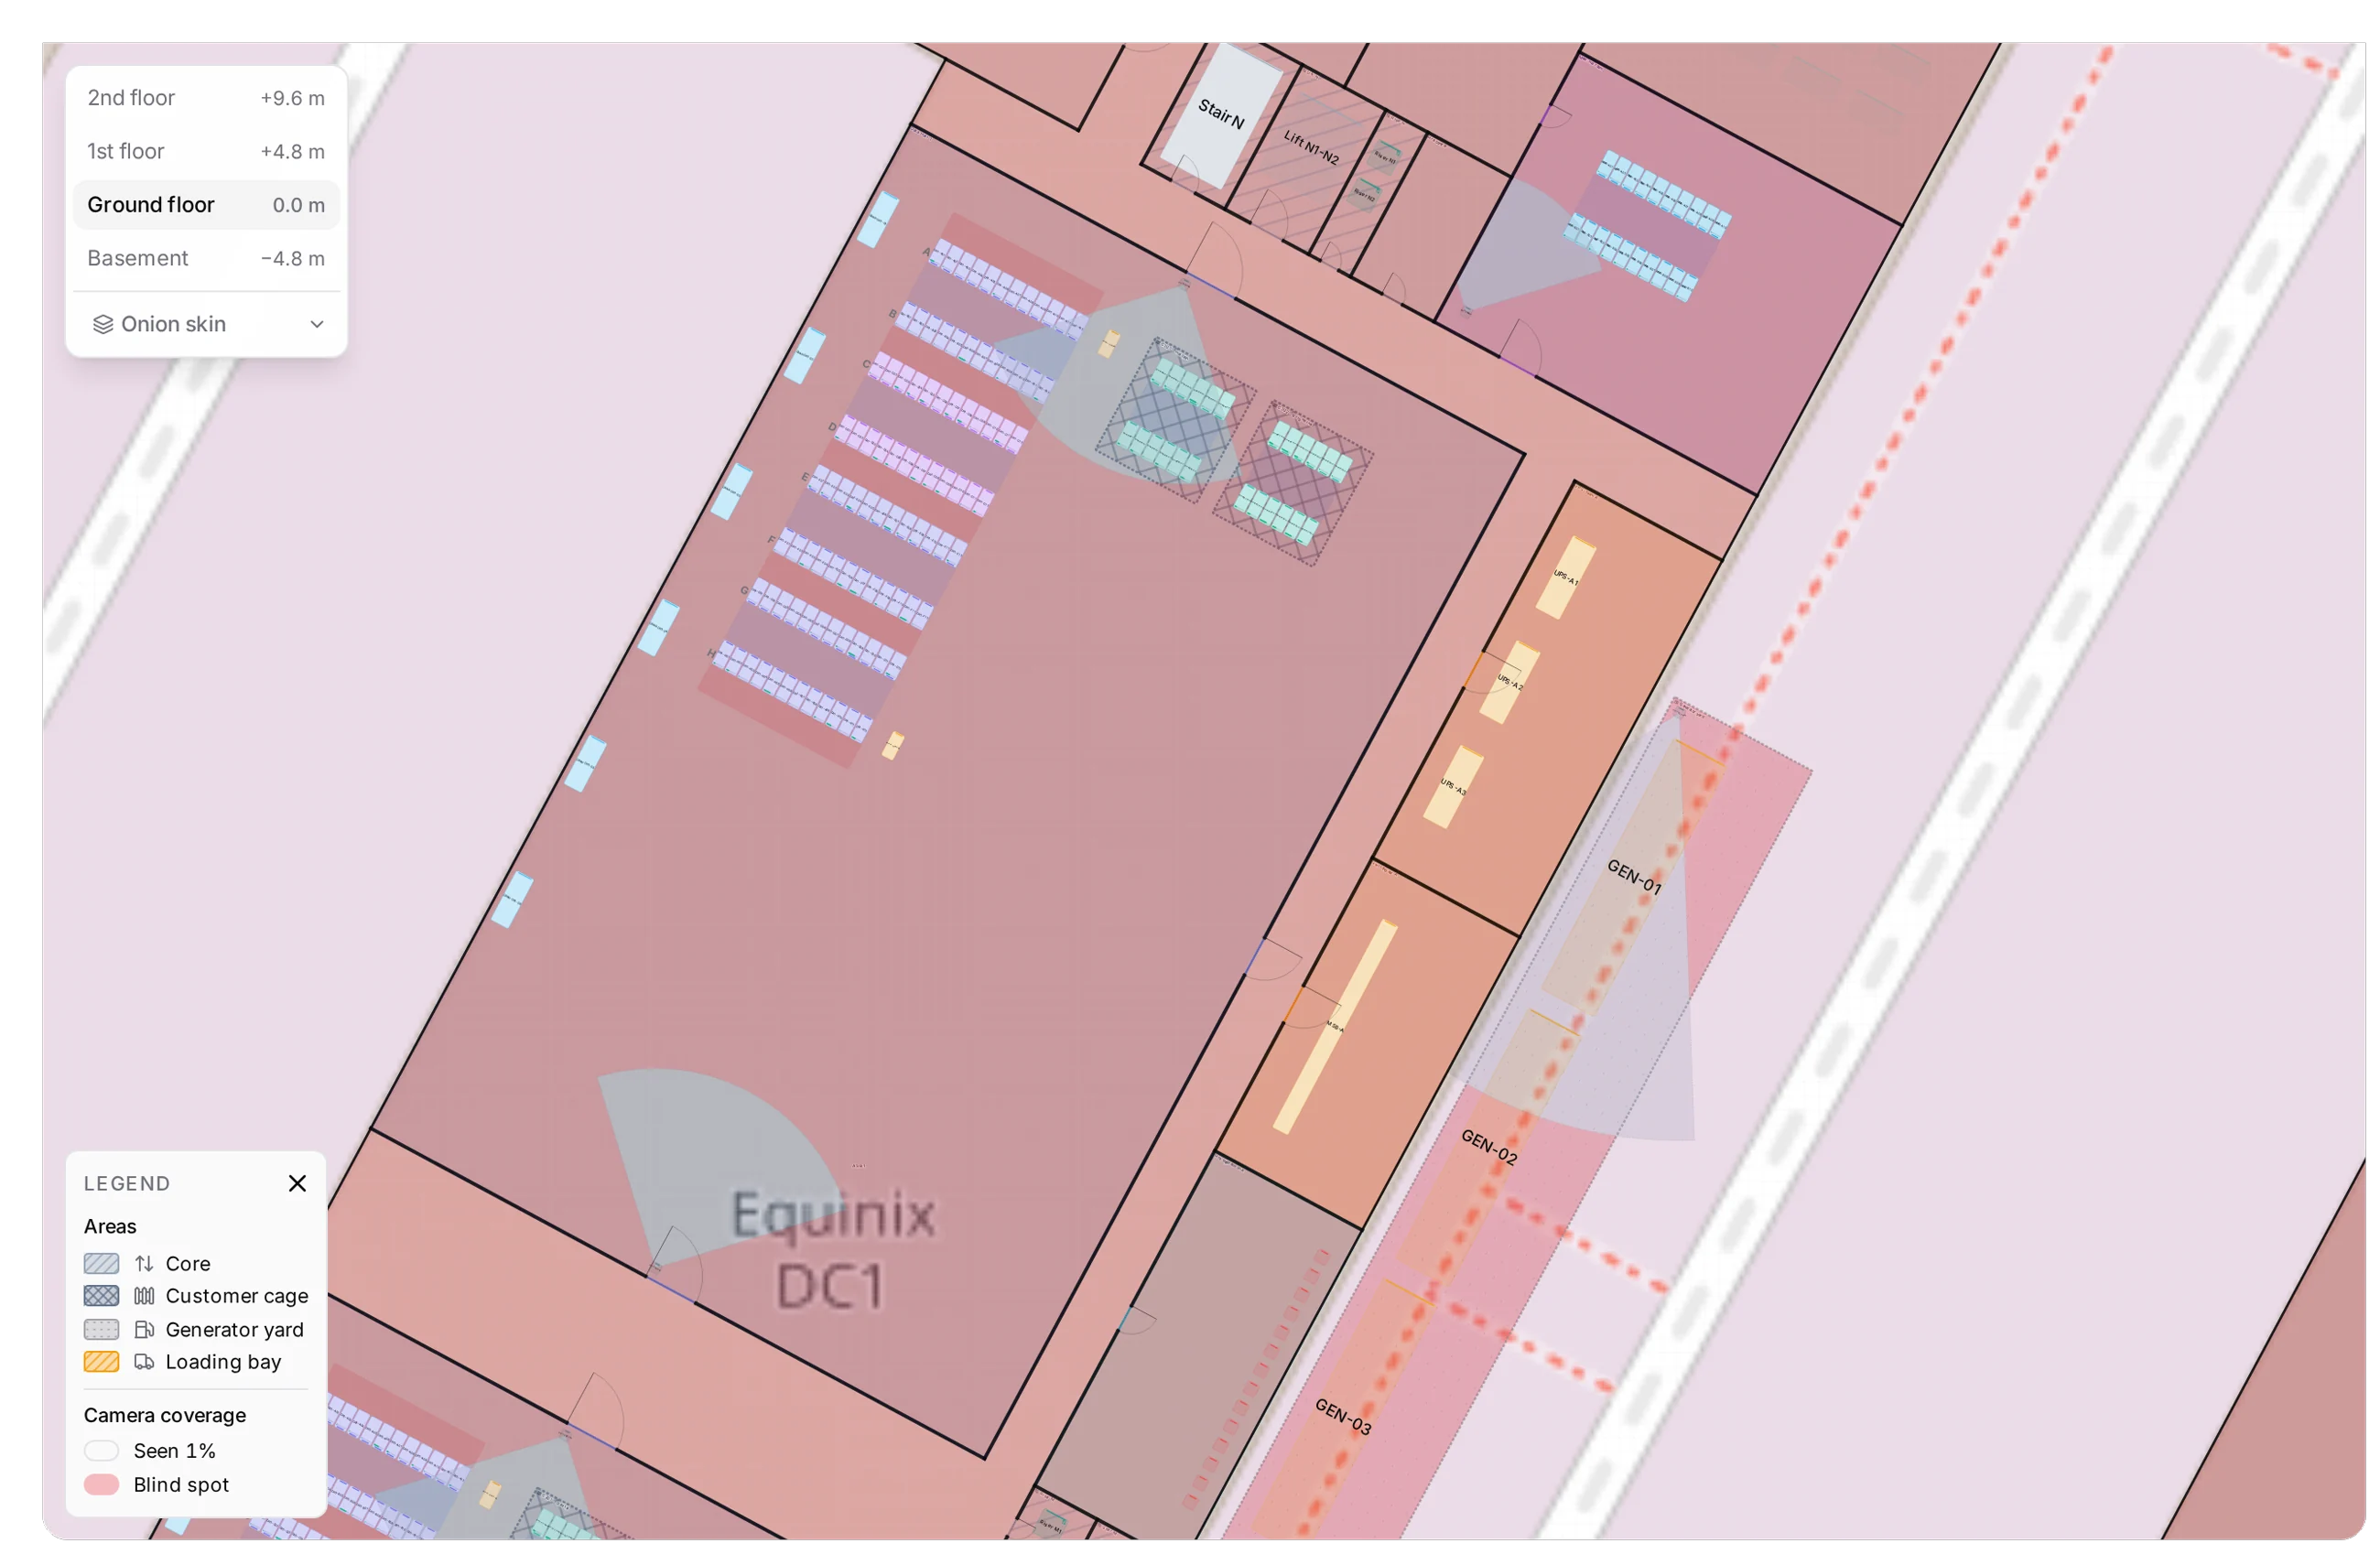
A camera's view stops at walls in 2D, in 3D and in the PDF. Doorways see through, and racks block if you want them to. Reach now goes past 50 cells. Display › Camera coverage tints the blind spots and gives the share of the floor that is seen, per area as well as for the whole plan.
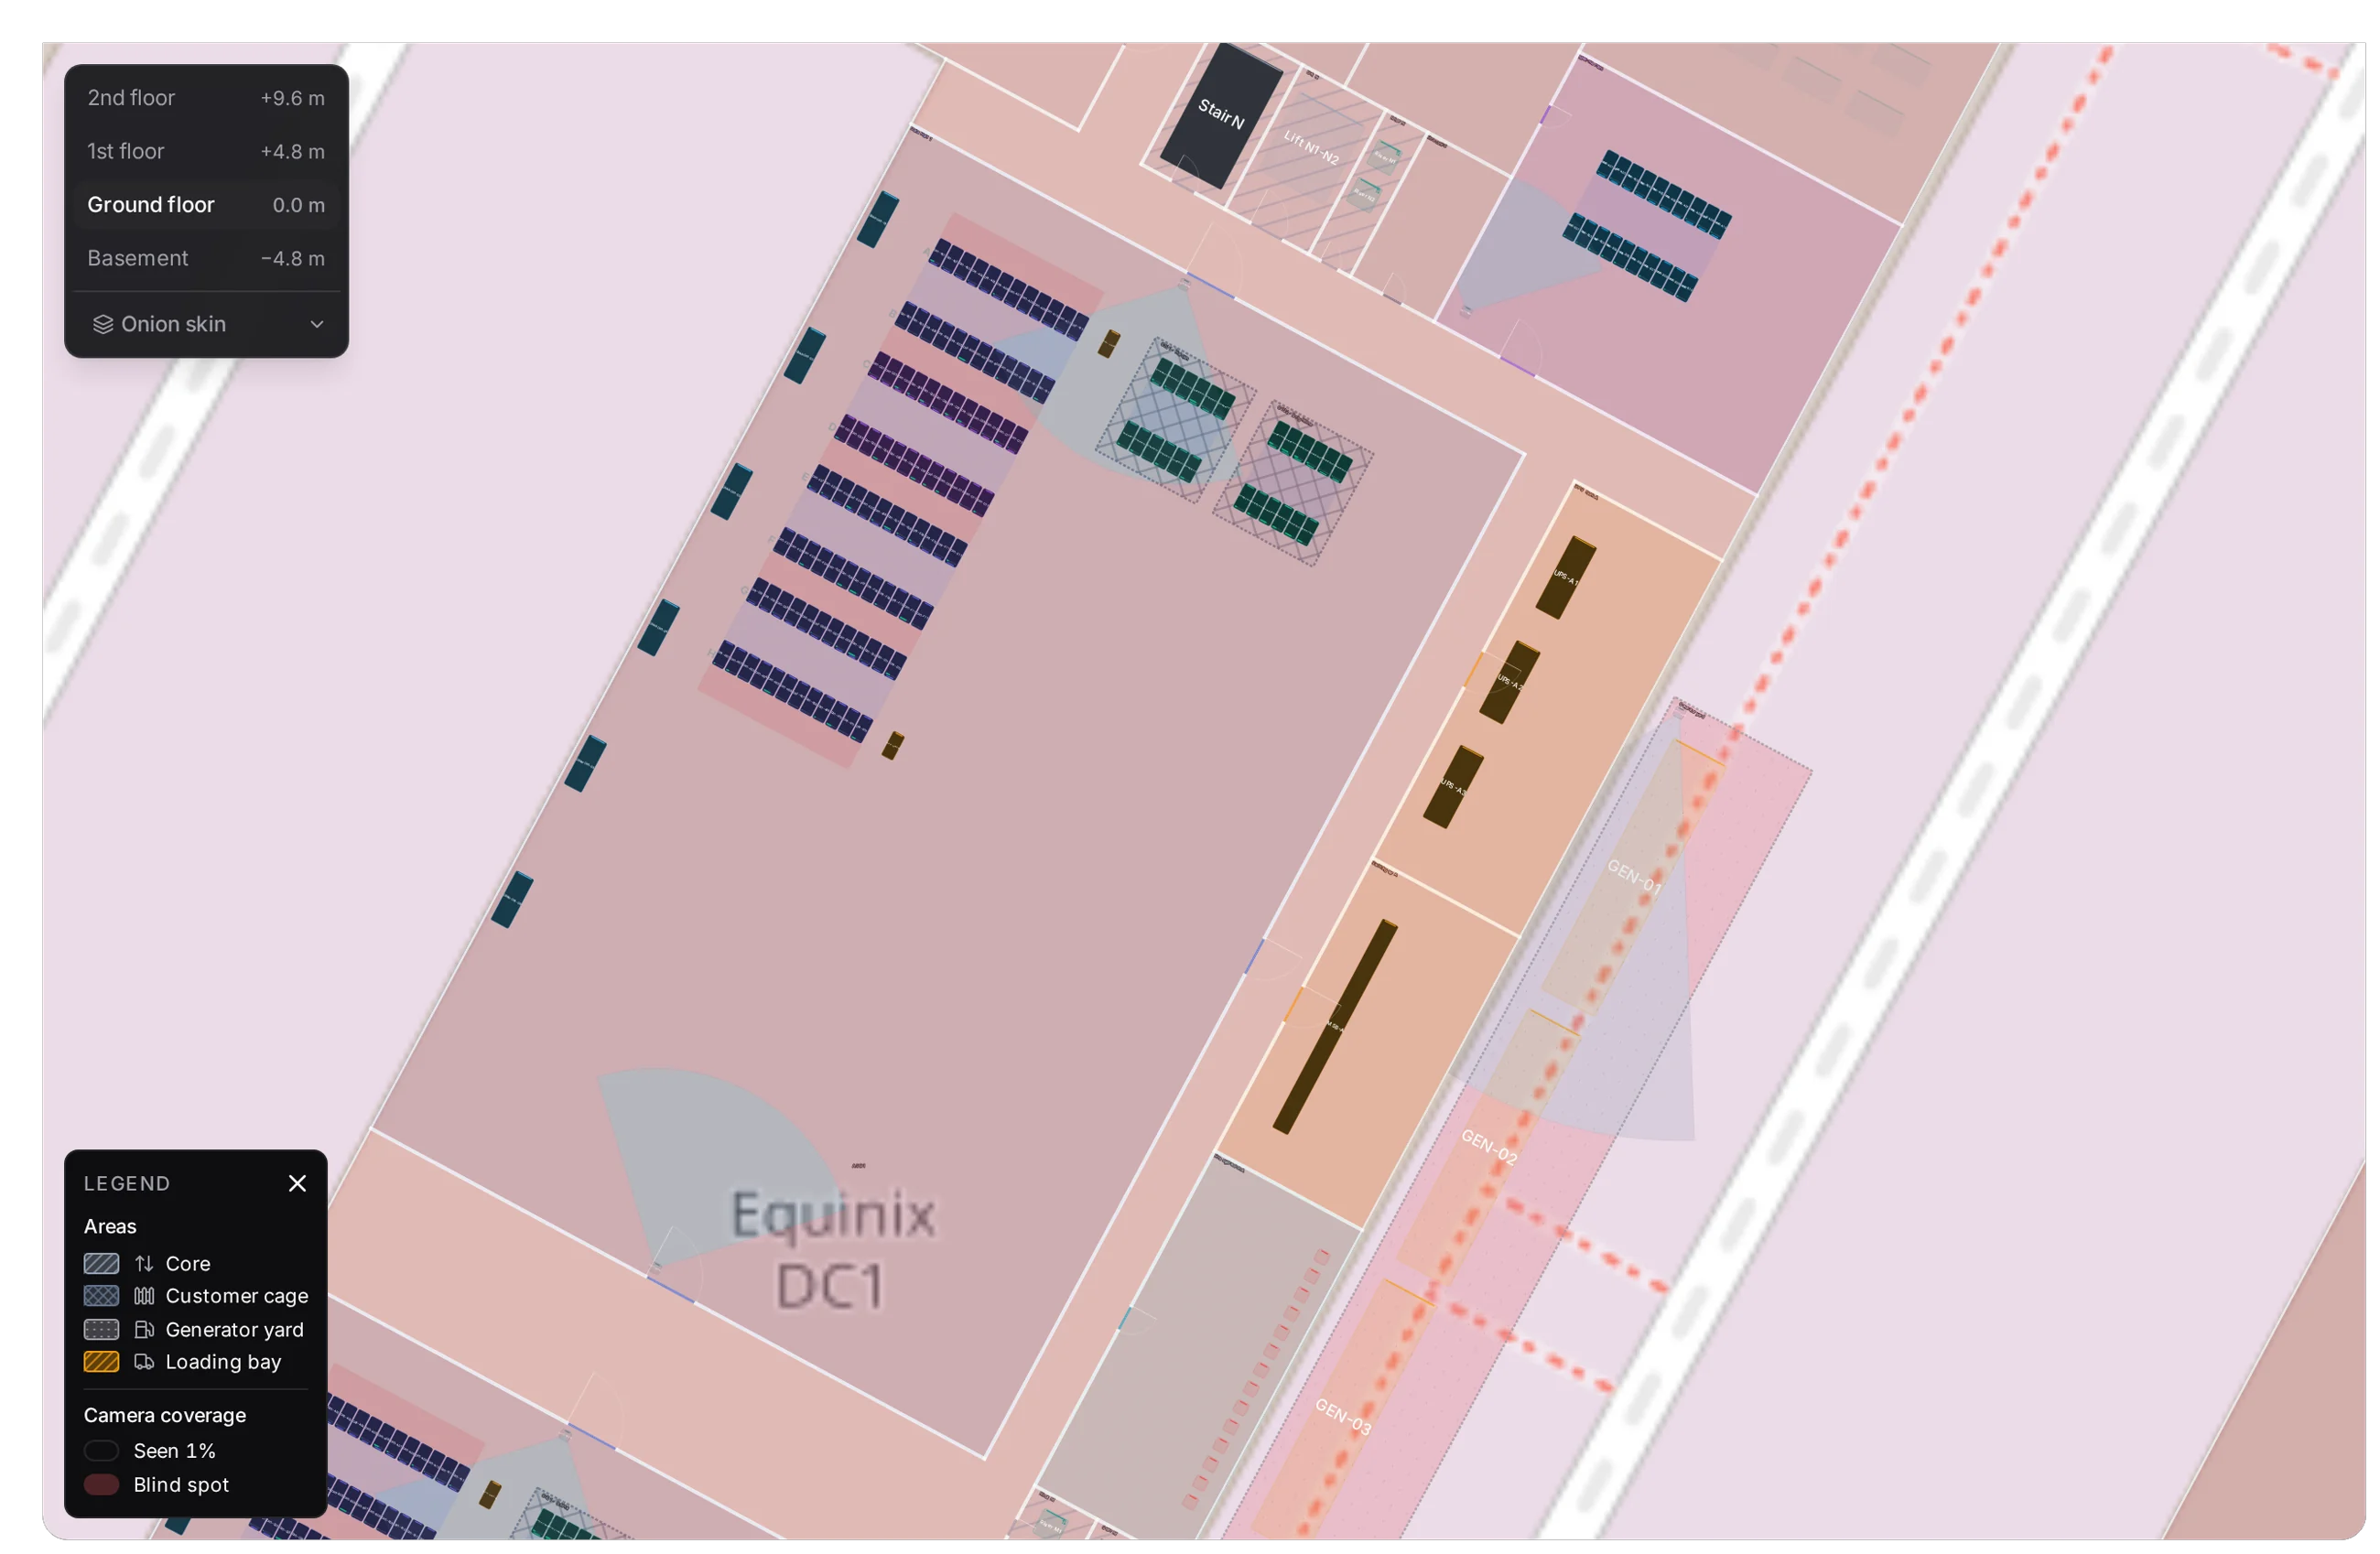
In 3D, and on paper
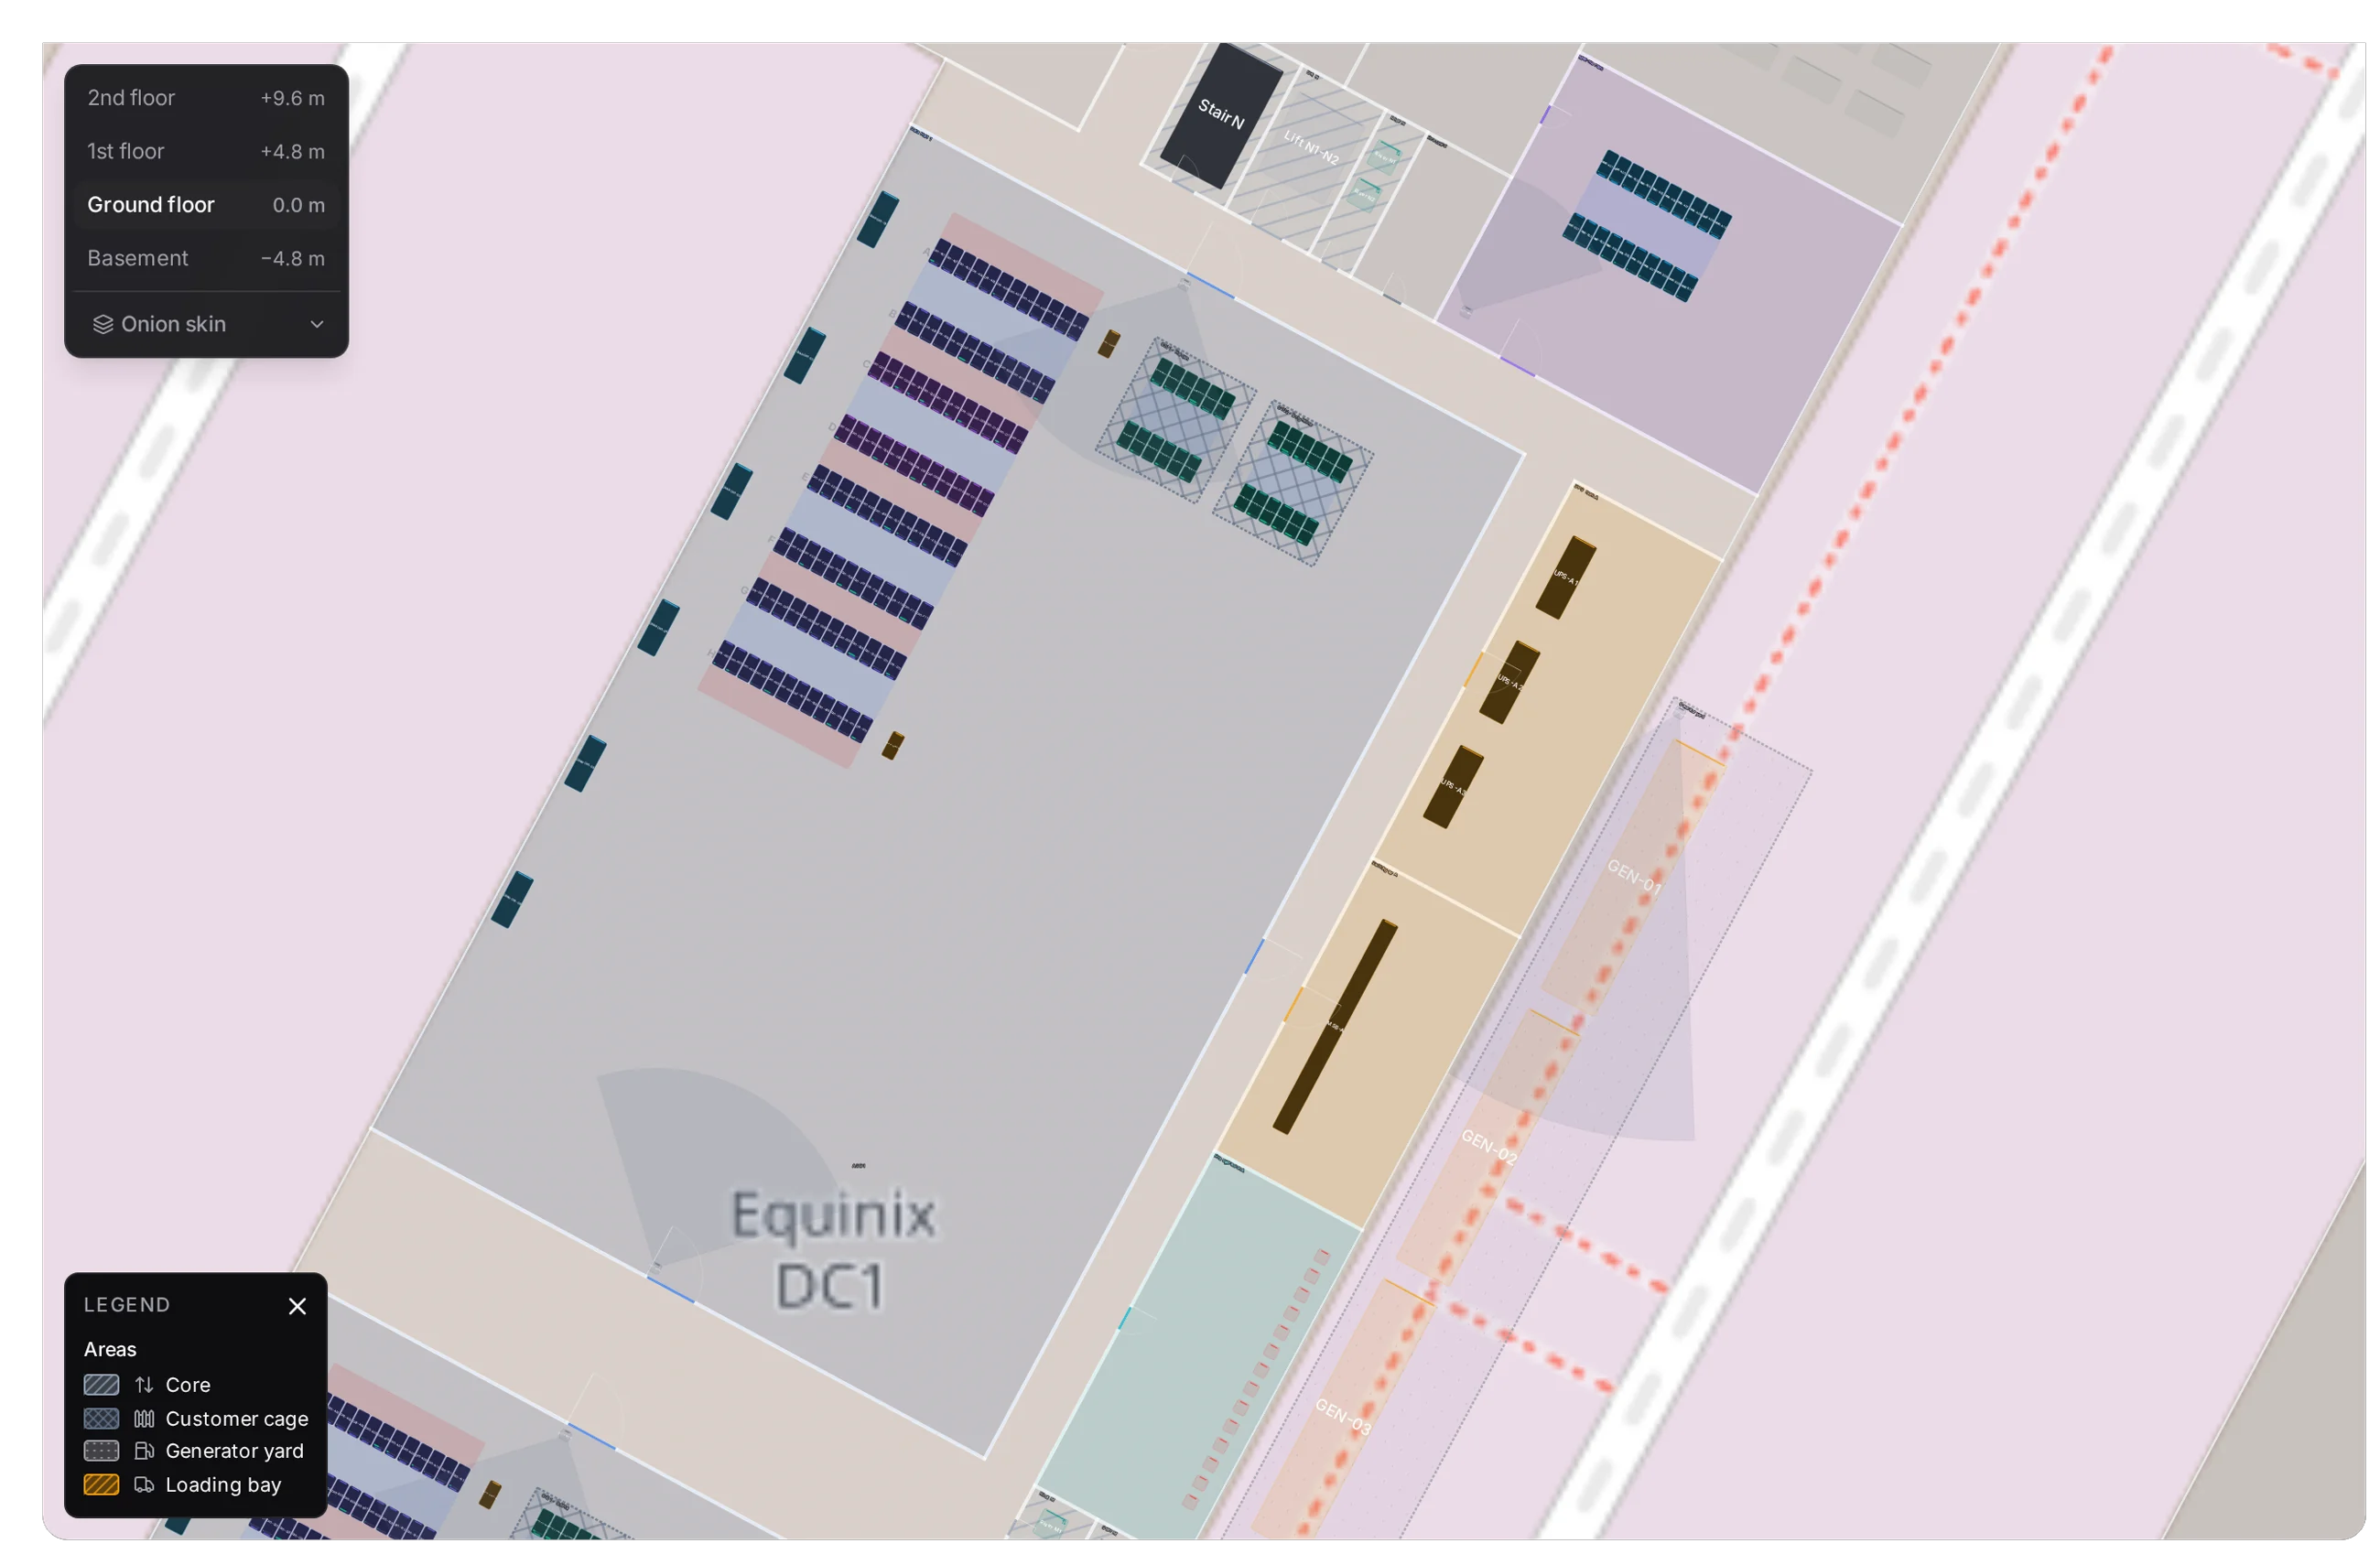
The 3D view has an architectural look in both themes, GLB models for device types and devices with their ports mapped onto them, devices placed straight on the floor, and the plan's own text drawn on each level: labels, room and area names, zone names, and tray names with their cable count. Tiles for power panels, power feeds and cooling sources pin their popover on a click, and a cooling source's shows its load against its rating.
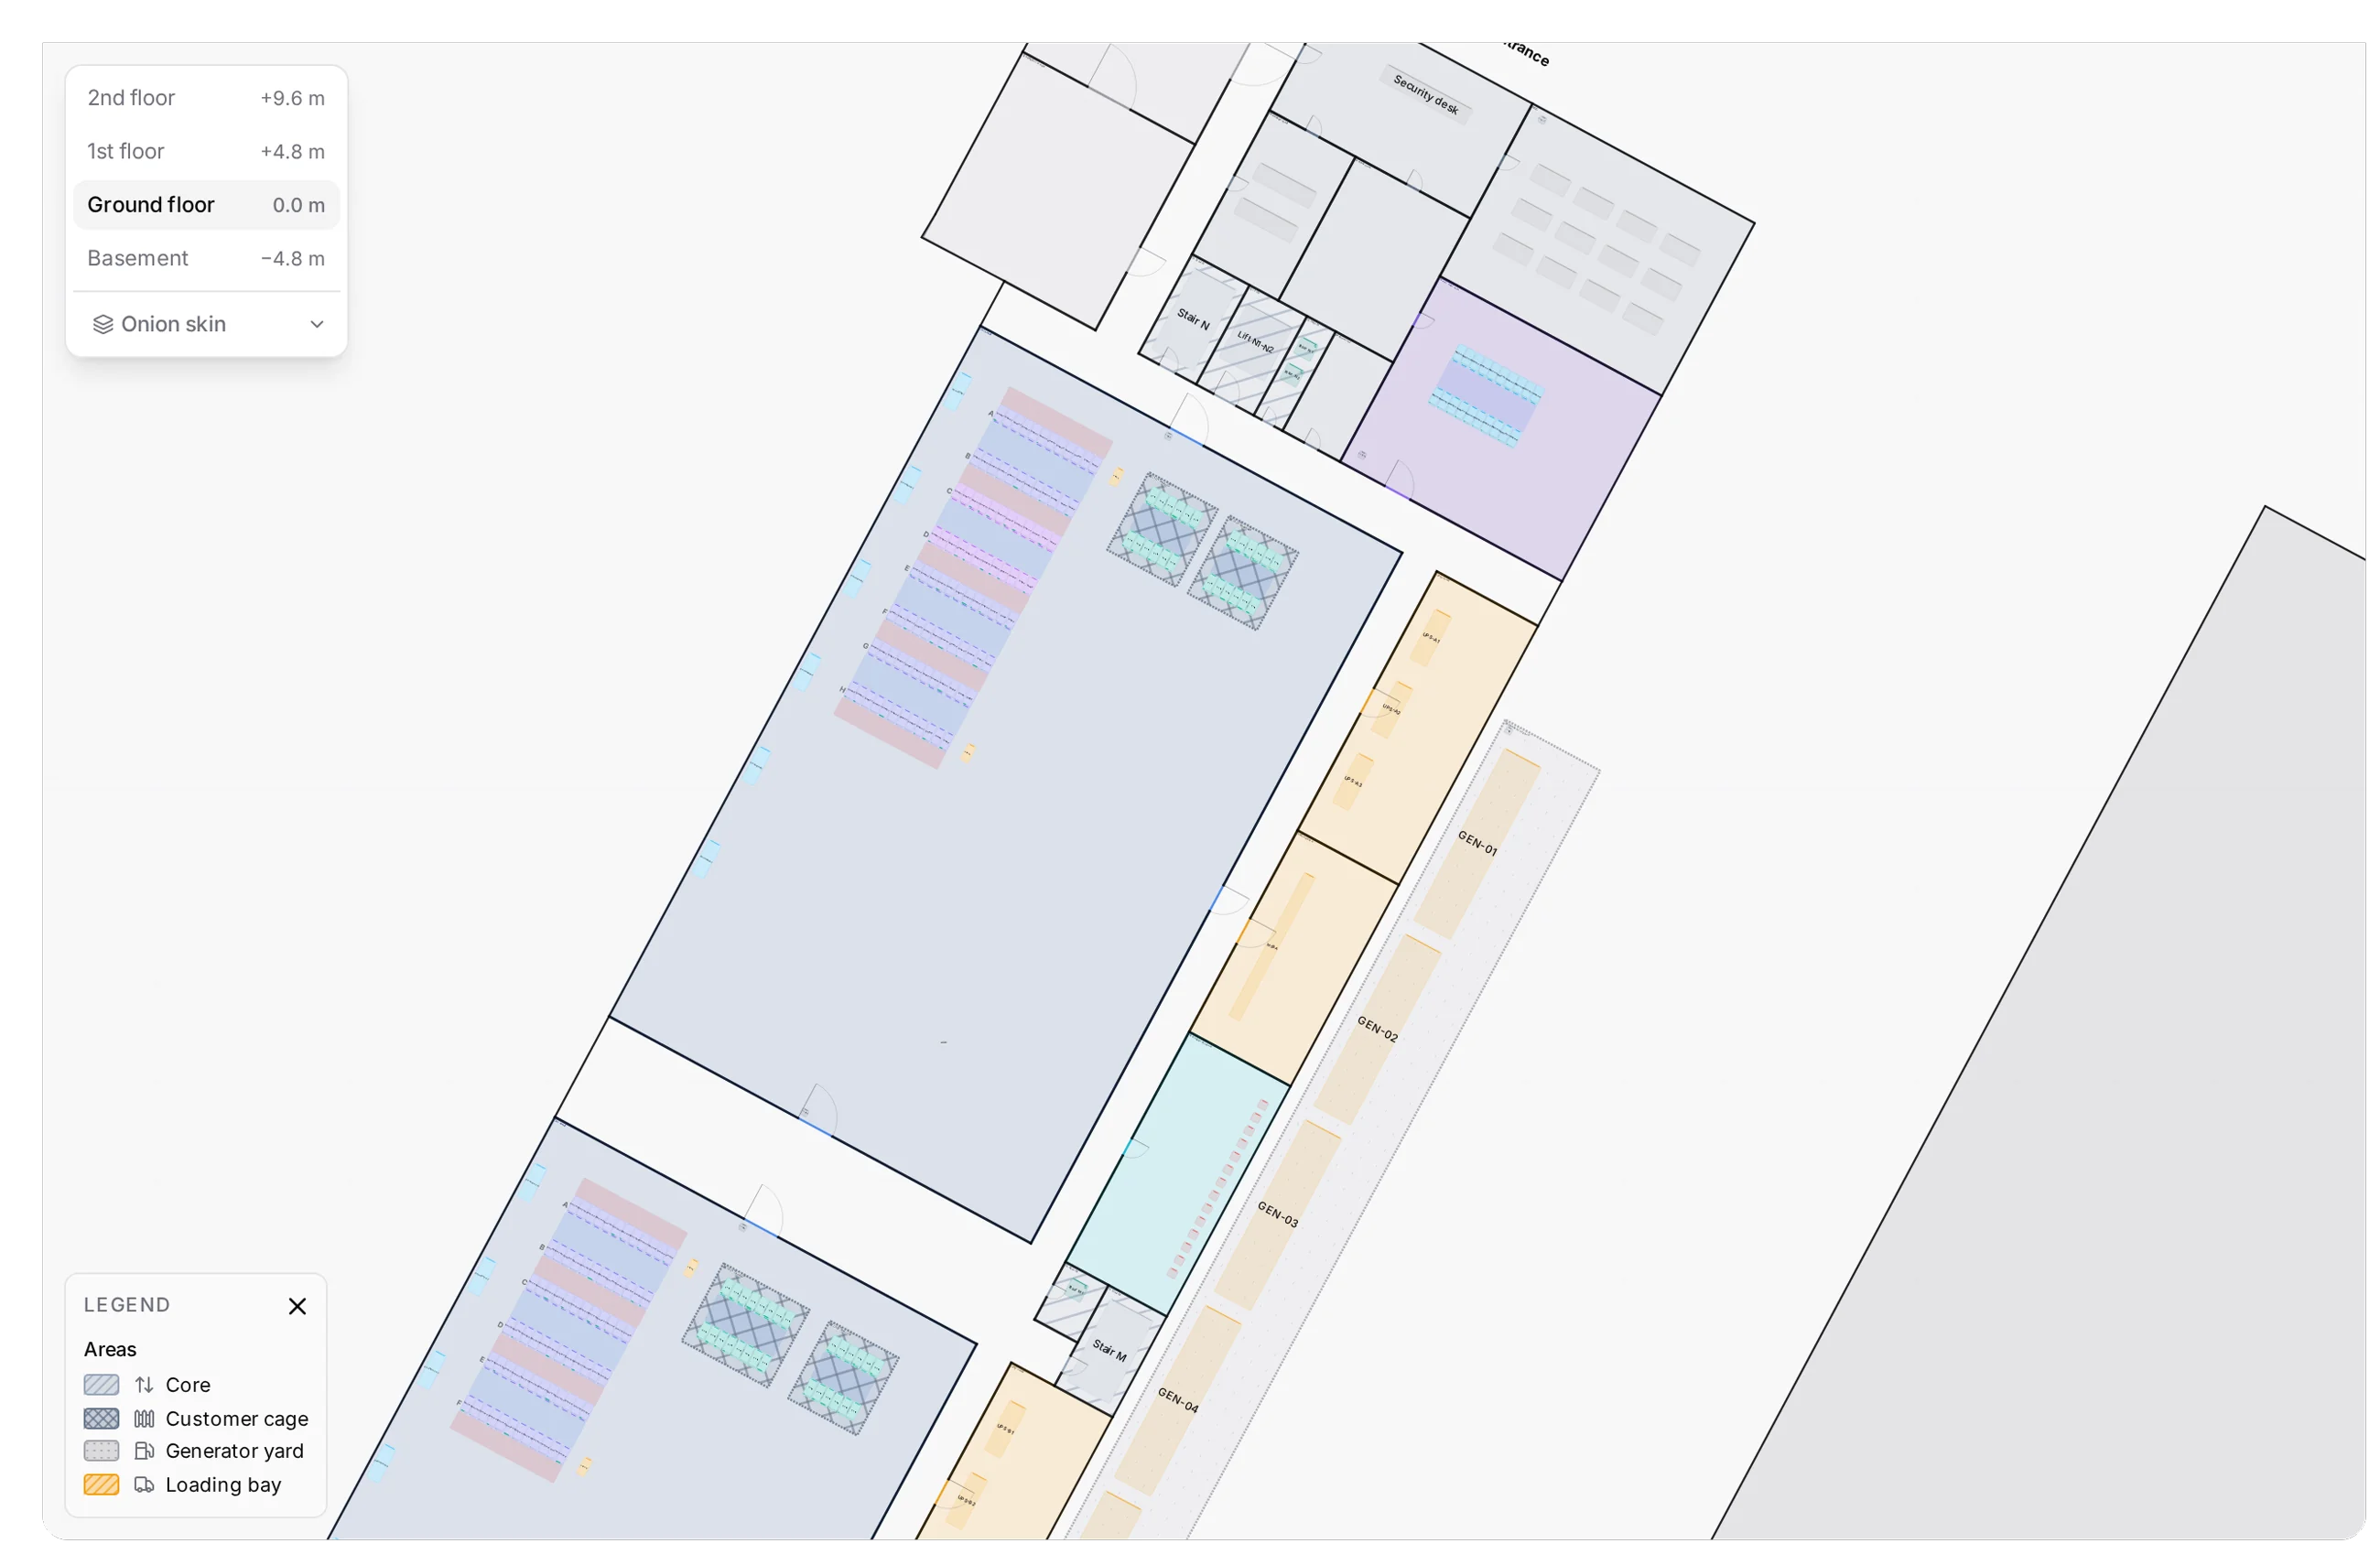
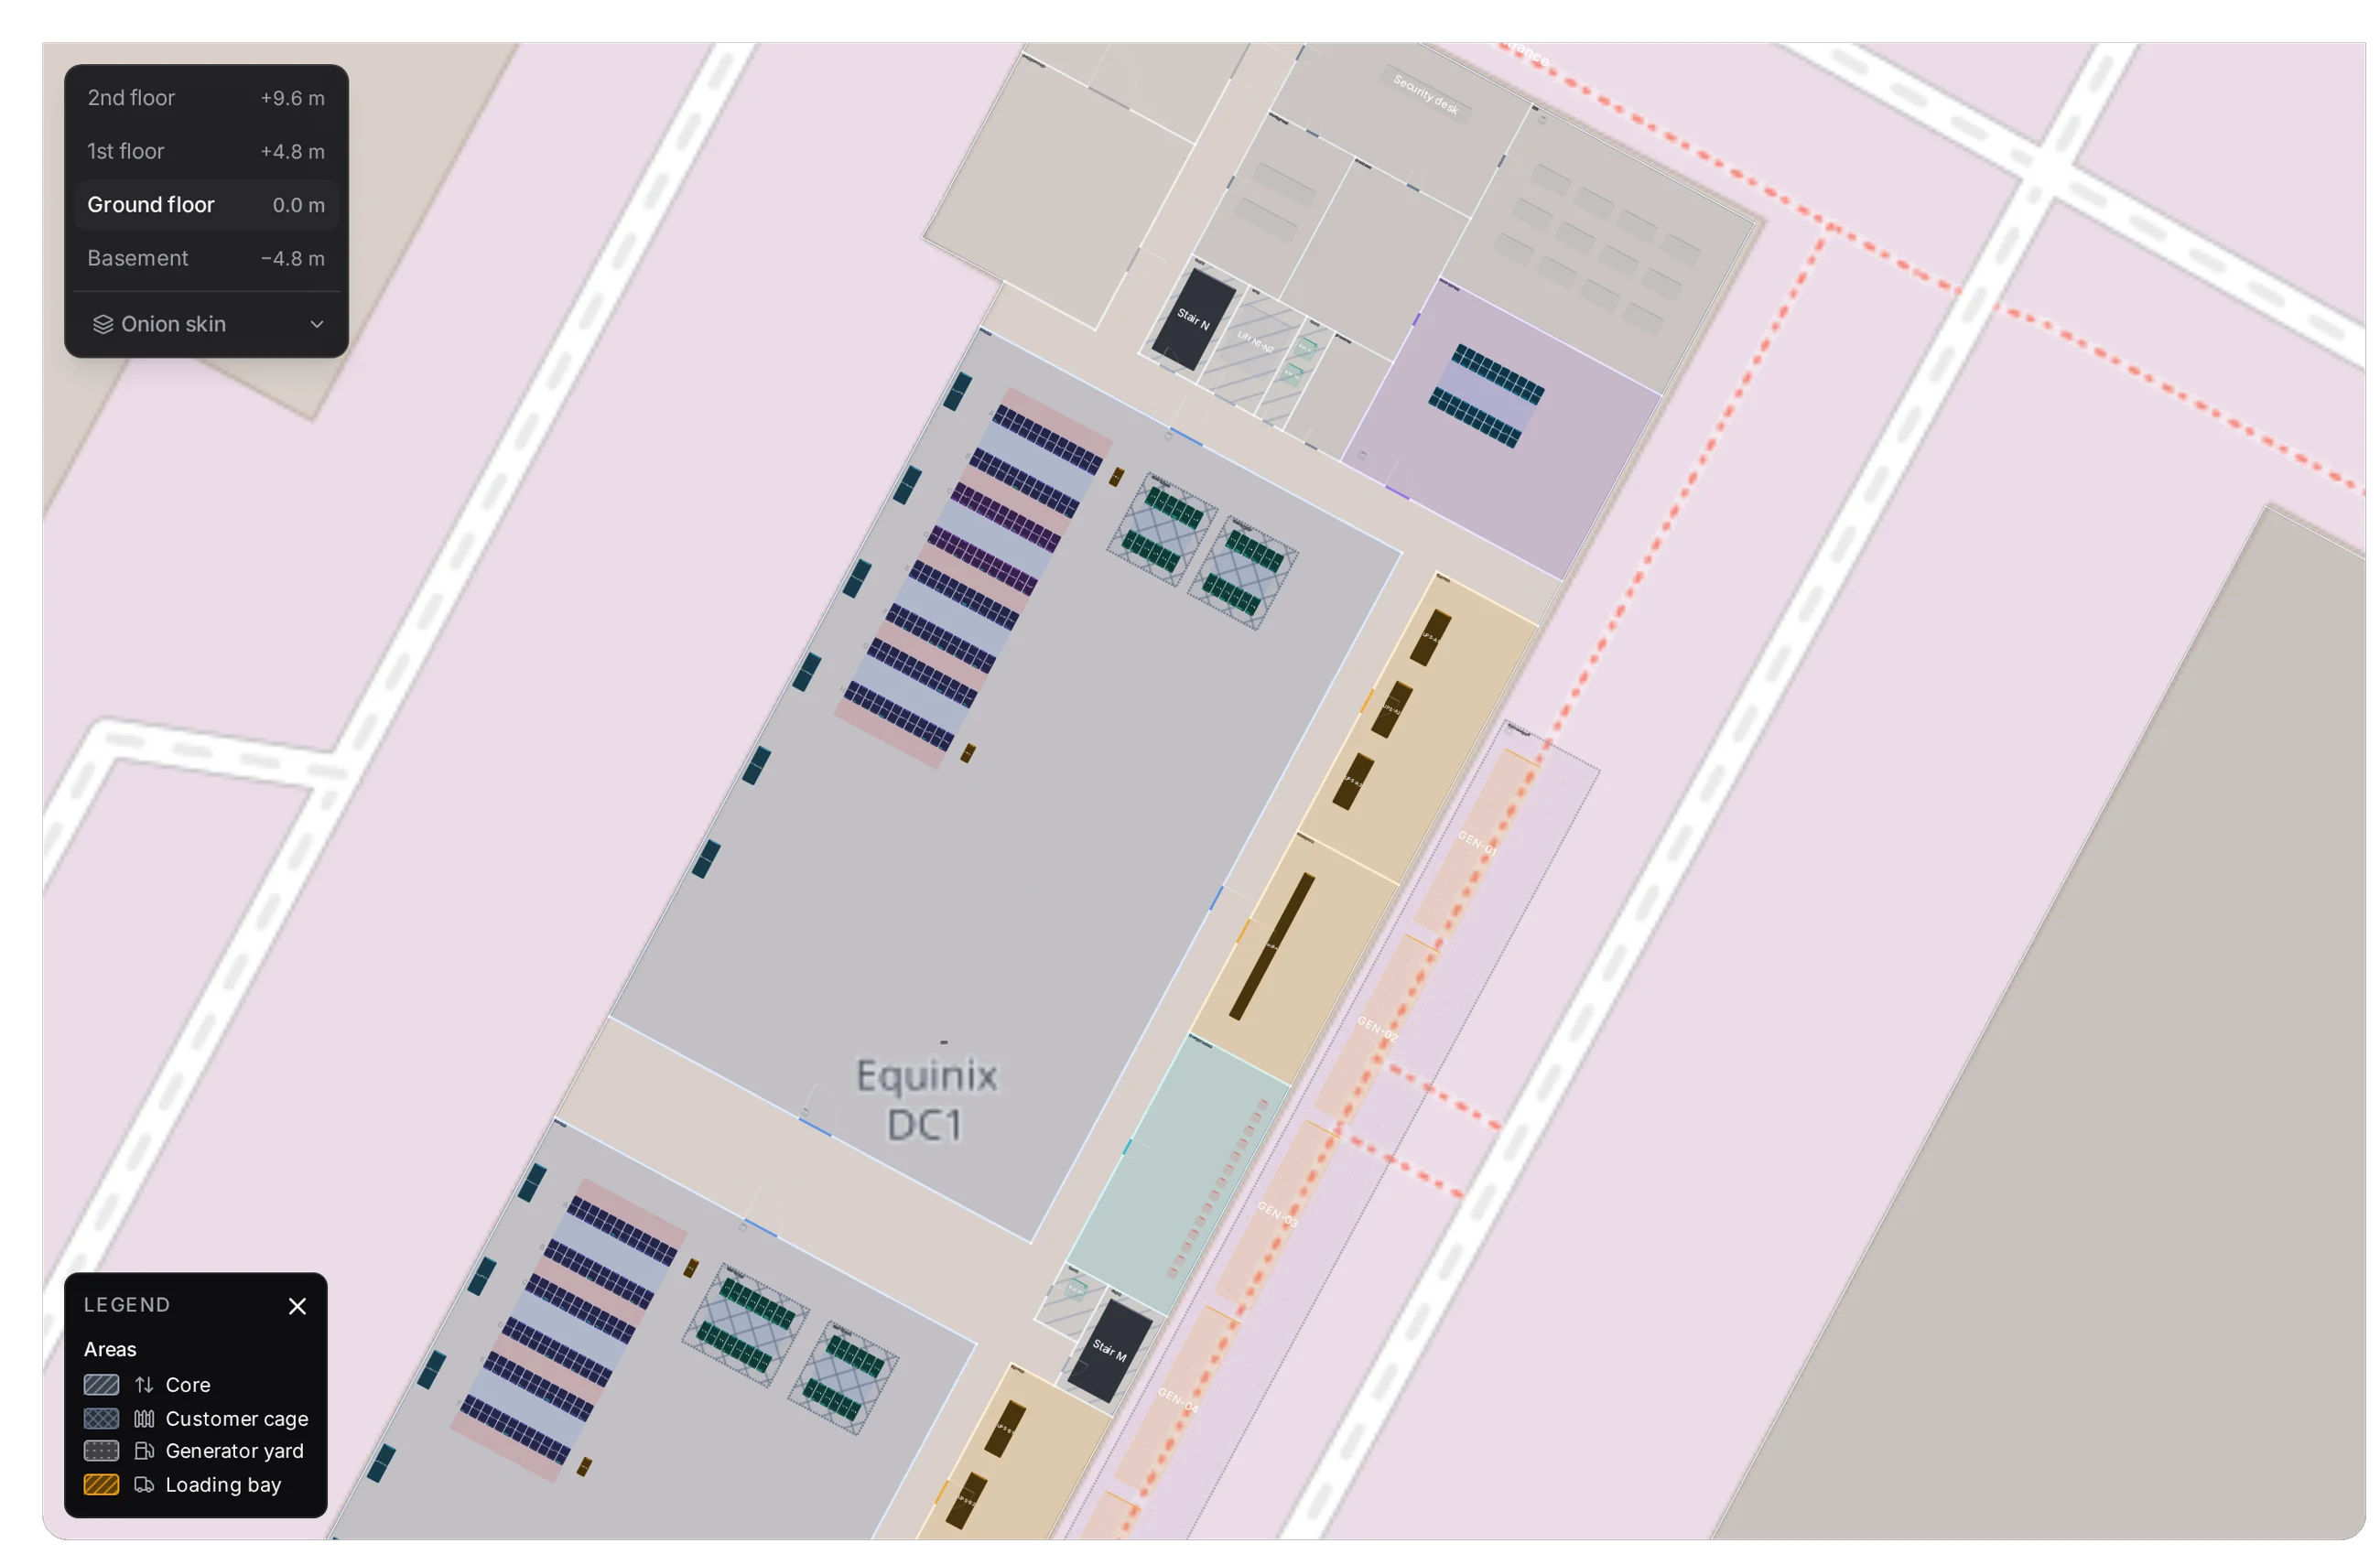
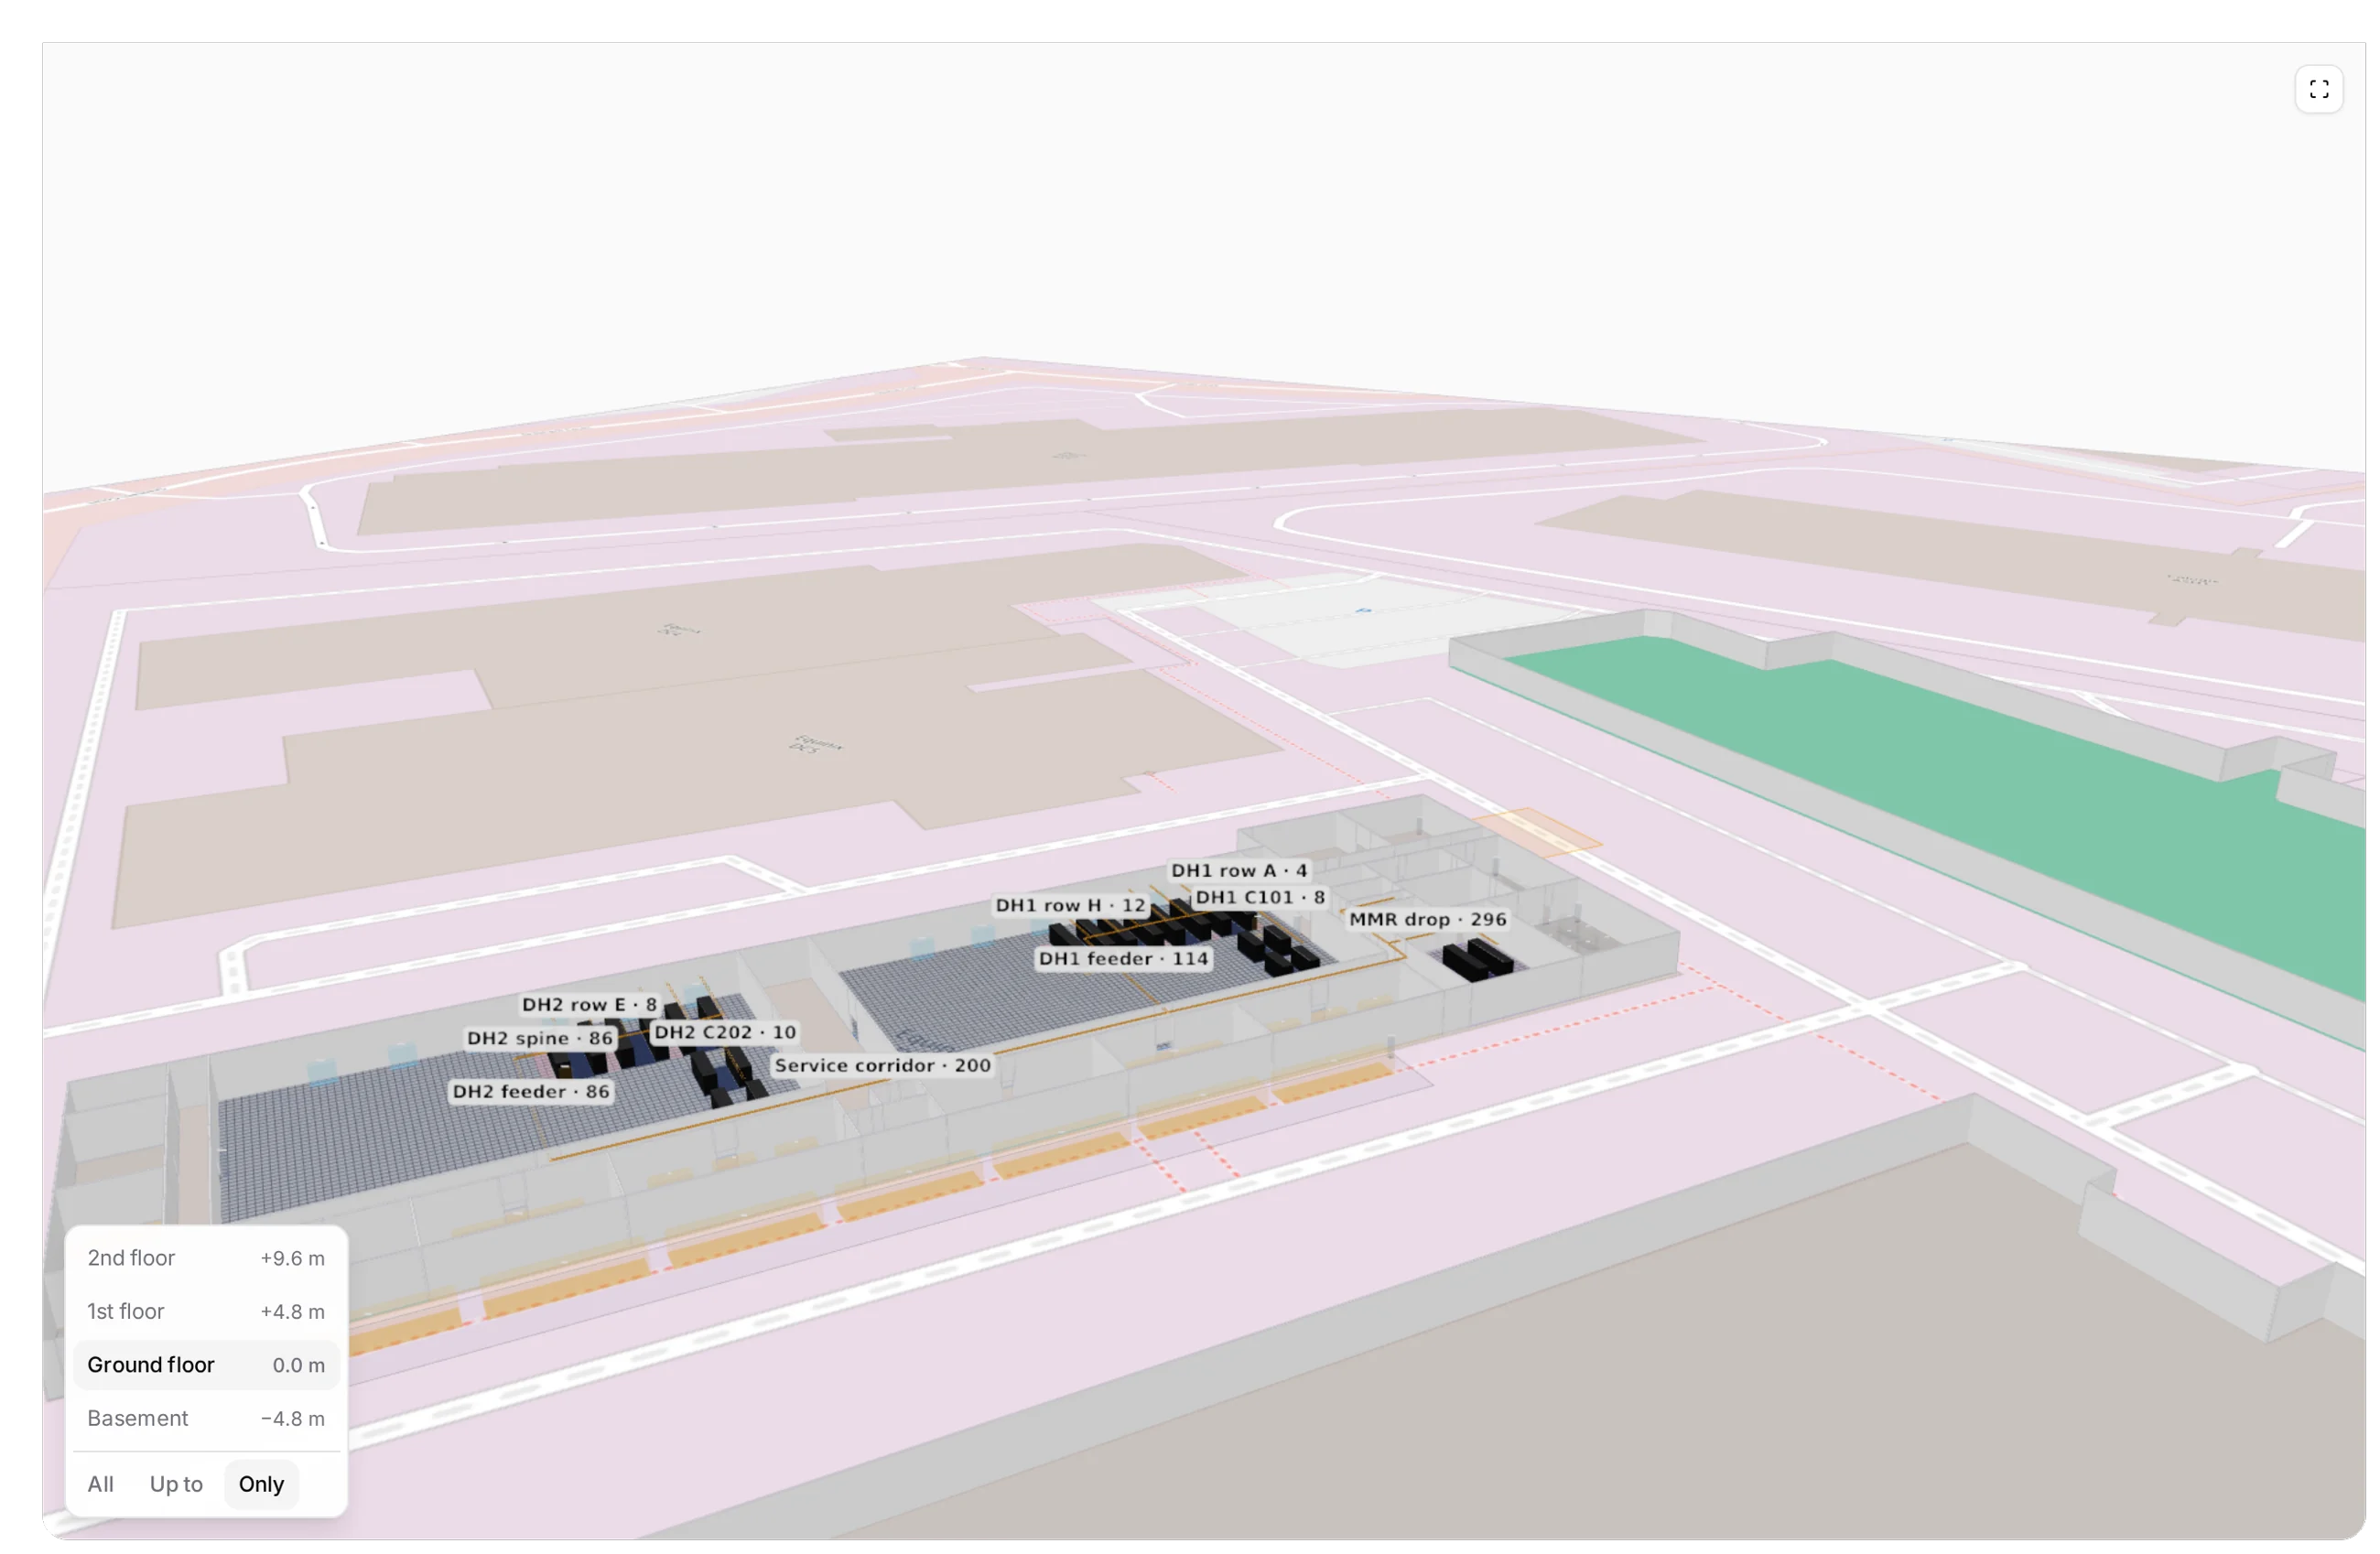
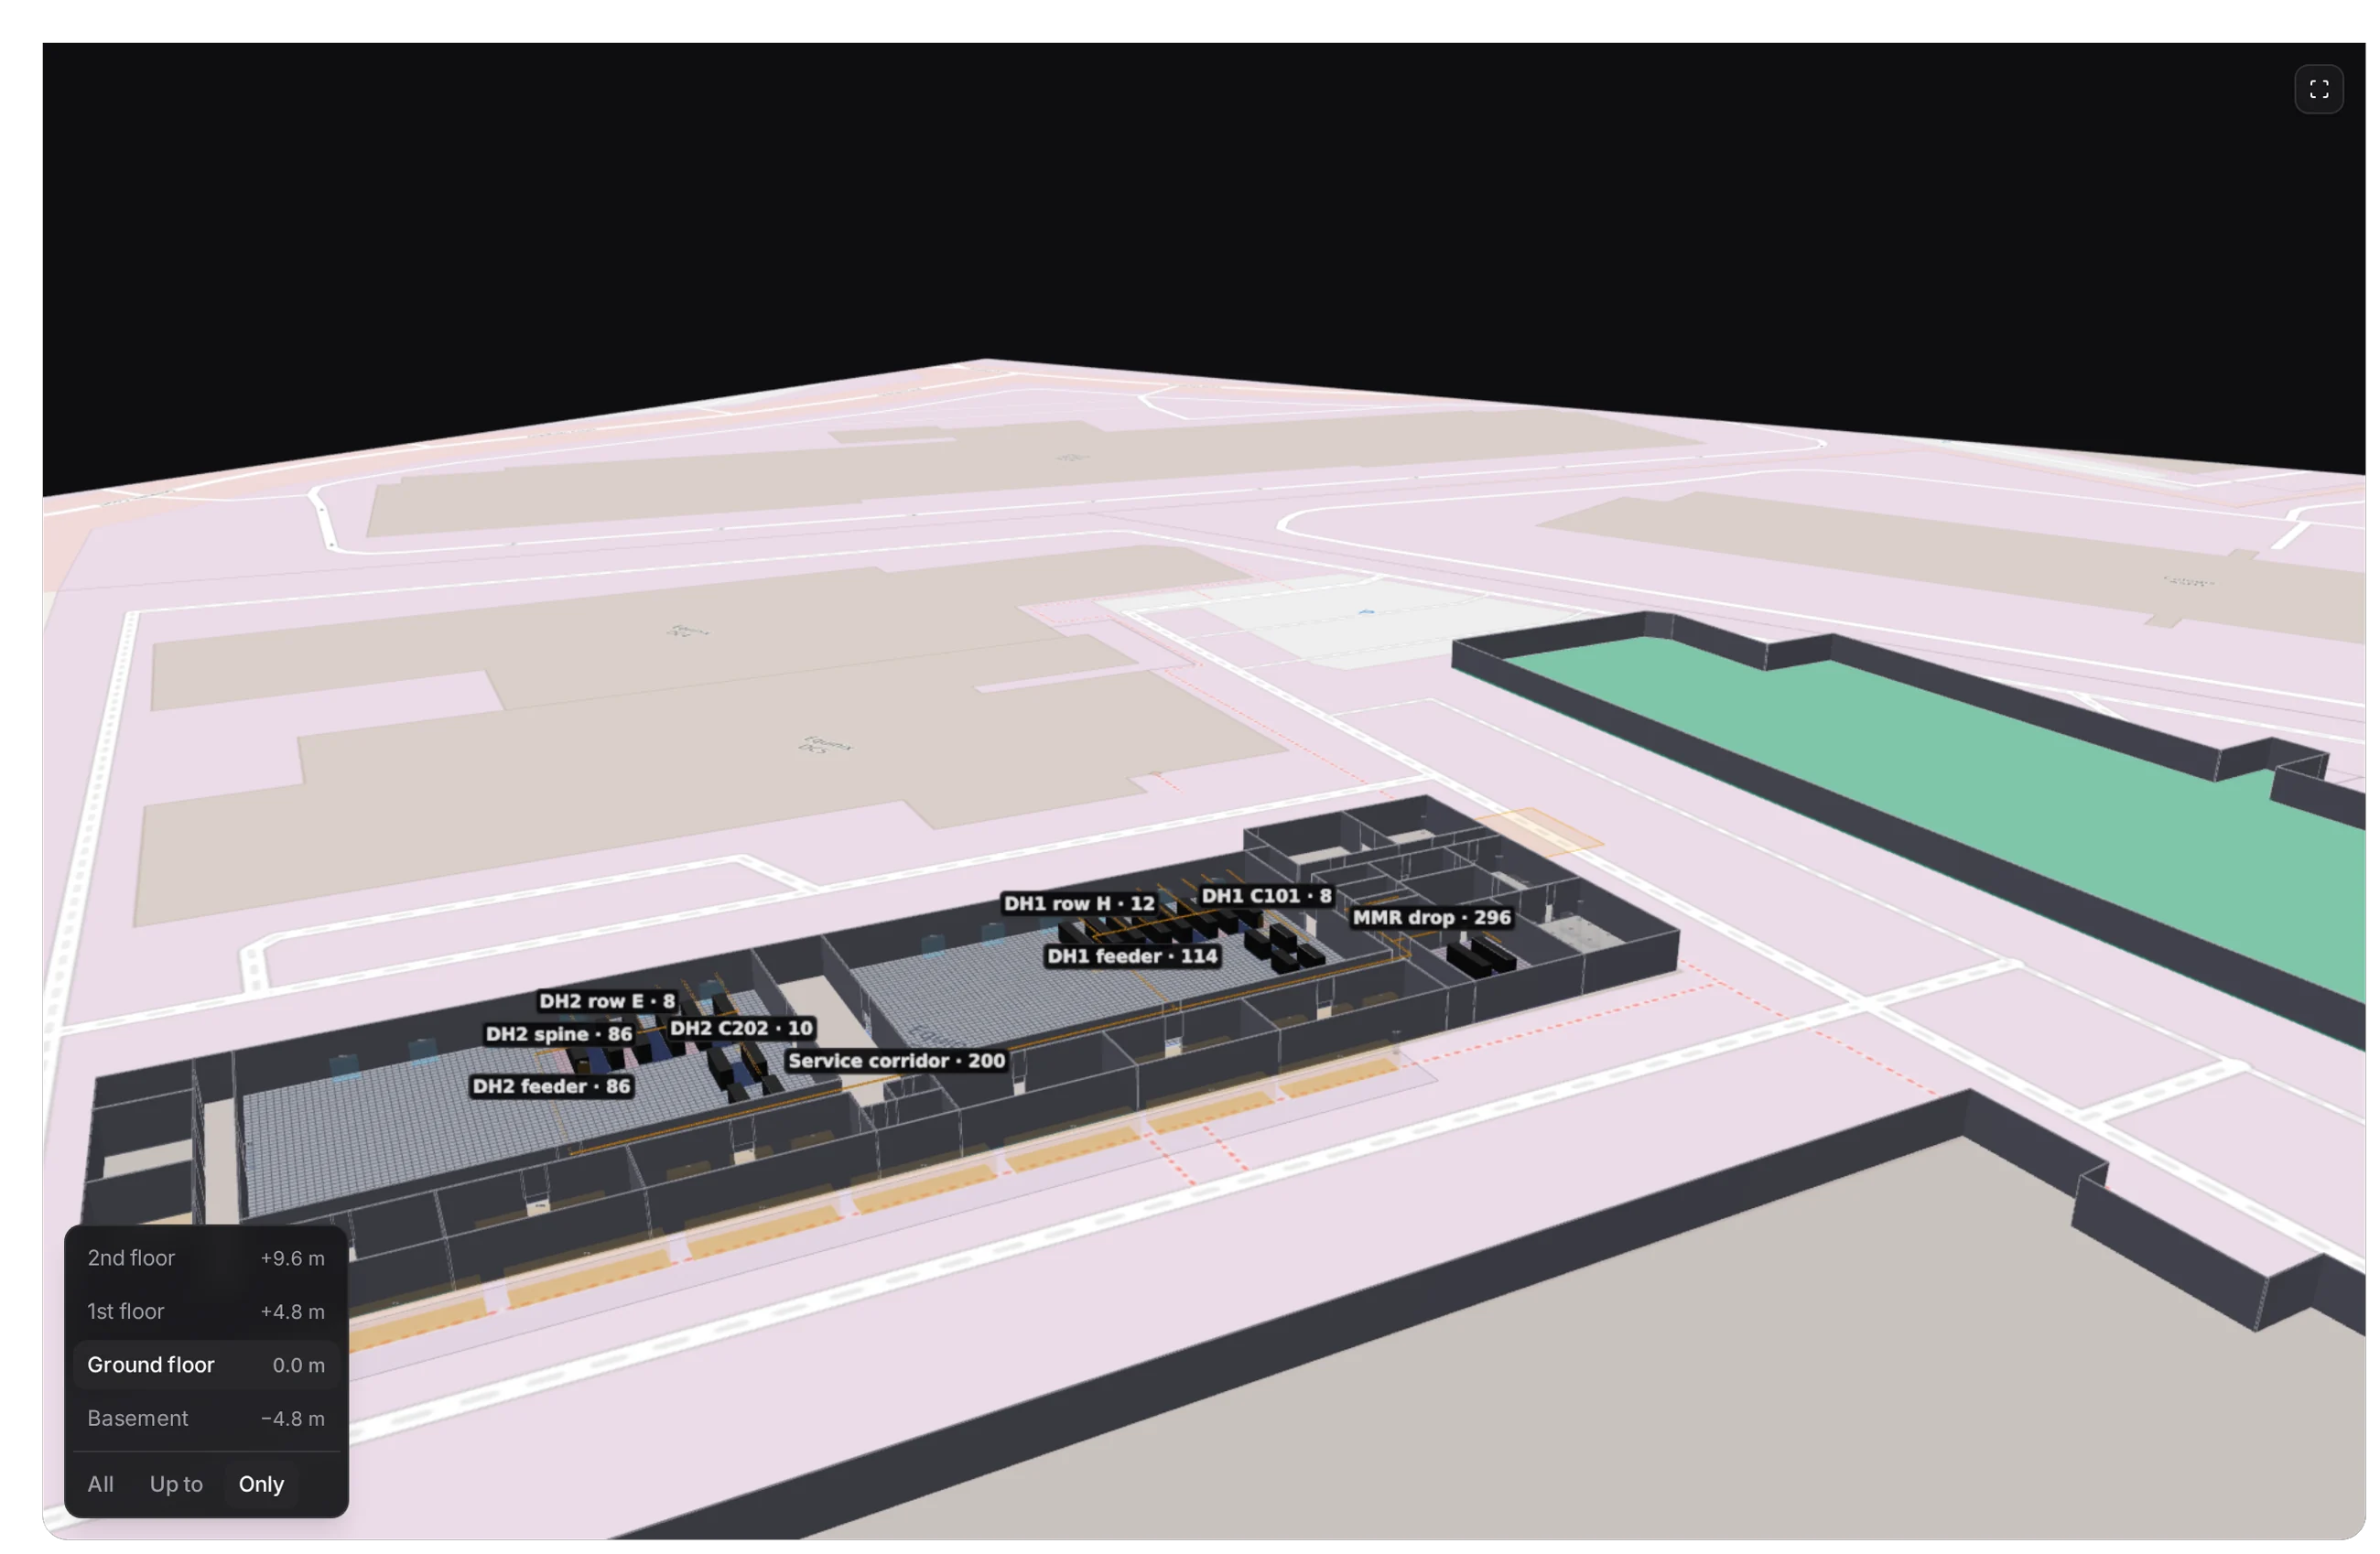
Detail panel layouts are set per device type, role, profile or tenant under Settings → Floor plans, and a room, location or area can be snapshotted as a cropped copy or a live view. One Export menu covers the view on screen, a room, an area, a floor or a whole building as a PDF, with a cable schedule, inventory and ports, using the same row names, callouts and summaries the canvas uses.
Two demo seeders are available and run nothing on upgrade: make seed-floorplan-demo TENANT=<slug> and make seed-building-demo TENANT=<slug>.
Rooms
A location holds rooms. The chain is Region, Site, Location, Room, so a comms room, a plant room or Room 210 on the second floor is a room instead of another nested location. Locations you nested as rooms before this stay as they are.
Devices, racks and cabinets name the room they stand in. The field sits under Location on all three forms, lists the rooms of the location you picked, and clears itself when you move the object elsewhere. Placing something on a floor plan, in a rack or in a cabinet never sets its room. Only a write that names the room does, and the floor plan offers you that write when an object lands inside another room's area. A room alone is enough on the API and on import: send room_id without a location and the object takes the room's. A room in another location comes back as Pick a room in <location>.
A room carries the code on the door (210, B1-07), a status, a colour, a description, photos, tags and custom fields, and renders as a badge in its own colour wherever it is named. Names are unique per location, so two buildings can each have a Room 210.
The room page opens on its details, then Devices, Racks and Cabinets, everything that names it. A room drawn as an area on a floor plan also gets a Floor plan tab: that part of the floor, live, with everything outside the outline dimmed, and Open in floor plan and Make snapshot… on it. A location's page lists its rooms on a Rooms tab.
Deleting a room keeps what stood in it, each device, rack and cabinet keeping its location. A location with rooms cannot be deleted, and a room with anything in it cannot move to another location. Rooms bulk-edit, bulk-delete, import and export like every other list, and the device, rack and cabinet files carry a room column resolved inside the row's location.
Lifecycle and installed software
Software & lifecycle → Lifecycle lists every device and VM against four end dates: hardware, operating system, support coverage and installed software. Soonest first. Chips count what falls in each window, facets narrow the list, the filters live in the address (/lifecycle?source=coverage&window=90), and it exports and saves as a view like any other list (#436).
Each date is a bar coloured by the time left, not by a percentage. The OS bar uses the platform's own dates or its endoflife.date cycle, and says which one it used. The Devices and Virtual machines lists get a Next end of life column sorted by days remaining.
Under that sits a catalog of the software you run: a domain, process and application tree, with an optional end-of-life product on each application. An application's page shows its path, its children with install counts, the groups it belongs to, and every cycle its installs are running. Devices and VMs get a Software tab and an overview card. Import, export and the API cover installed software too.
Application groups save the repetitive part. Assign a group such as RDS or SCADA to a device and it gets one install per member. Unassign it and the installs it created go away, while anything you edited stays. Add a member later and it lands on every host with that group. The Ansible inventory publishes both: each host lists its application_groups and applications, and every assigned group becomes an inventory group called app_group_<slug>.
Platforms can carry a target version and devices and VMs the version they are on, written as 17.9.4a · target 17.9.5, with a list column, a filter and a compliance check that fails anything off target (#395). vCenter reads the ESXi version when Read host hardware is on, and never overwrites a version somebody typed.
Where a version came from is recorded: manual, SNMP, virtualization, Oxidized or import, with the time an integration last set it (#451). SNMP reads it out of sysDescr for IOS, IOS-XE, NX-OS, Junos and EOS, or by a pattern per platform, and manage.py extract_software_versions re-reads facts you already have. Lifecycle has a Versions view: version by platform, with counts, on-target state and sources.
Device profiles hand a device or VM its application groups, tags, platform and blank custom fields in one assignment, and take them back when you unassign.
Deploy pipelines
A pipeline runs automation targets one after another against a device or VM. A failed step stops the rest unless you set it to carry on. A pipeline can be a device role's default, can run on change, and exports and imports as YAML.
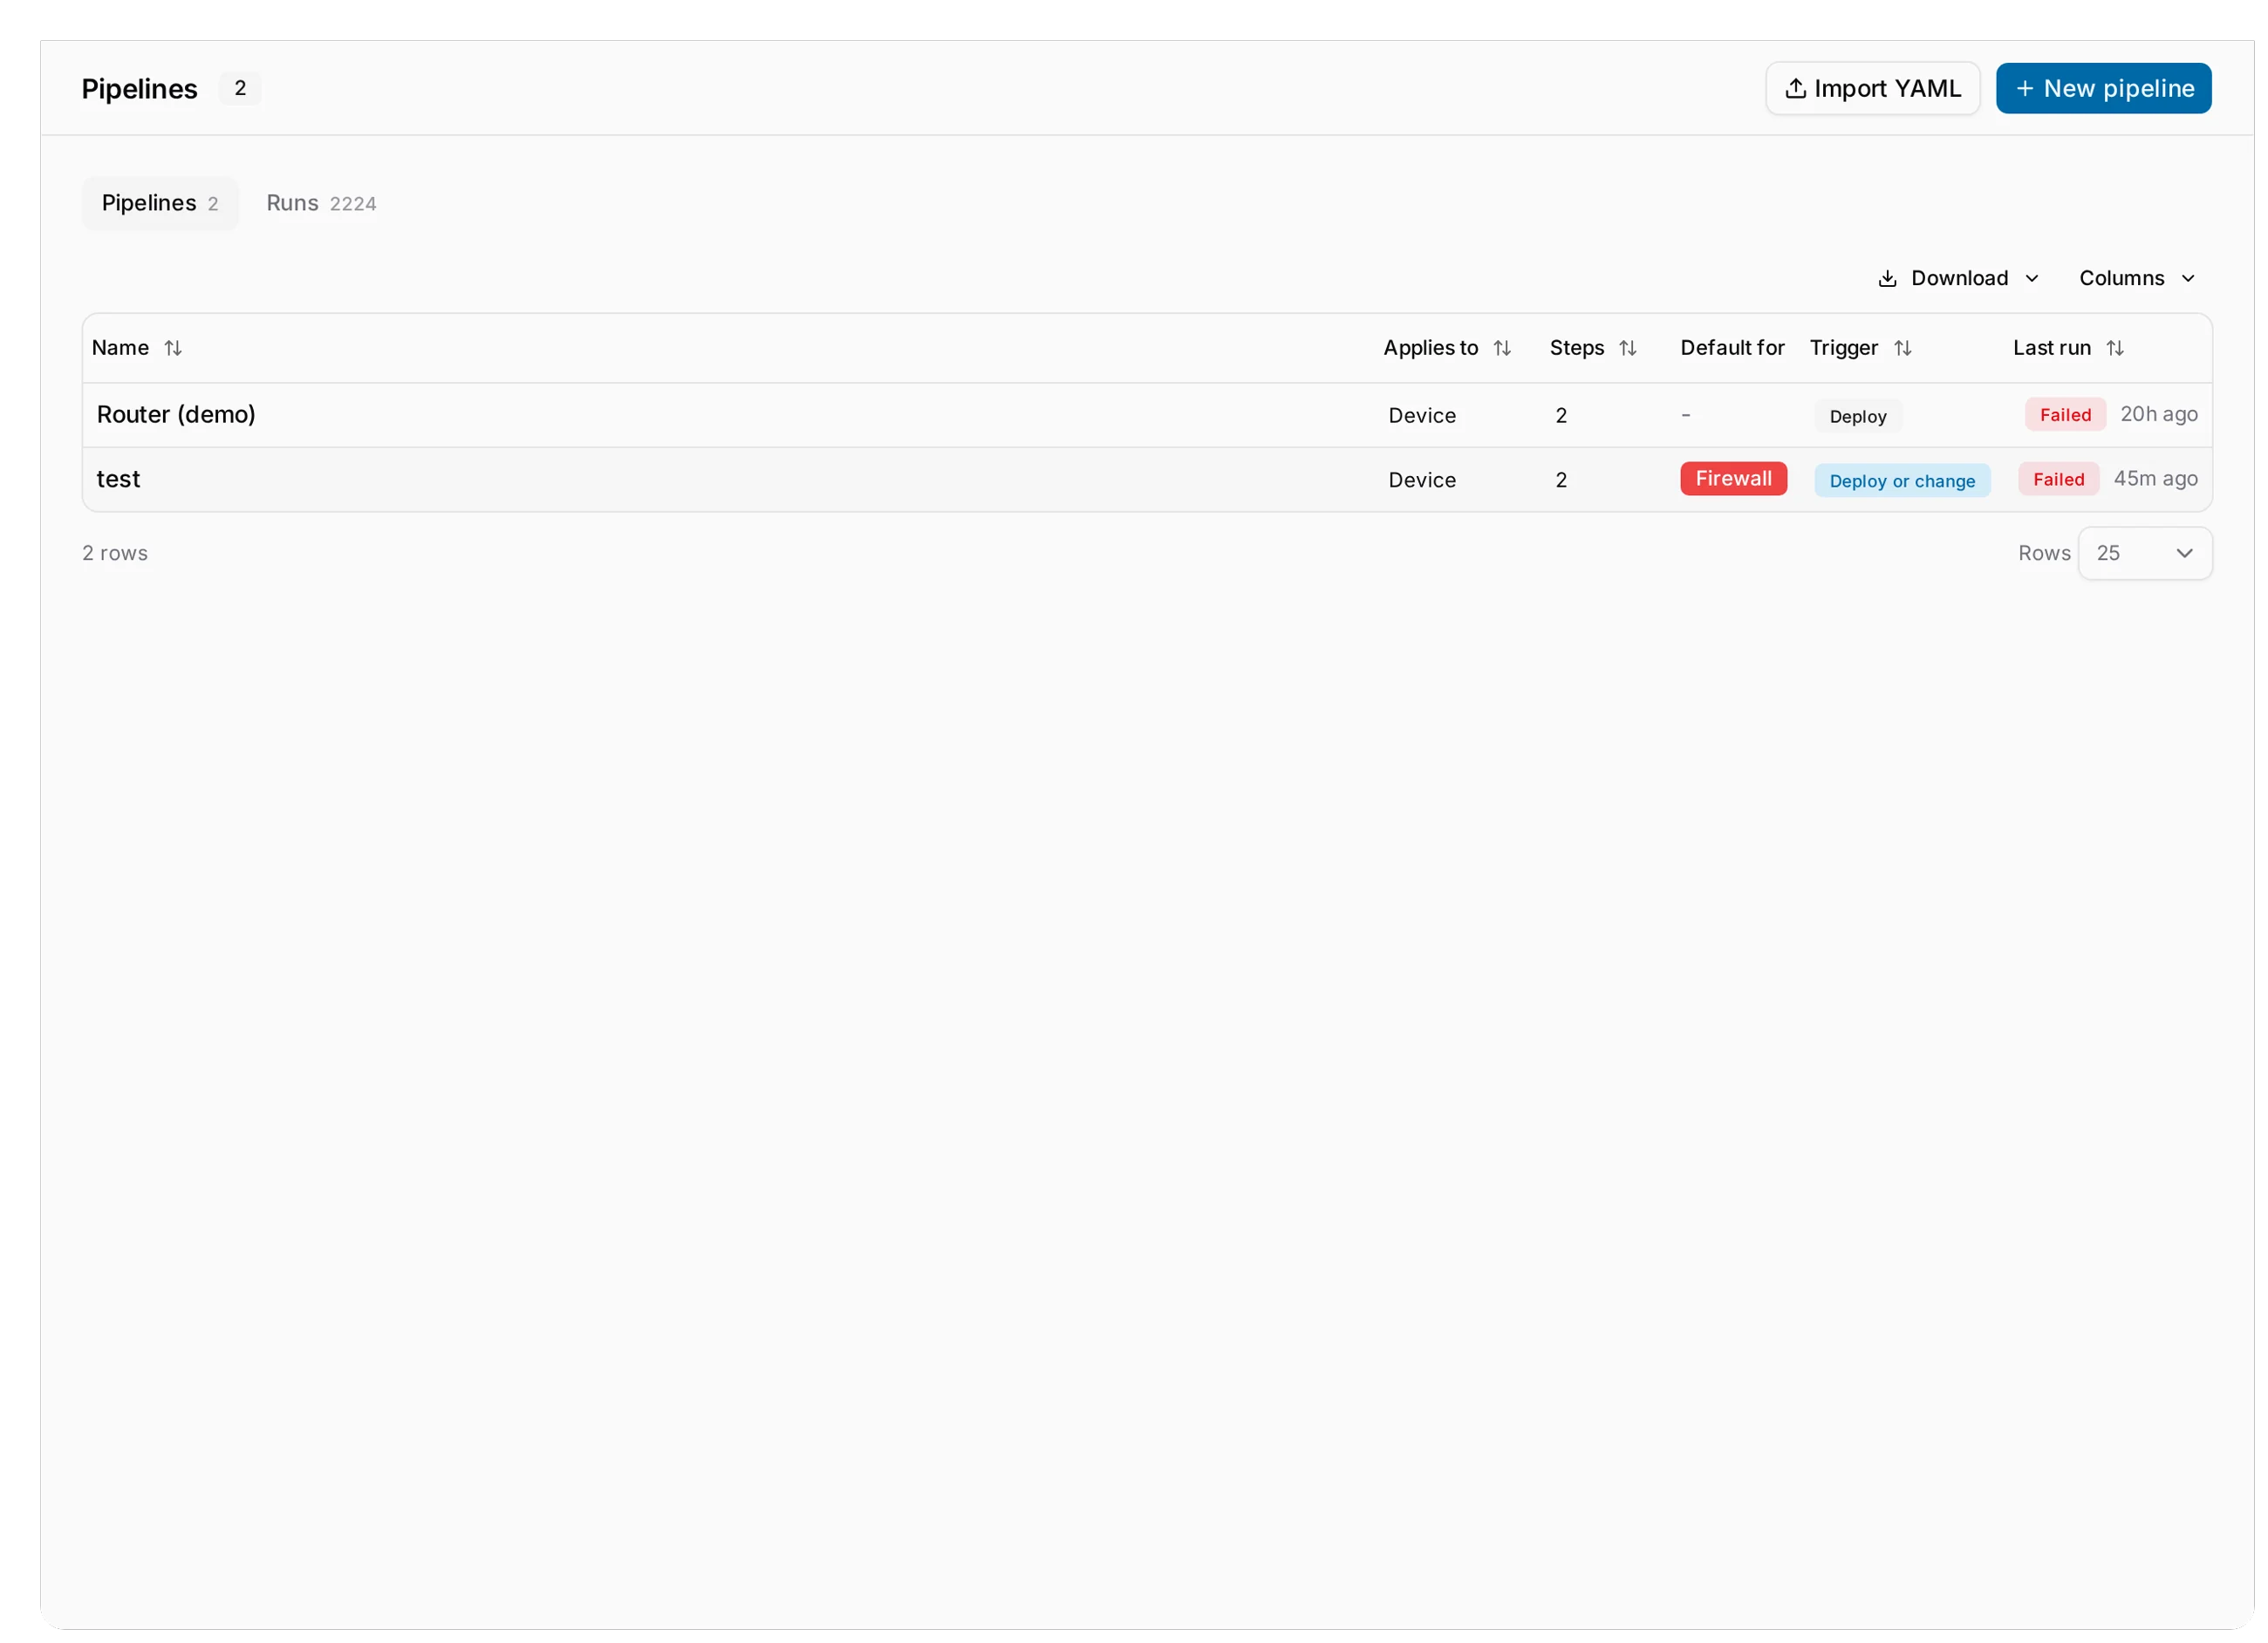
 Two pipelines, with their steps, triggers and last run.
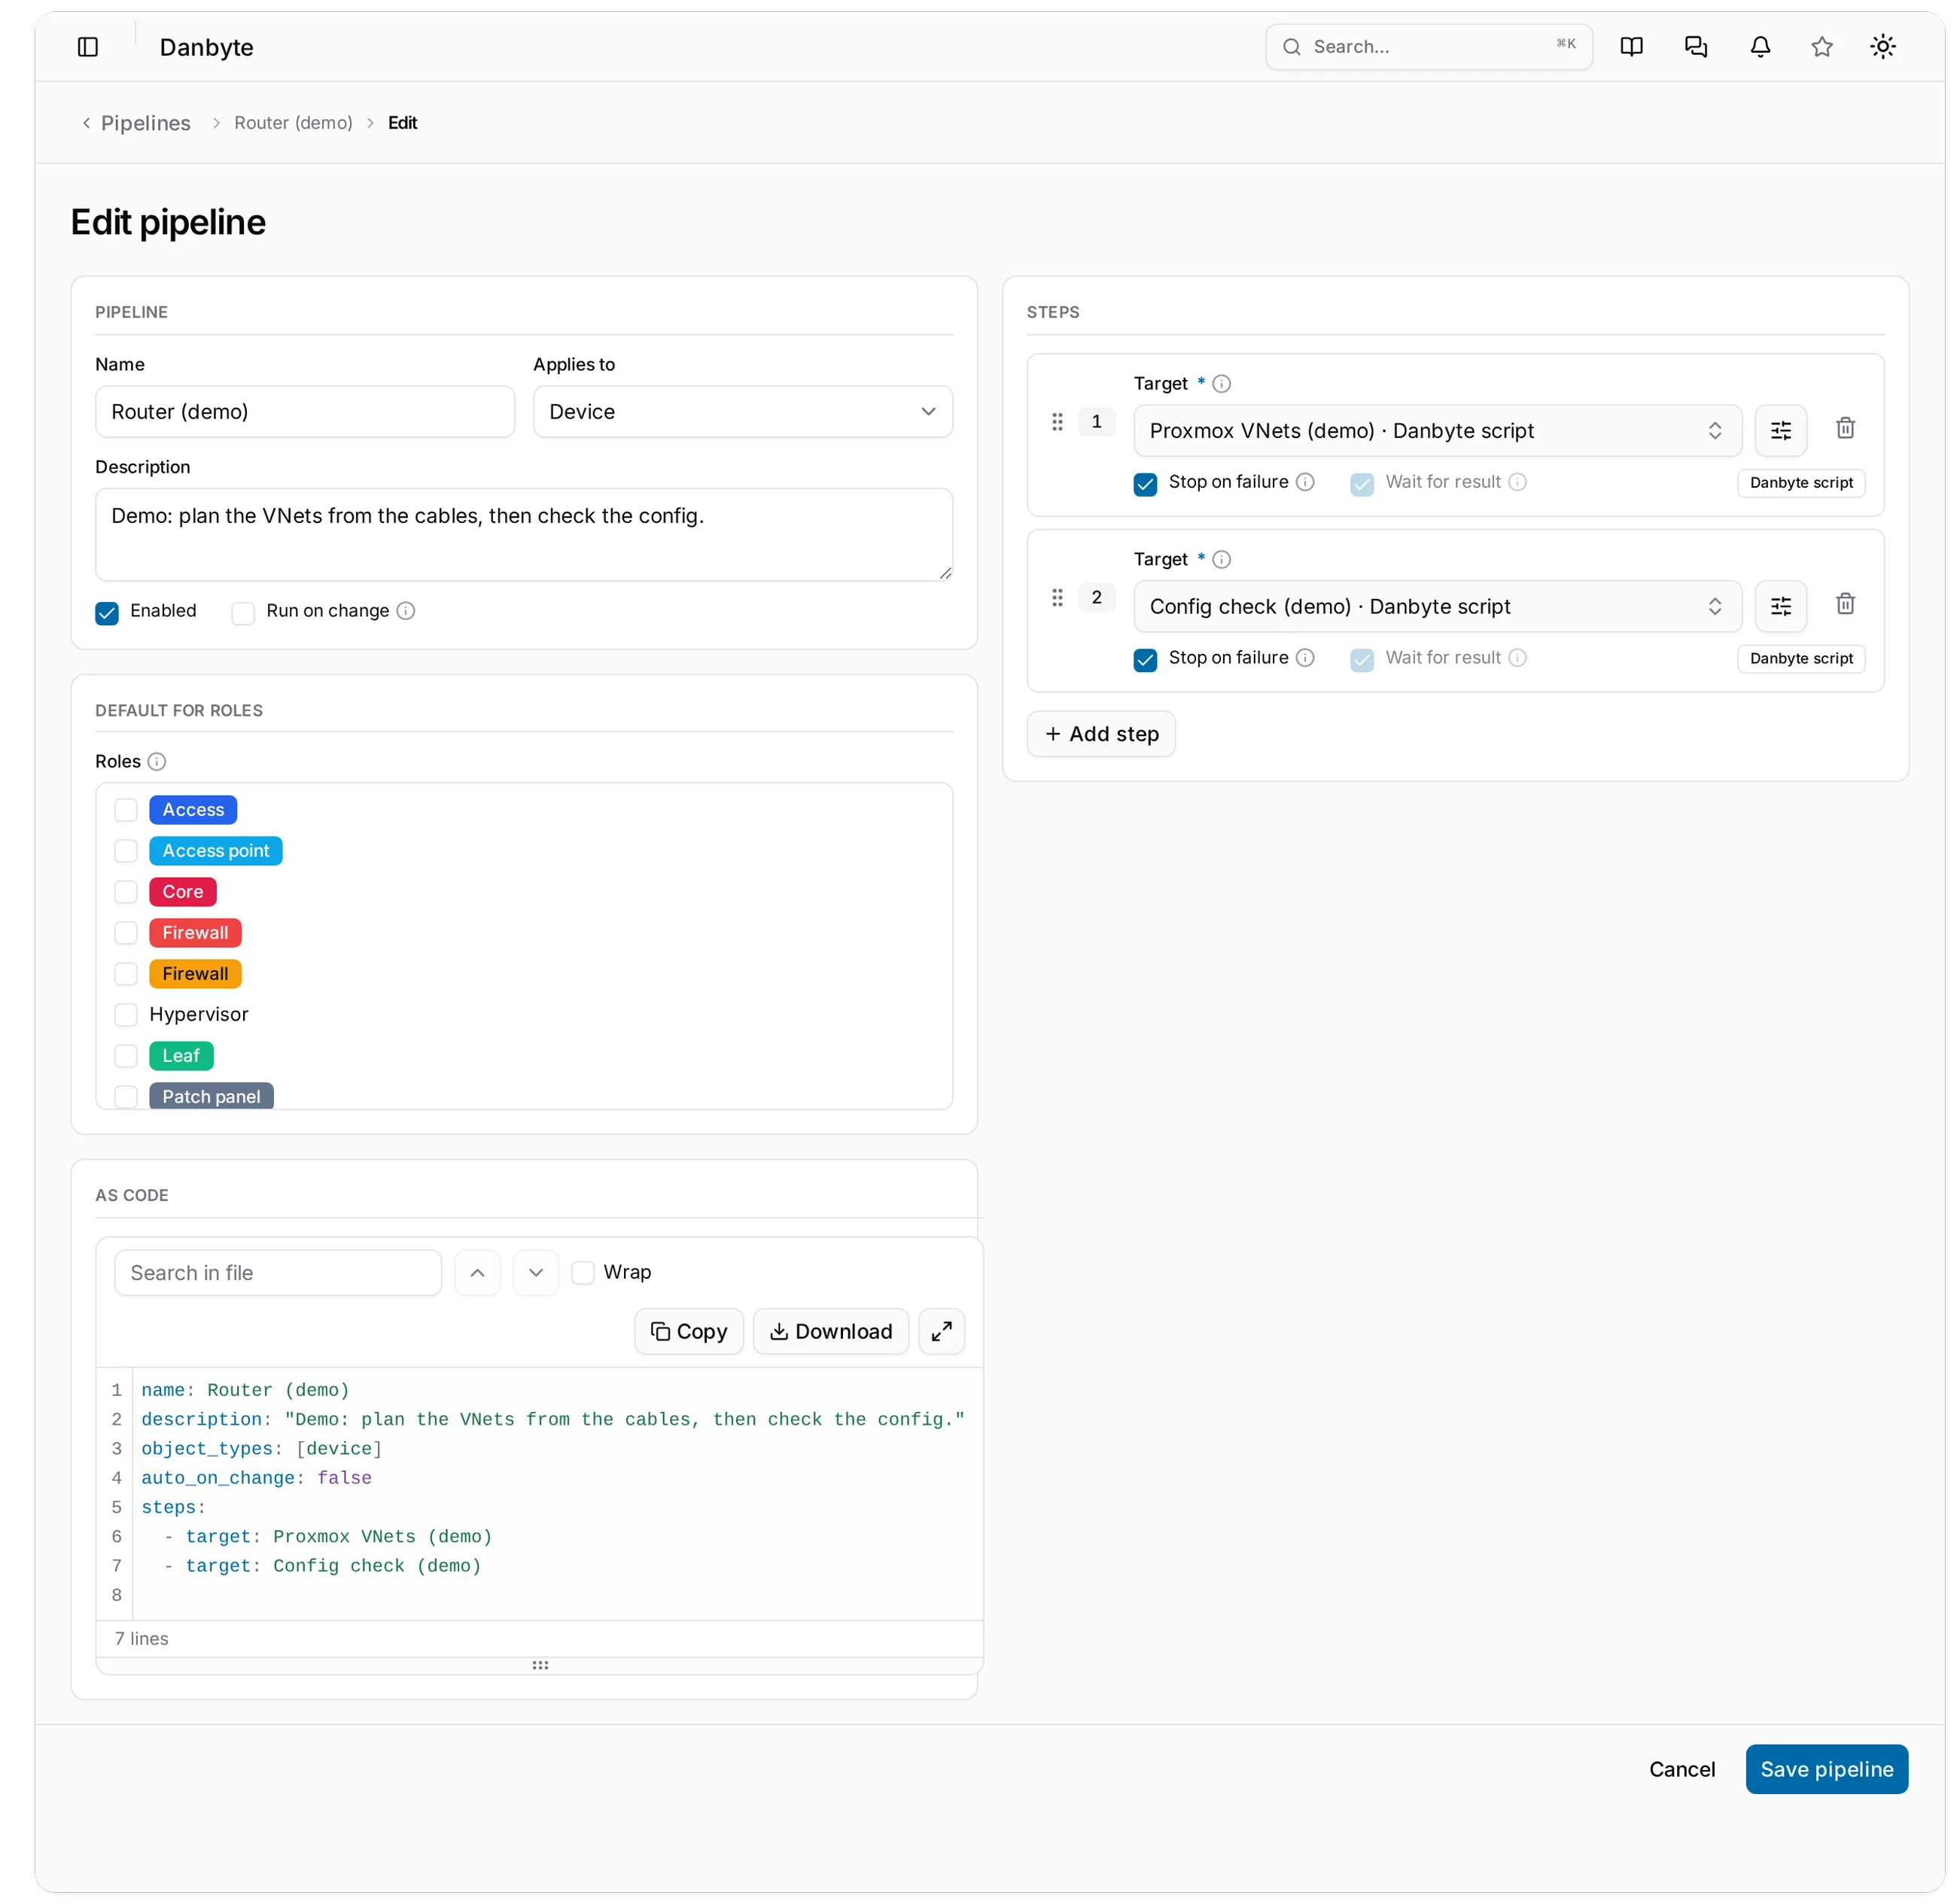
 The editor, with the YAML for the same pipeline under it.
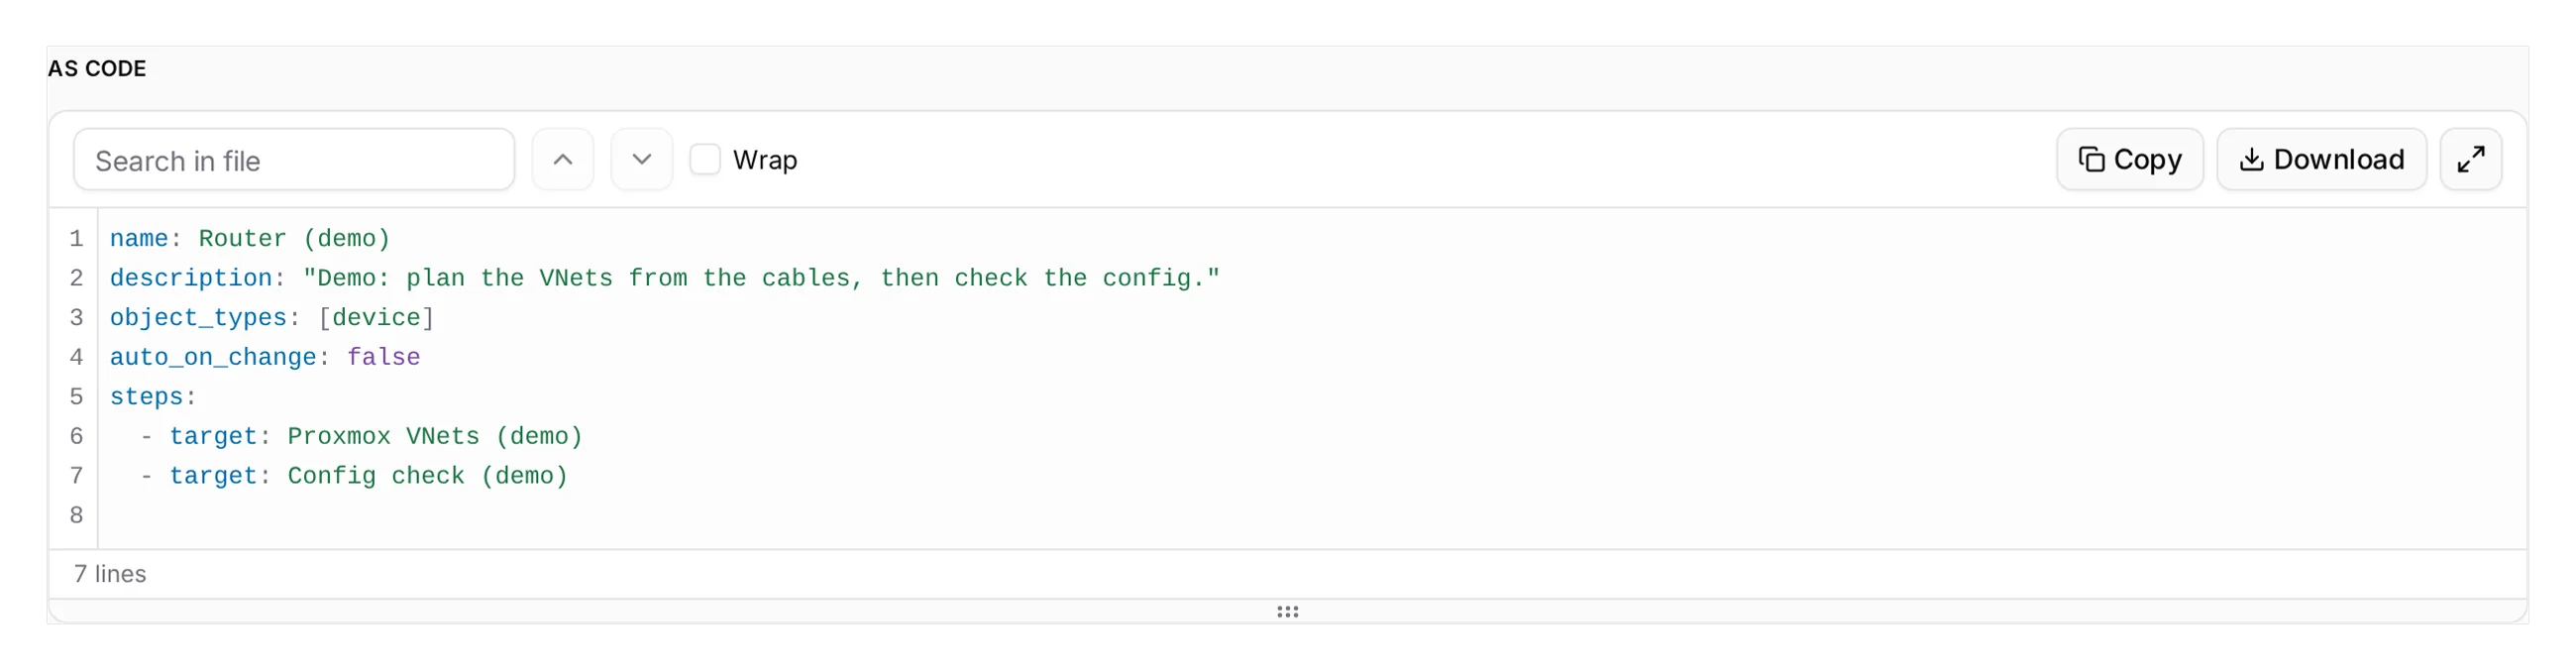
 The same pipeline as a file.
A Danbyte script is a deploy target when it declares a device_ids parameter, and the deploy run links to it.
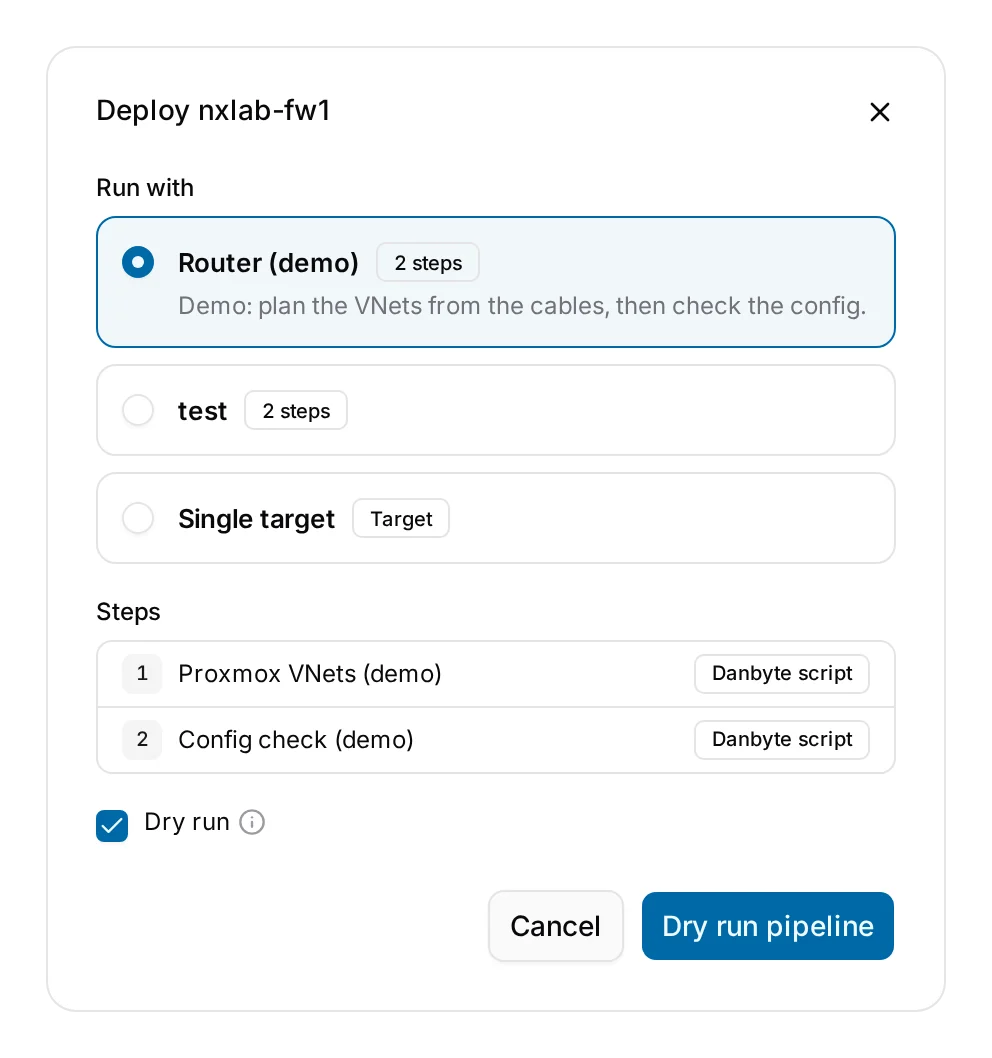
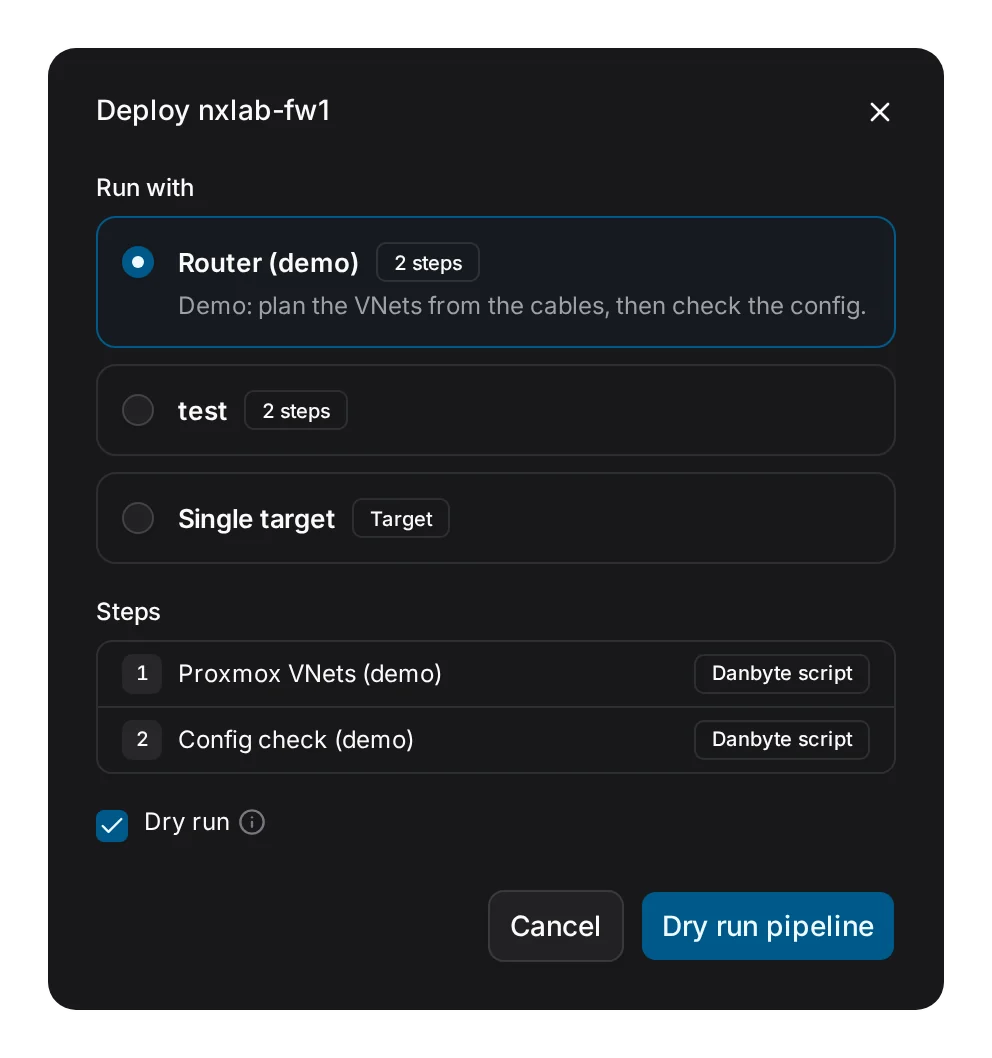
Deploy, or dry run
Deploy lists the pipelines that fit the device, or a single target, shows the steps it will run, and has a Dry run tick.
A dry run goes through every step and changes nothing on the device.
The run page shows each step's status, log and output files, with Cancel run and Re-run. Runners can report back to POST /api/deploy-runs/<id>/result/, signed with the webhook target's secret, and a step set to Wait for result waits up to its timeout. manage.py seed_pipeline_demo --tenant <slug> sets up a demo if you want one.
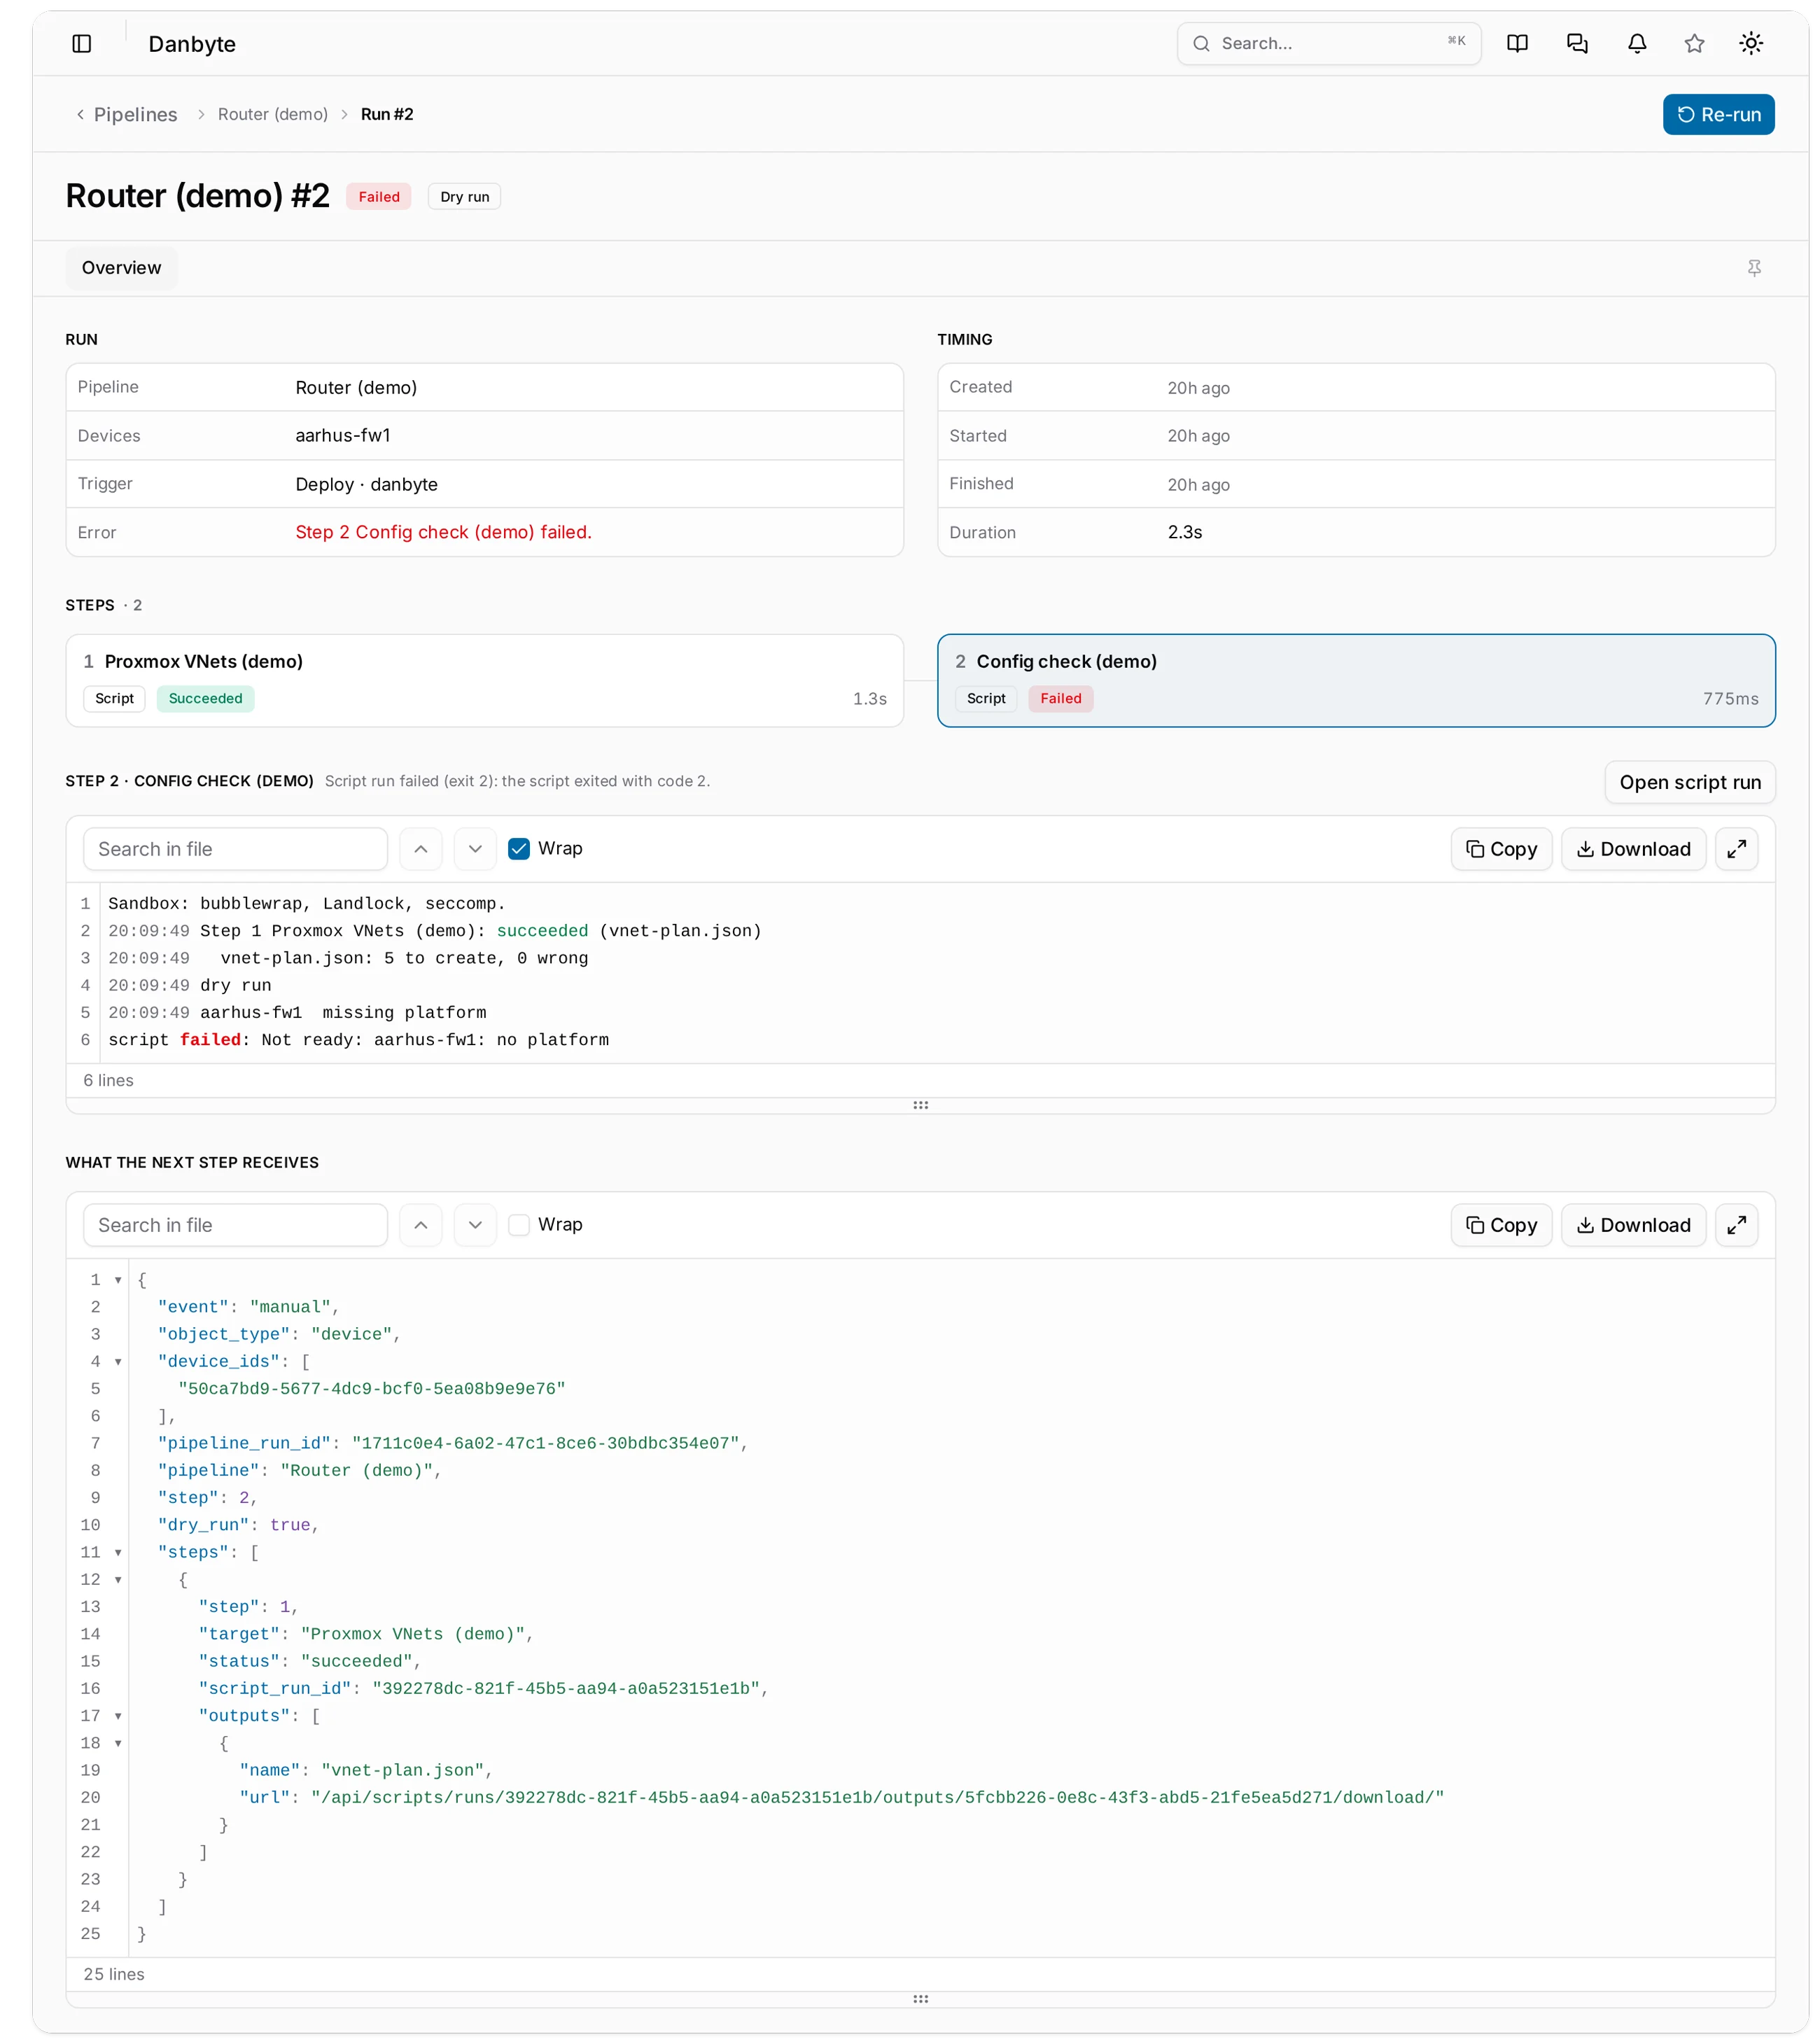
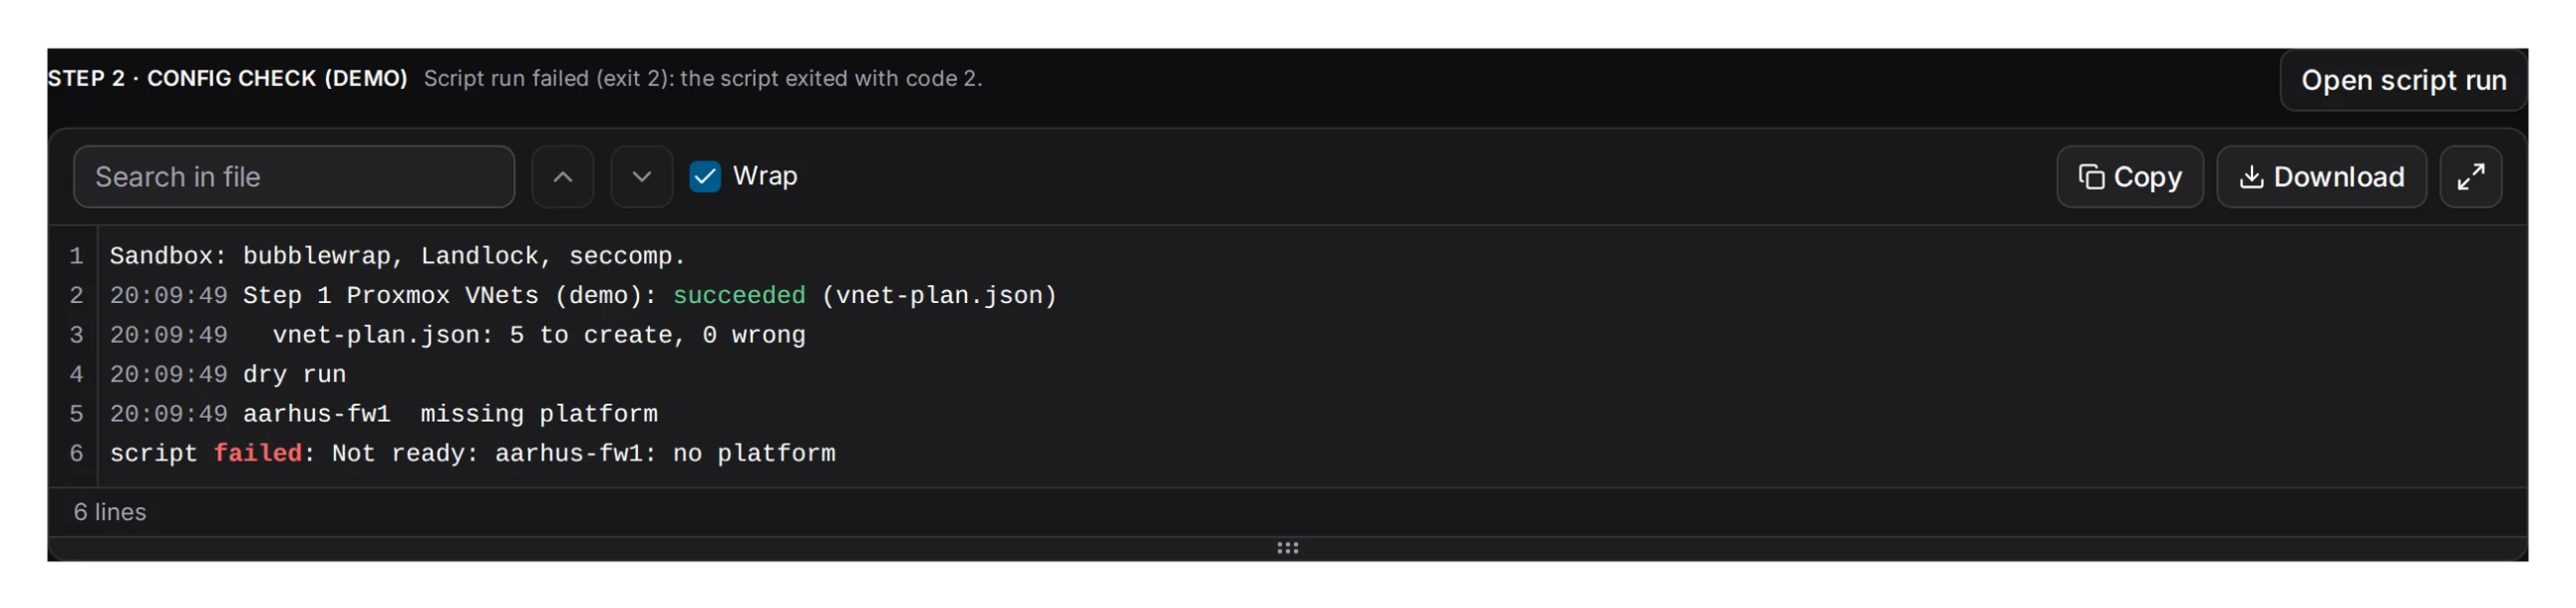
 A dry run that stopped at step 2, with the reason in the log.


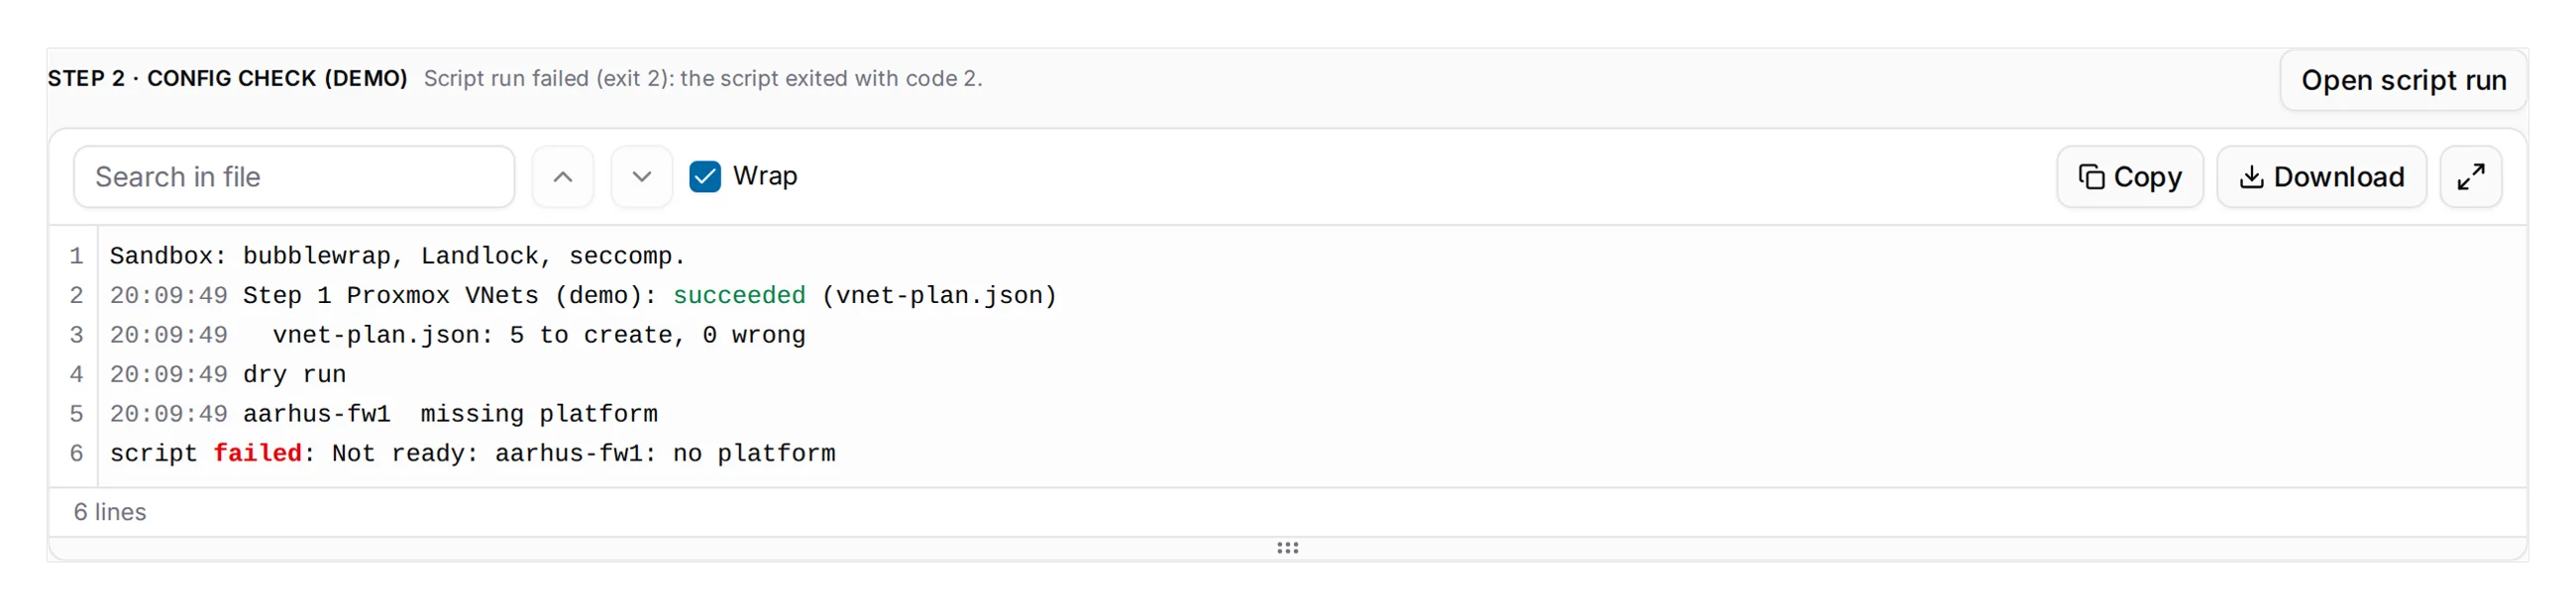
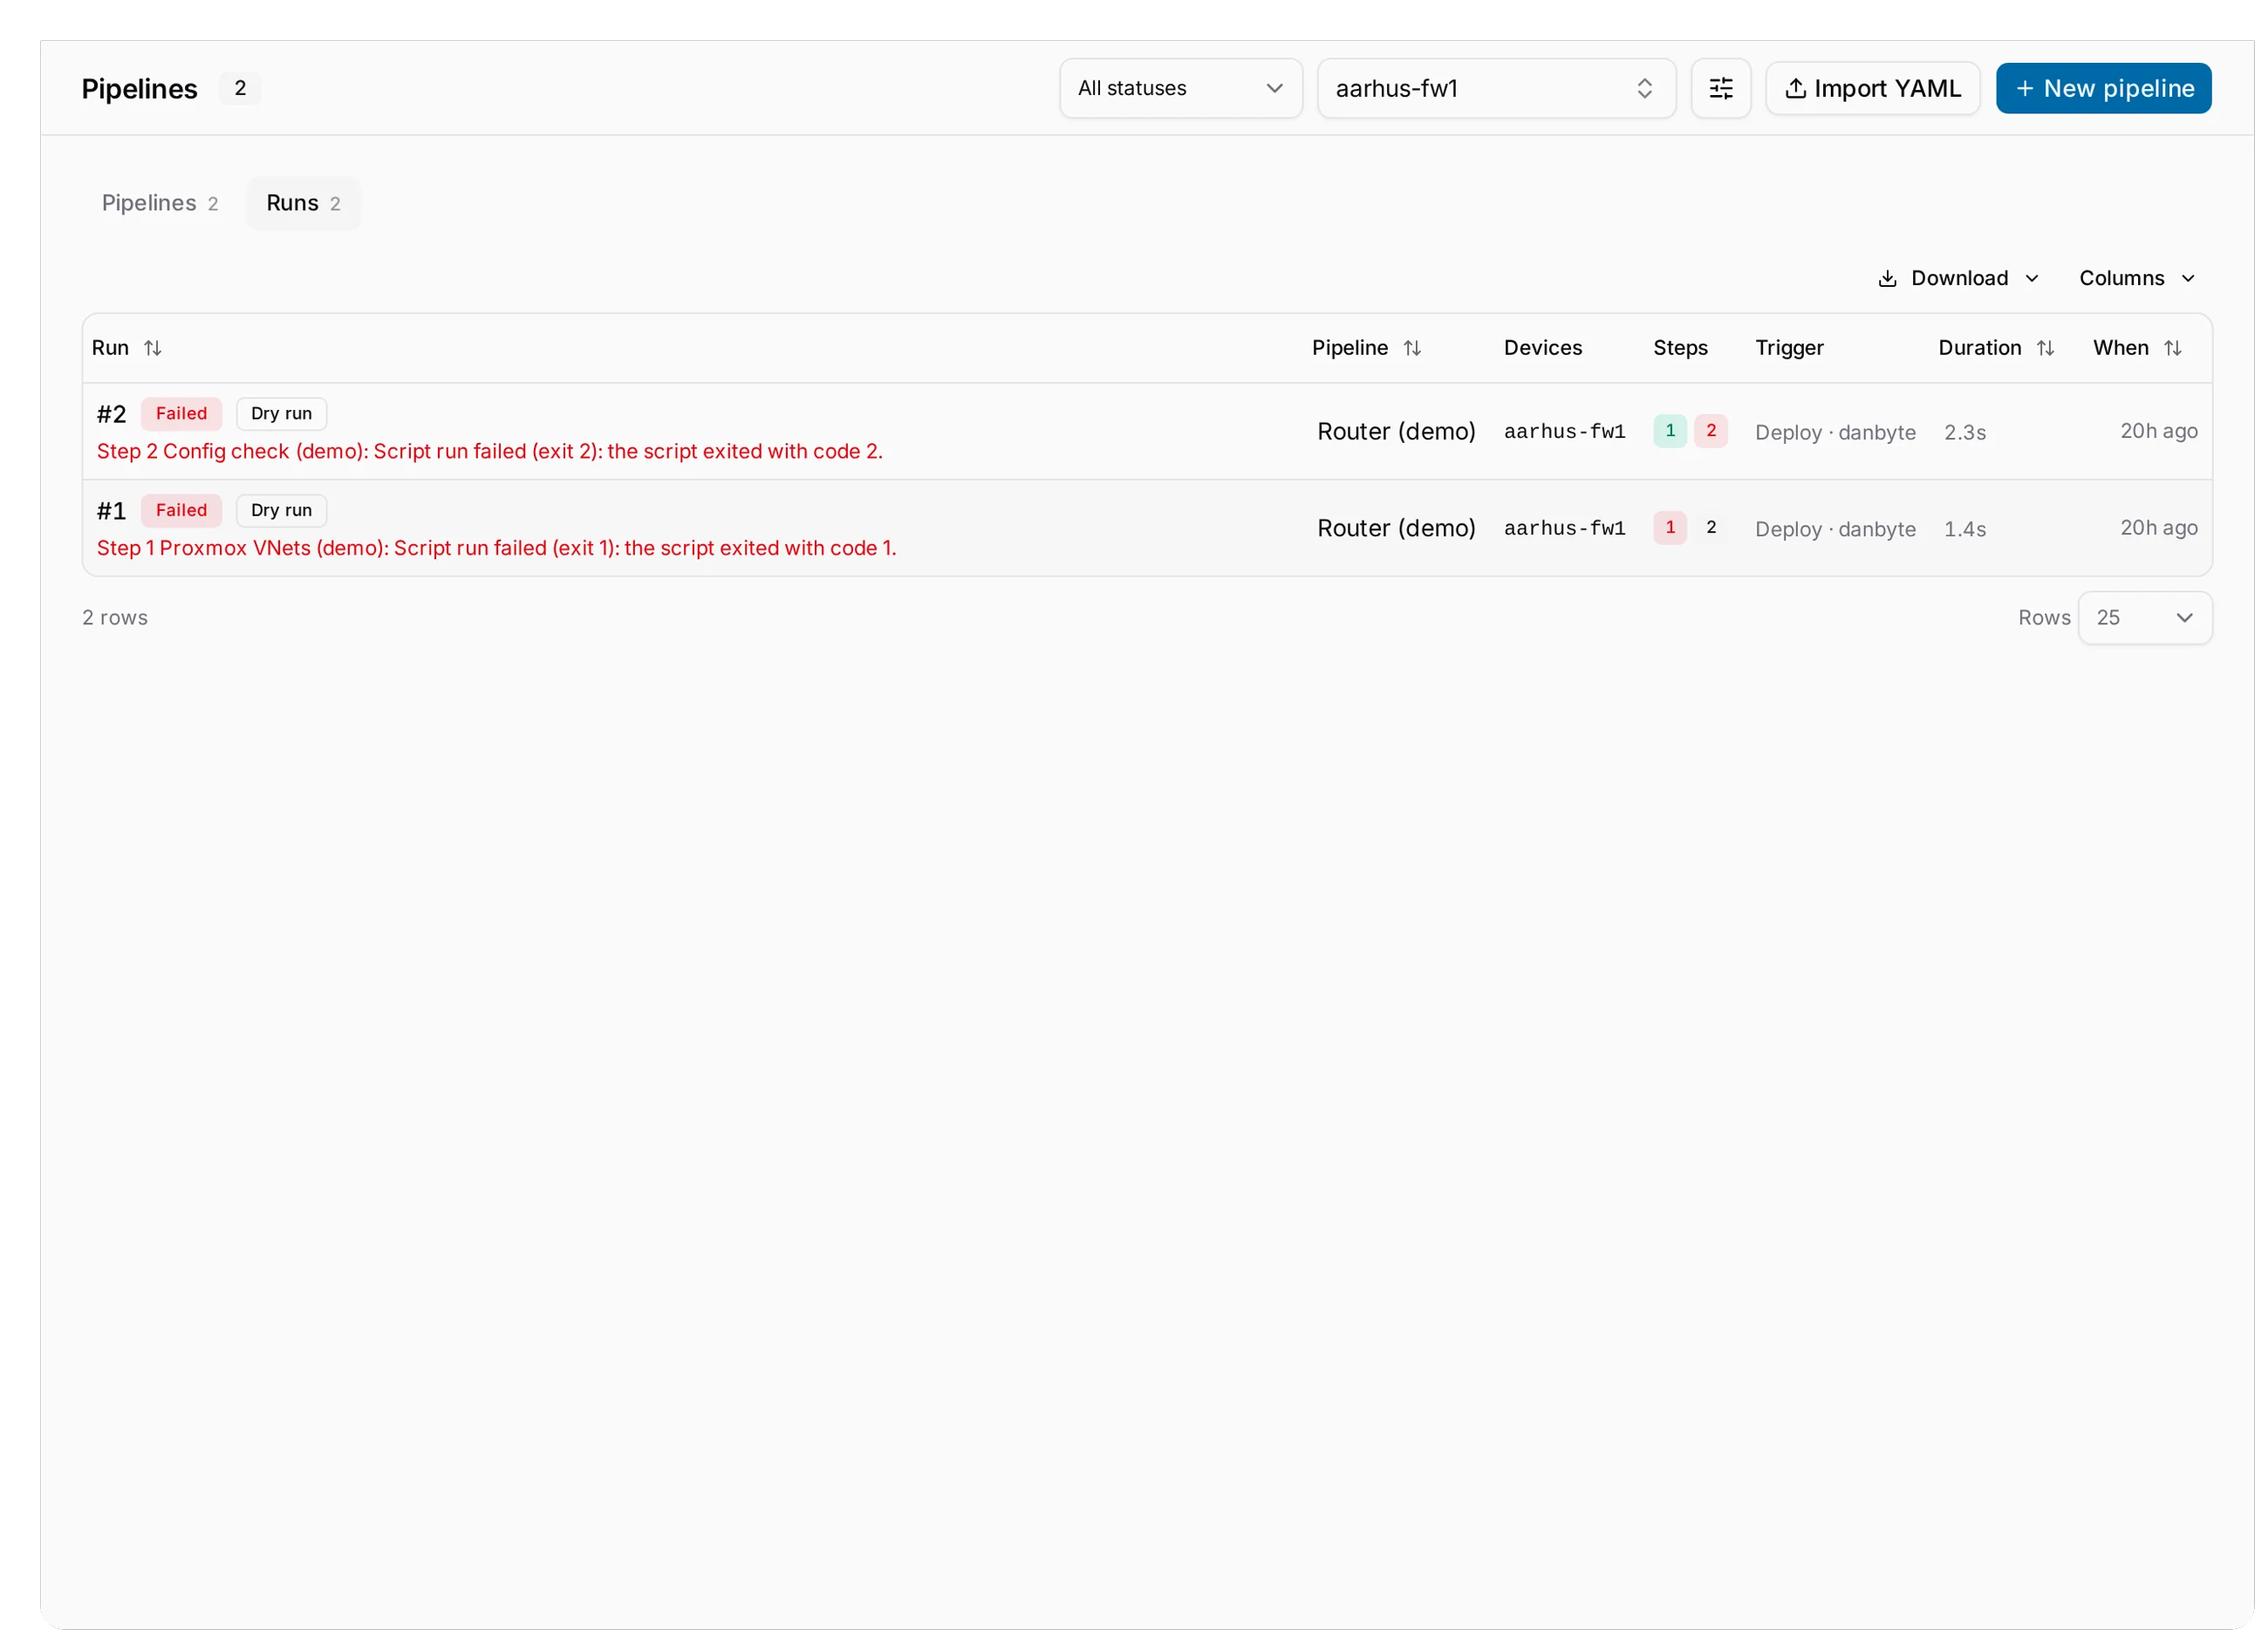
 Runs, with the reason for a failure on the row itself.
The file viewer on the Config tab
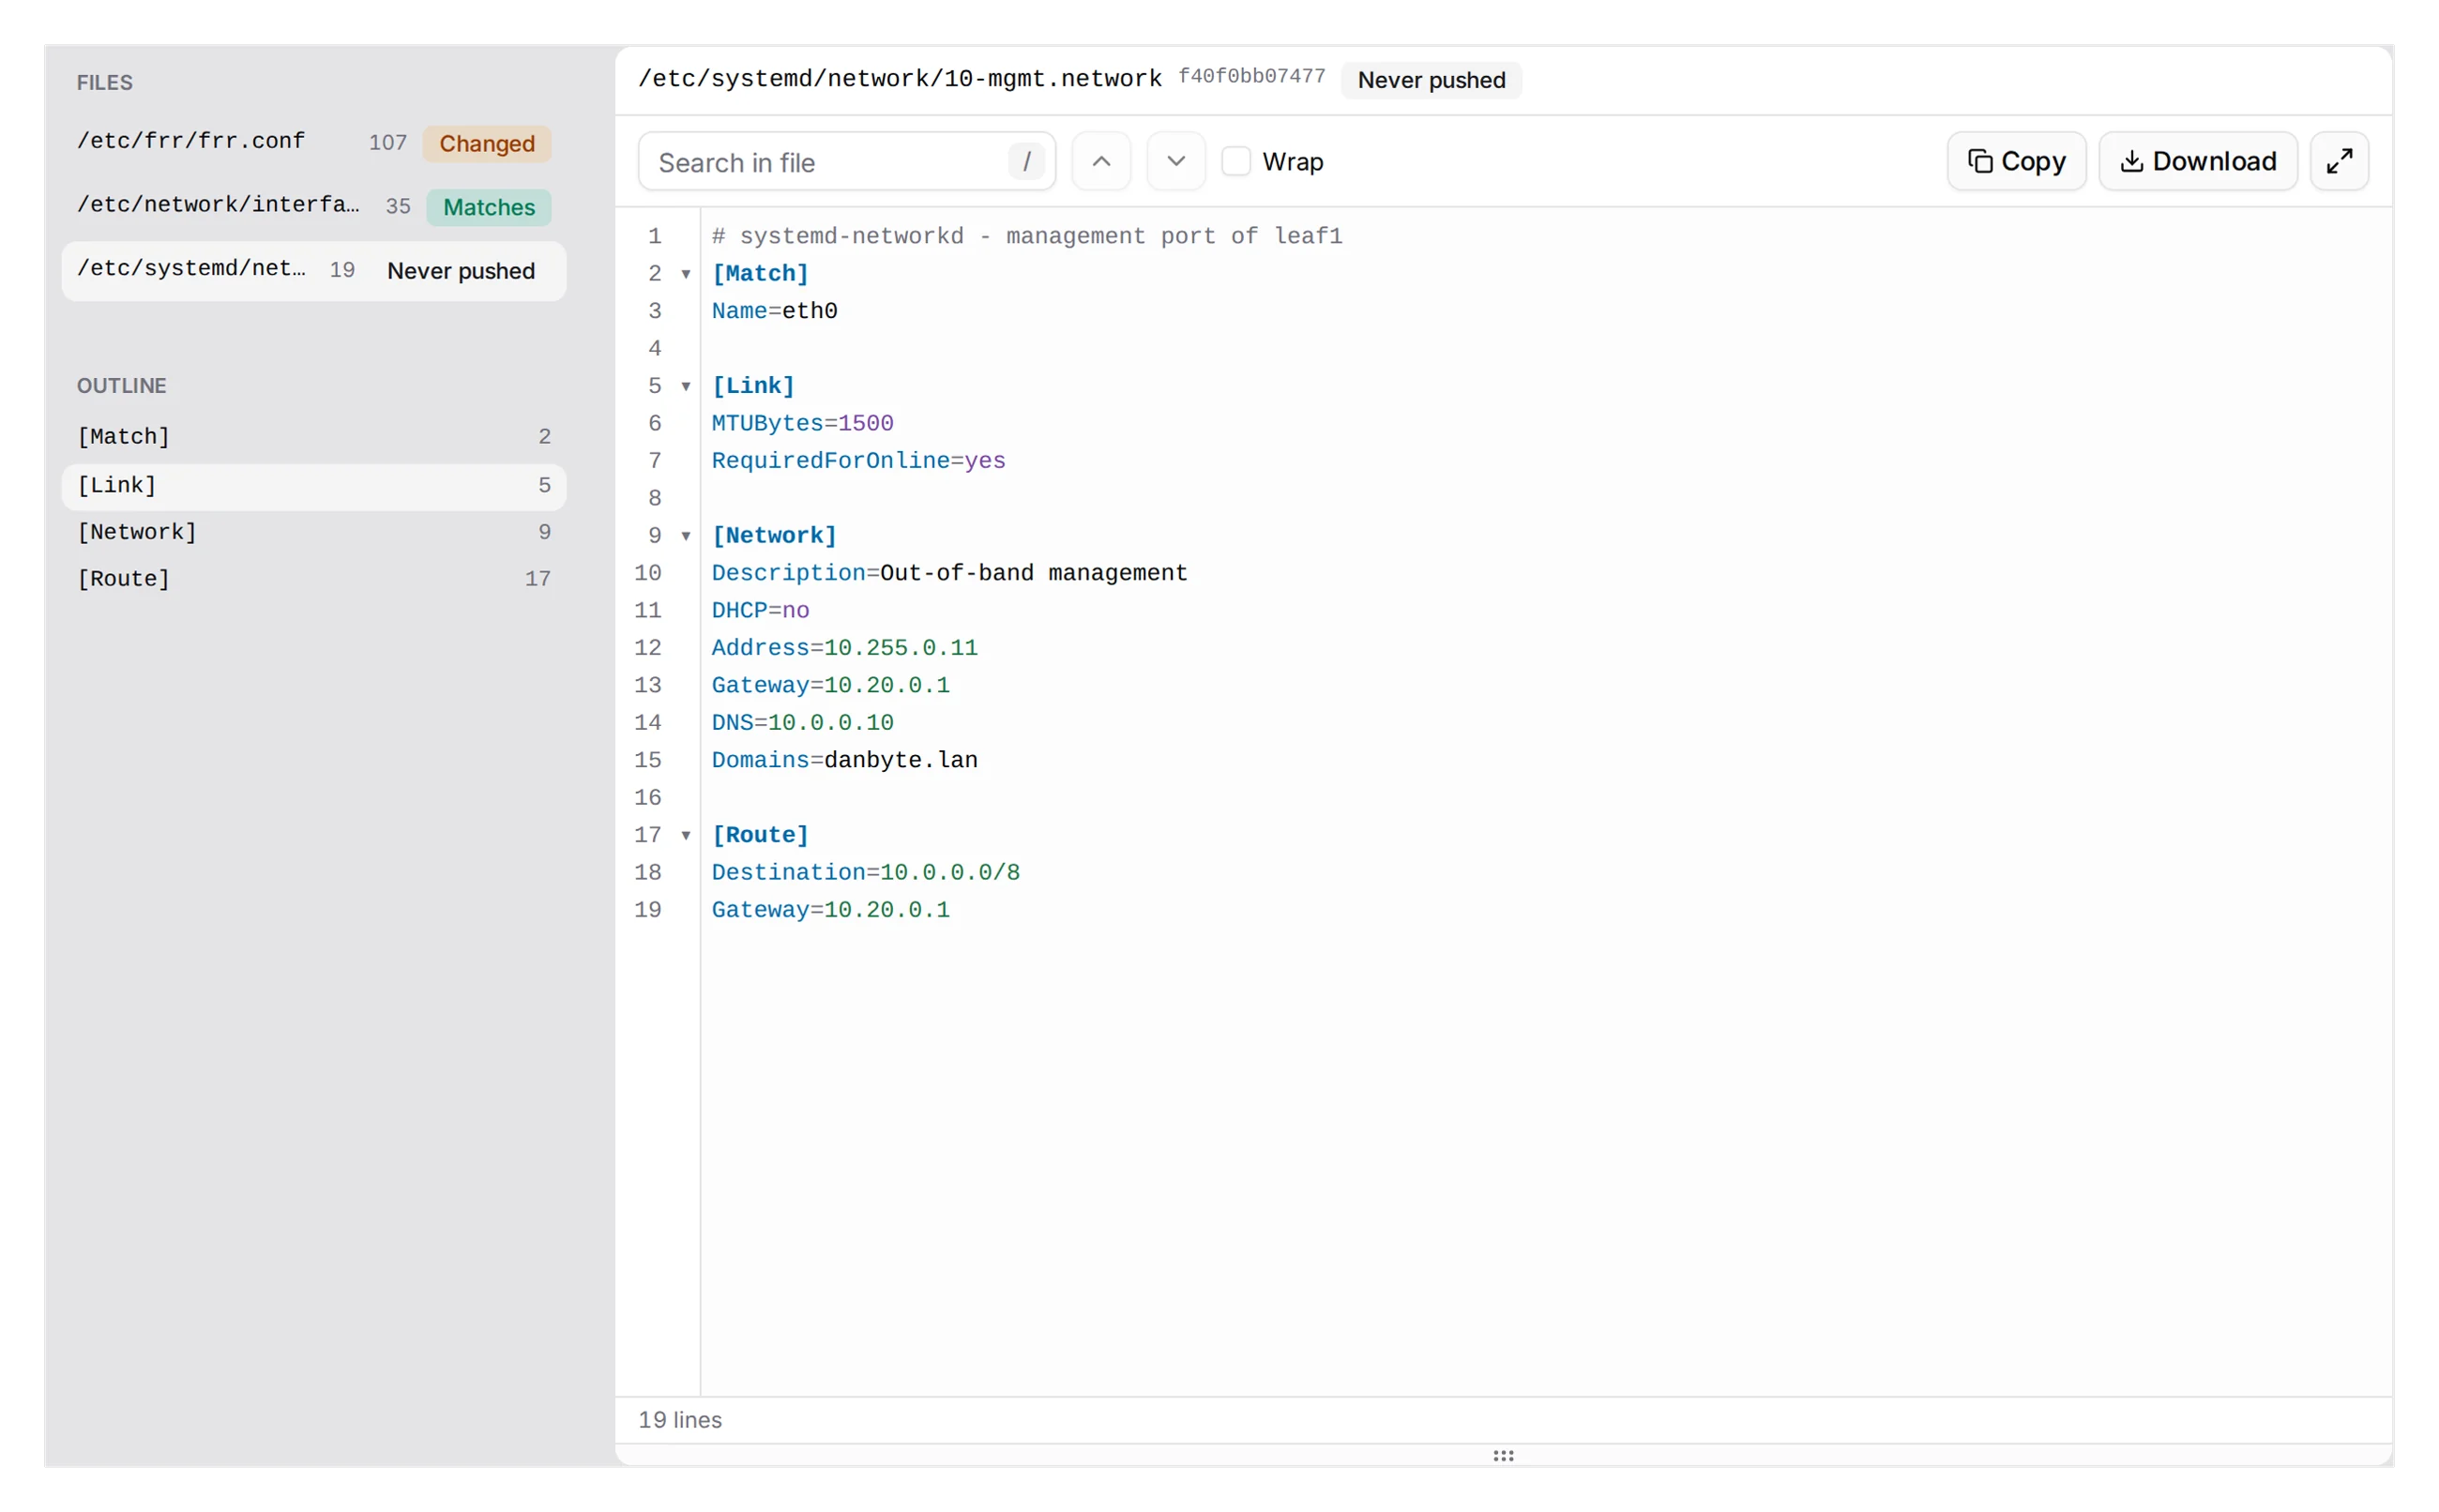
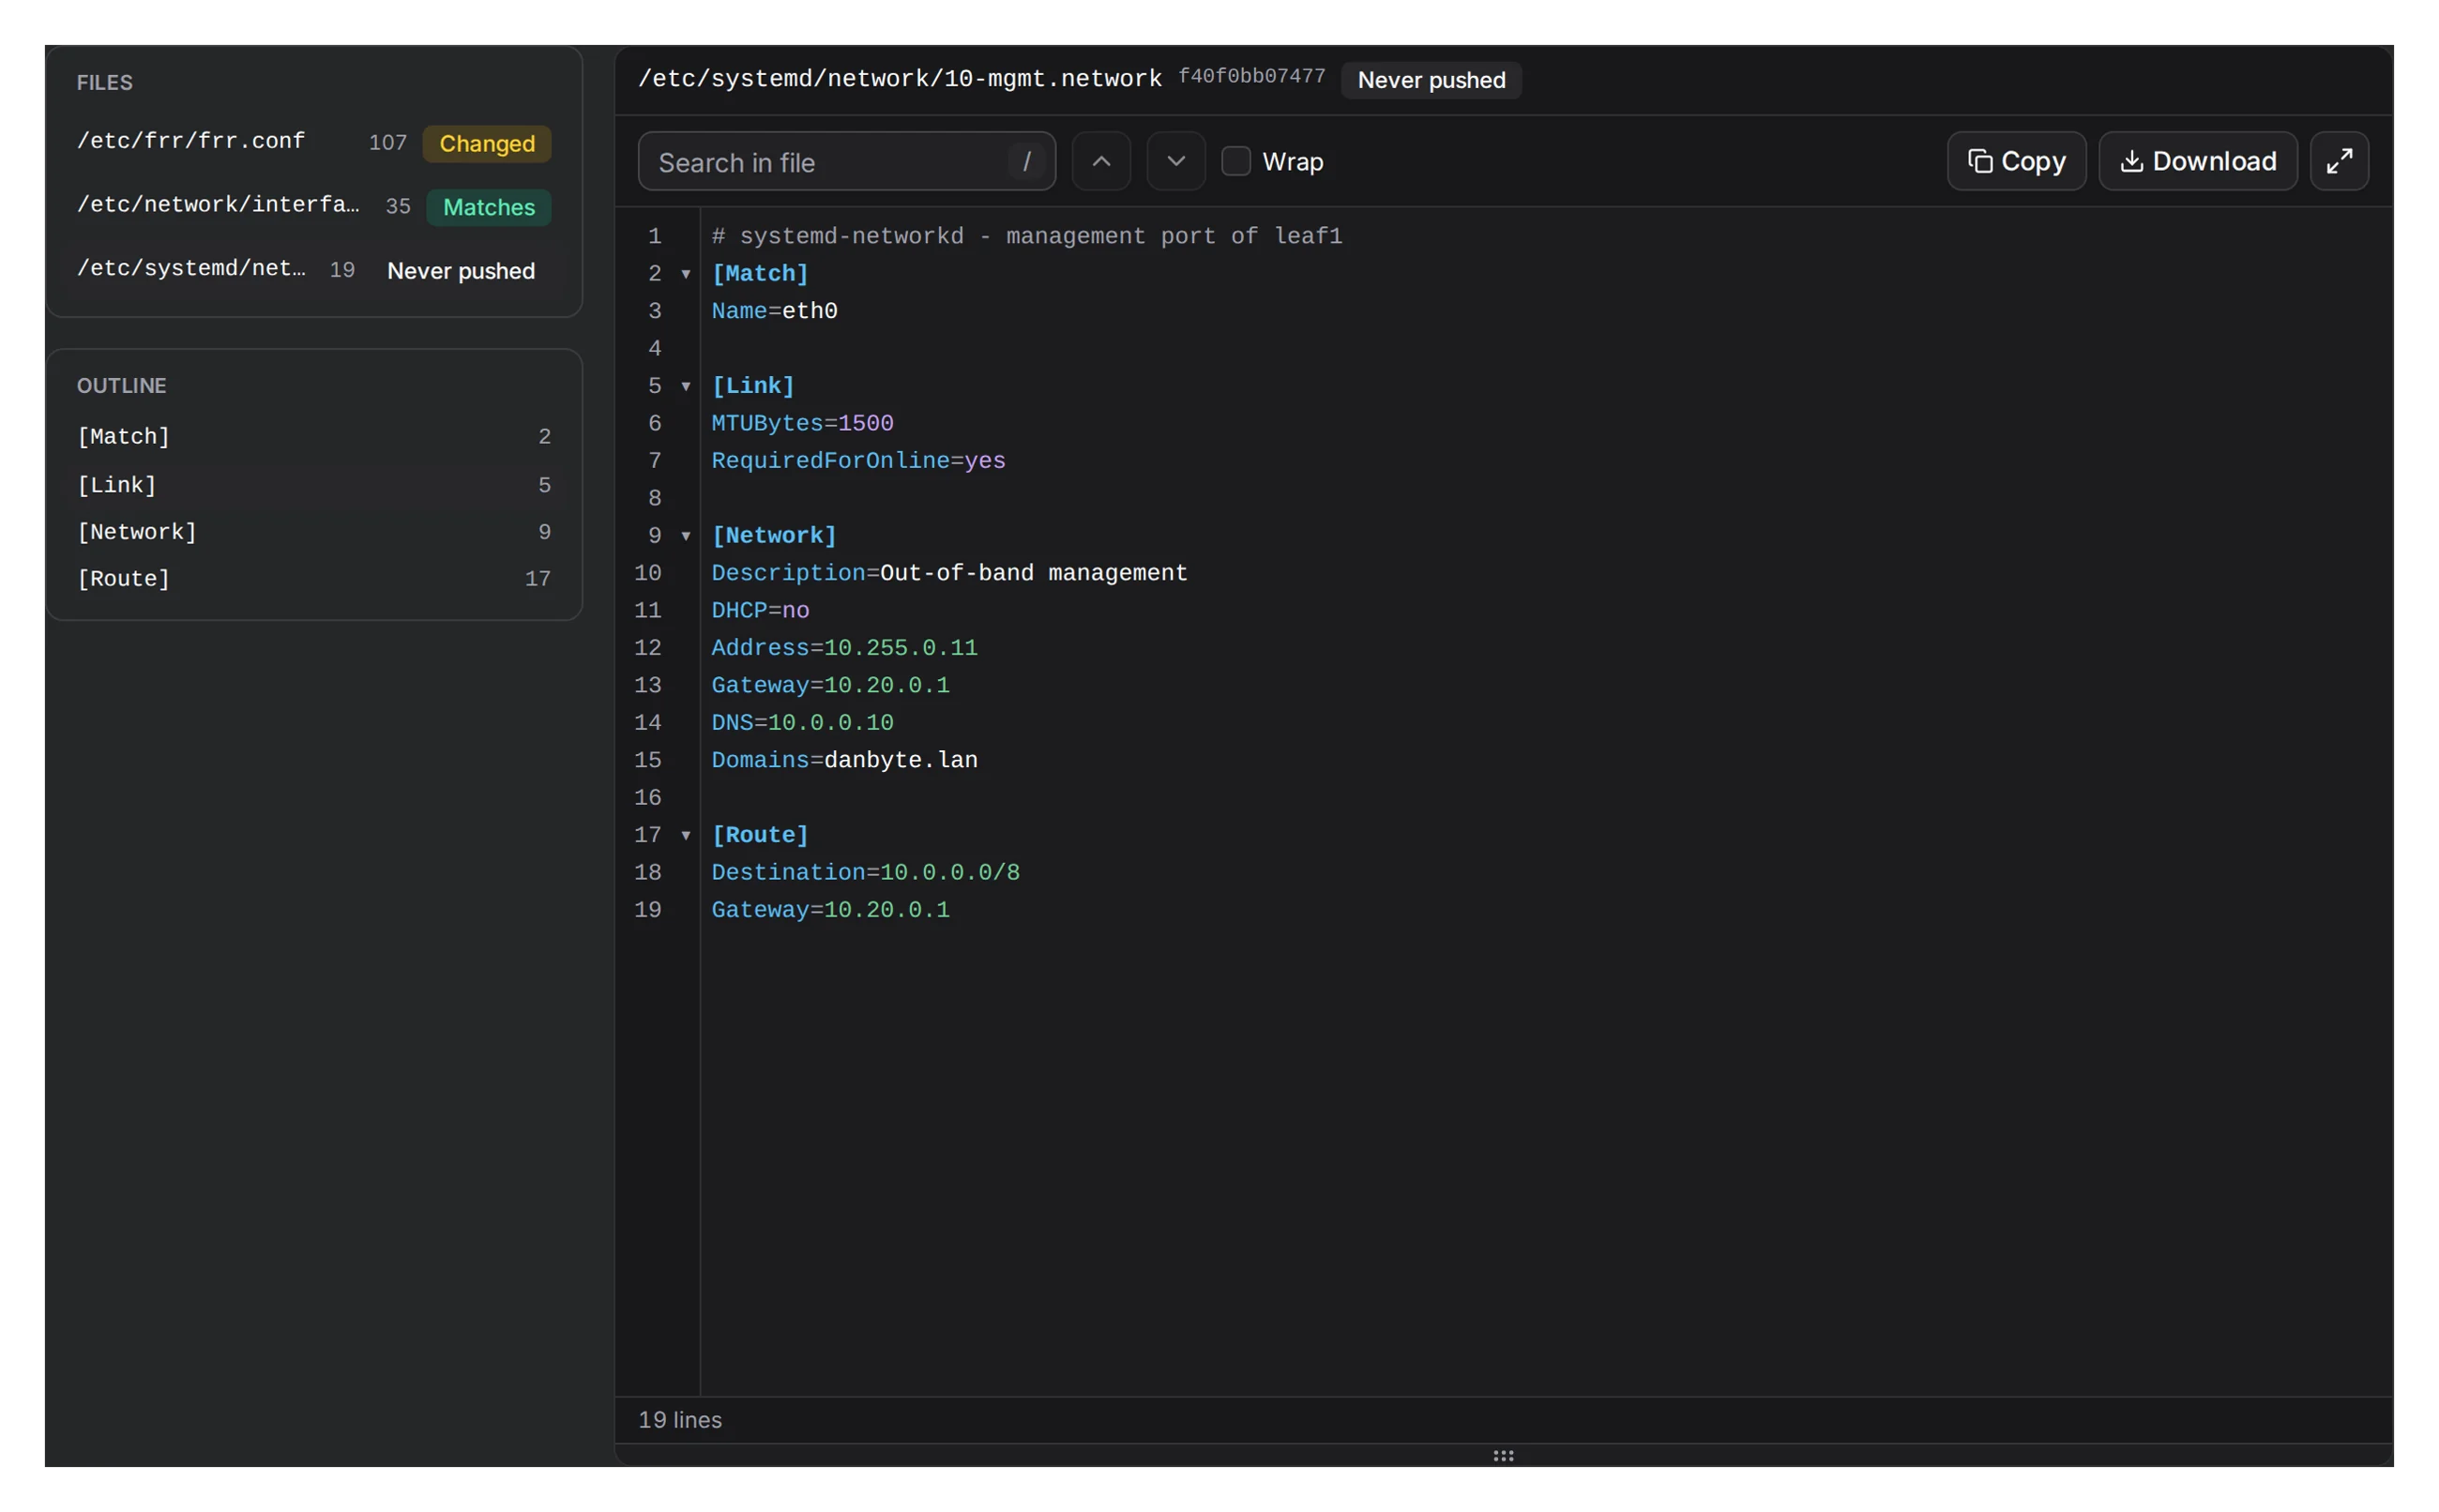
One viewer now serves the Config tab, config context, drift, script logs and export template previews. It has a file list with Changed, Matches and Never pushed, search, line numbers, wrap, copy and download, an outline with folding, unified or side-by-side diffs, and syntax colours for JSON, XML, YAML, INI, network configs and logs.
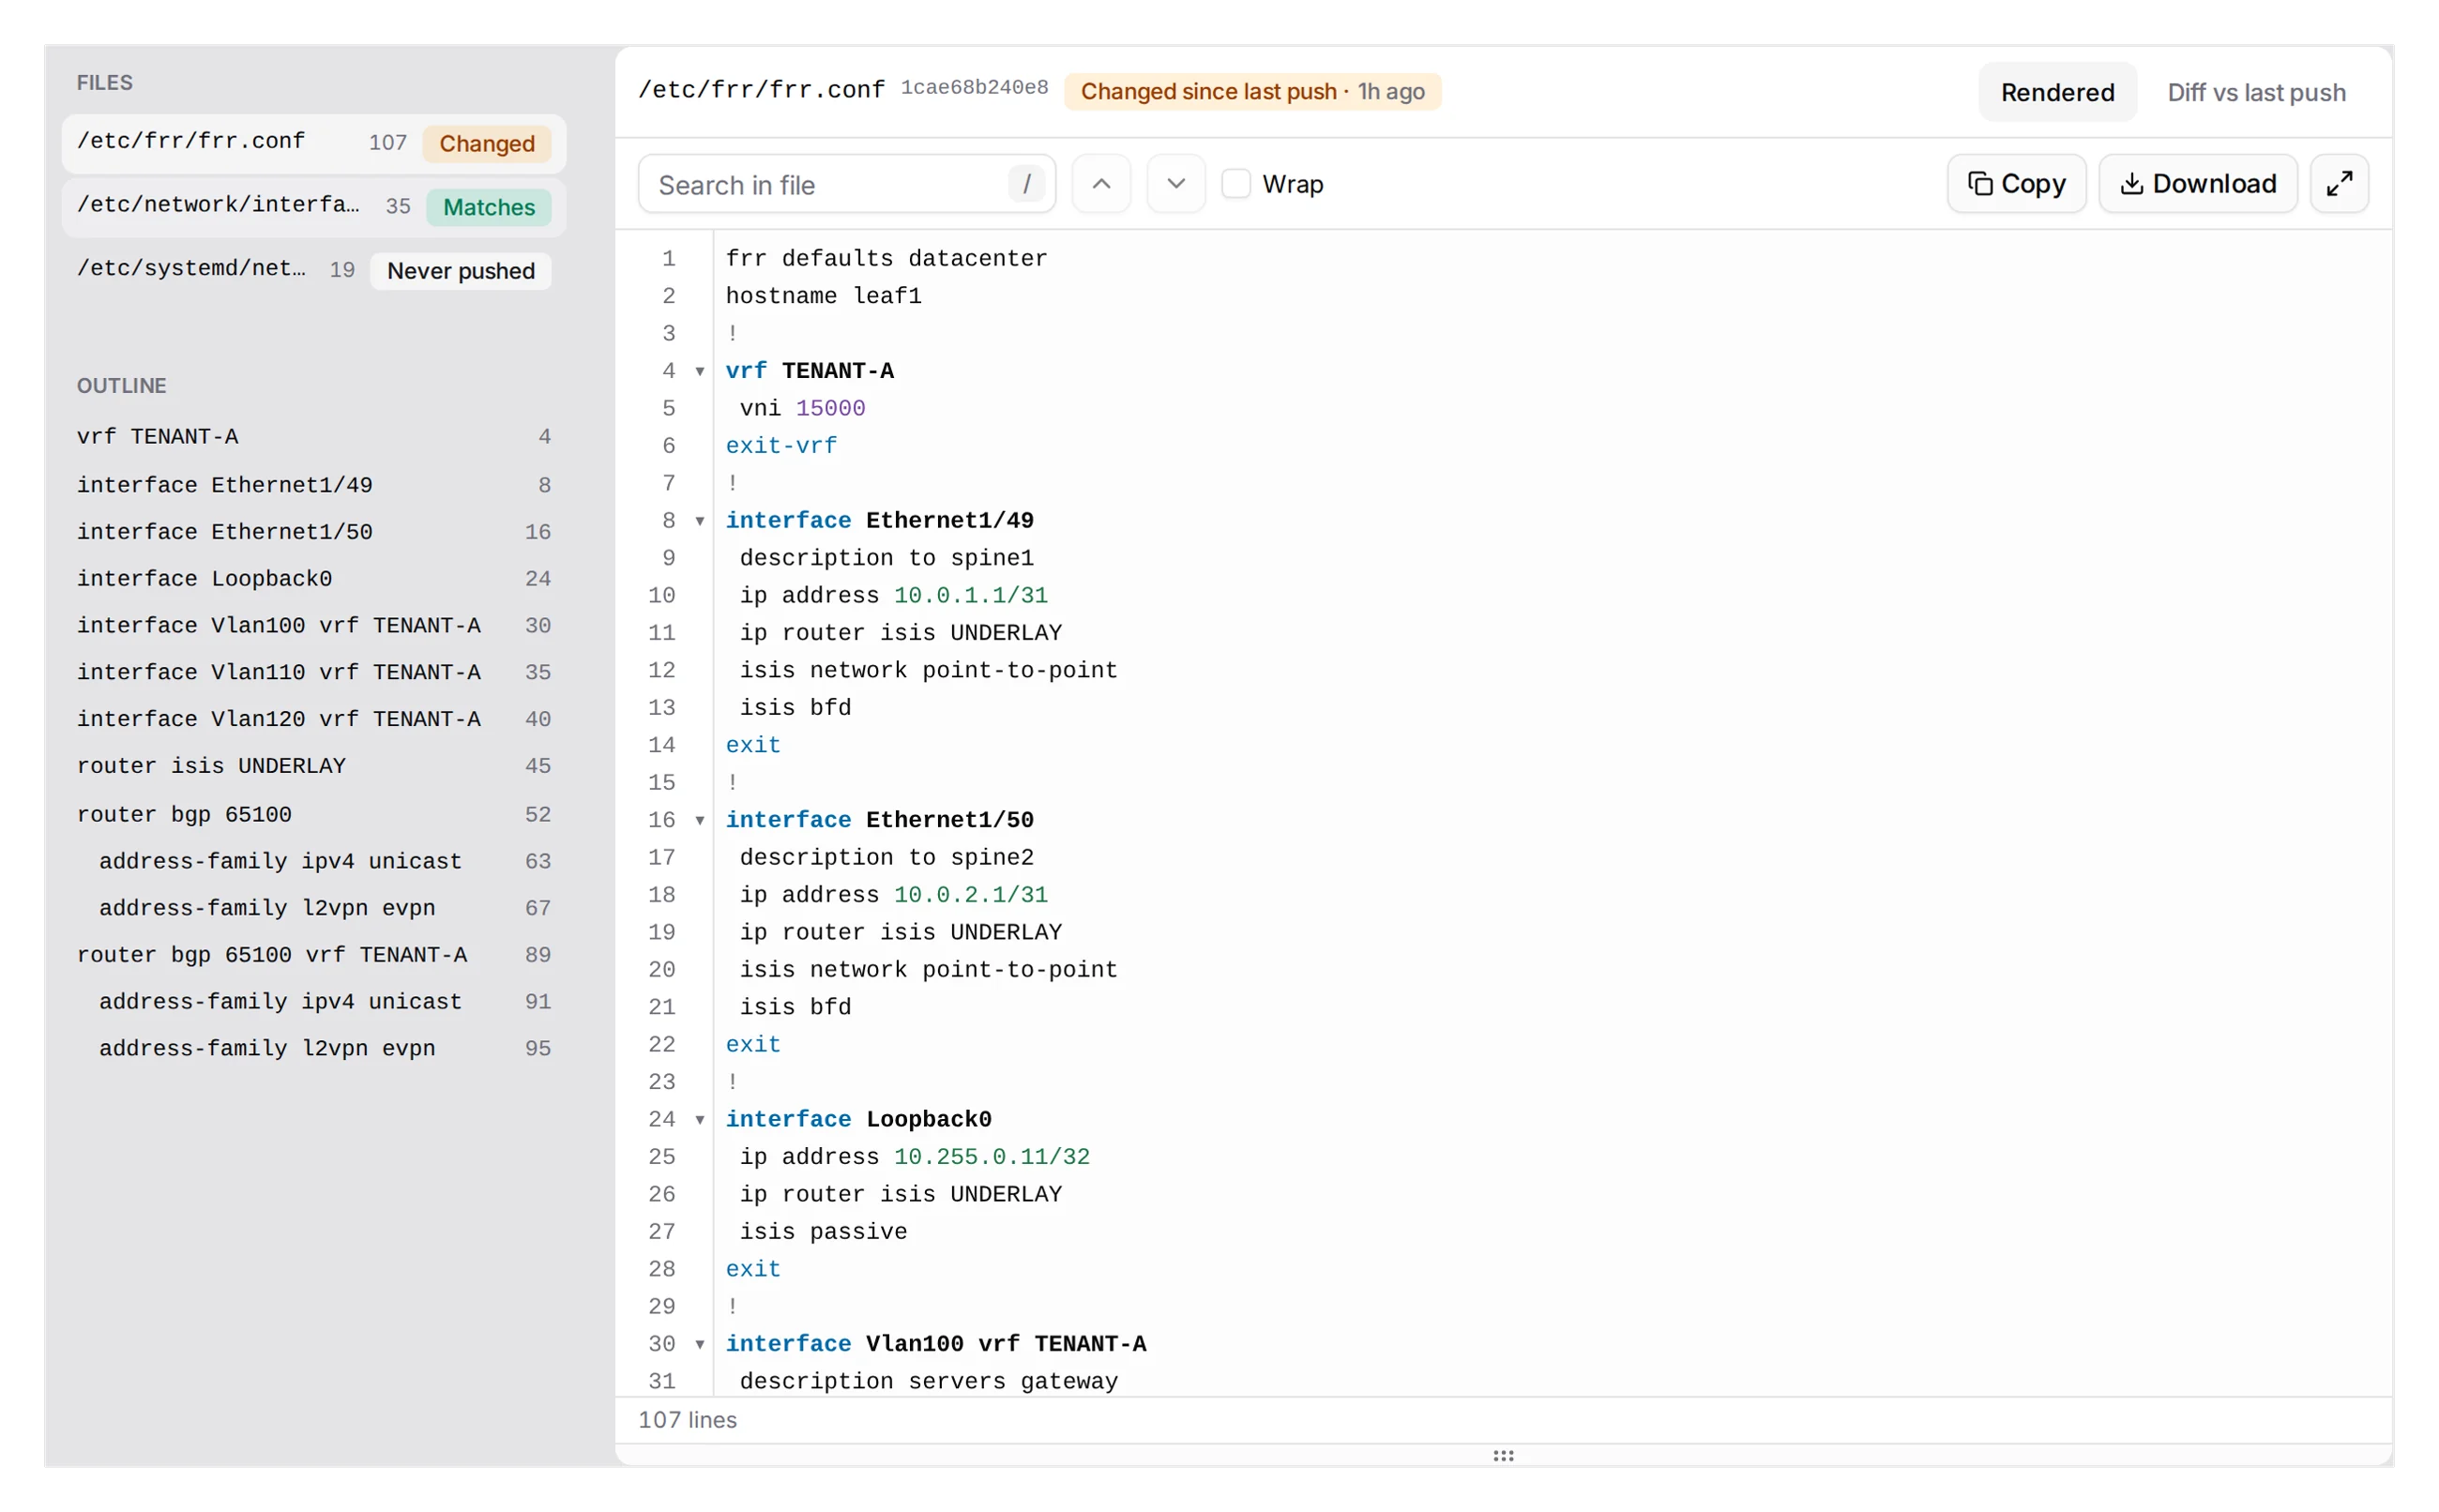
 Three files from one bundle, and the outline of the rendered config.
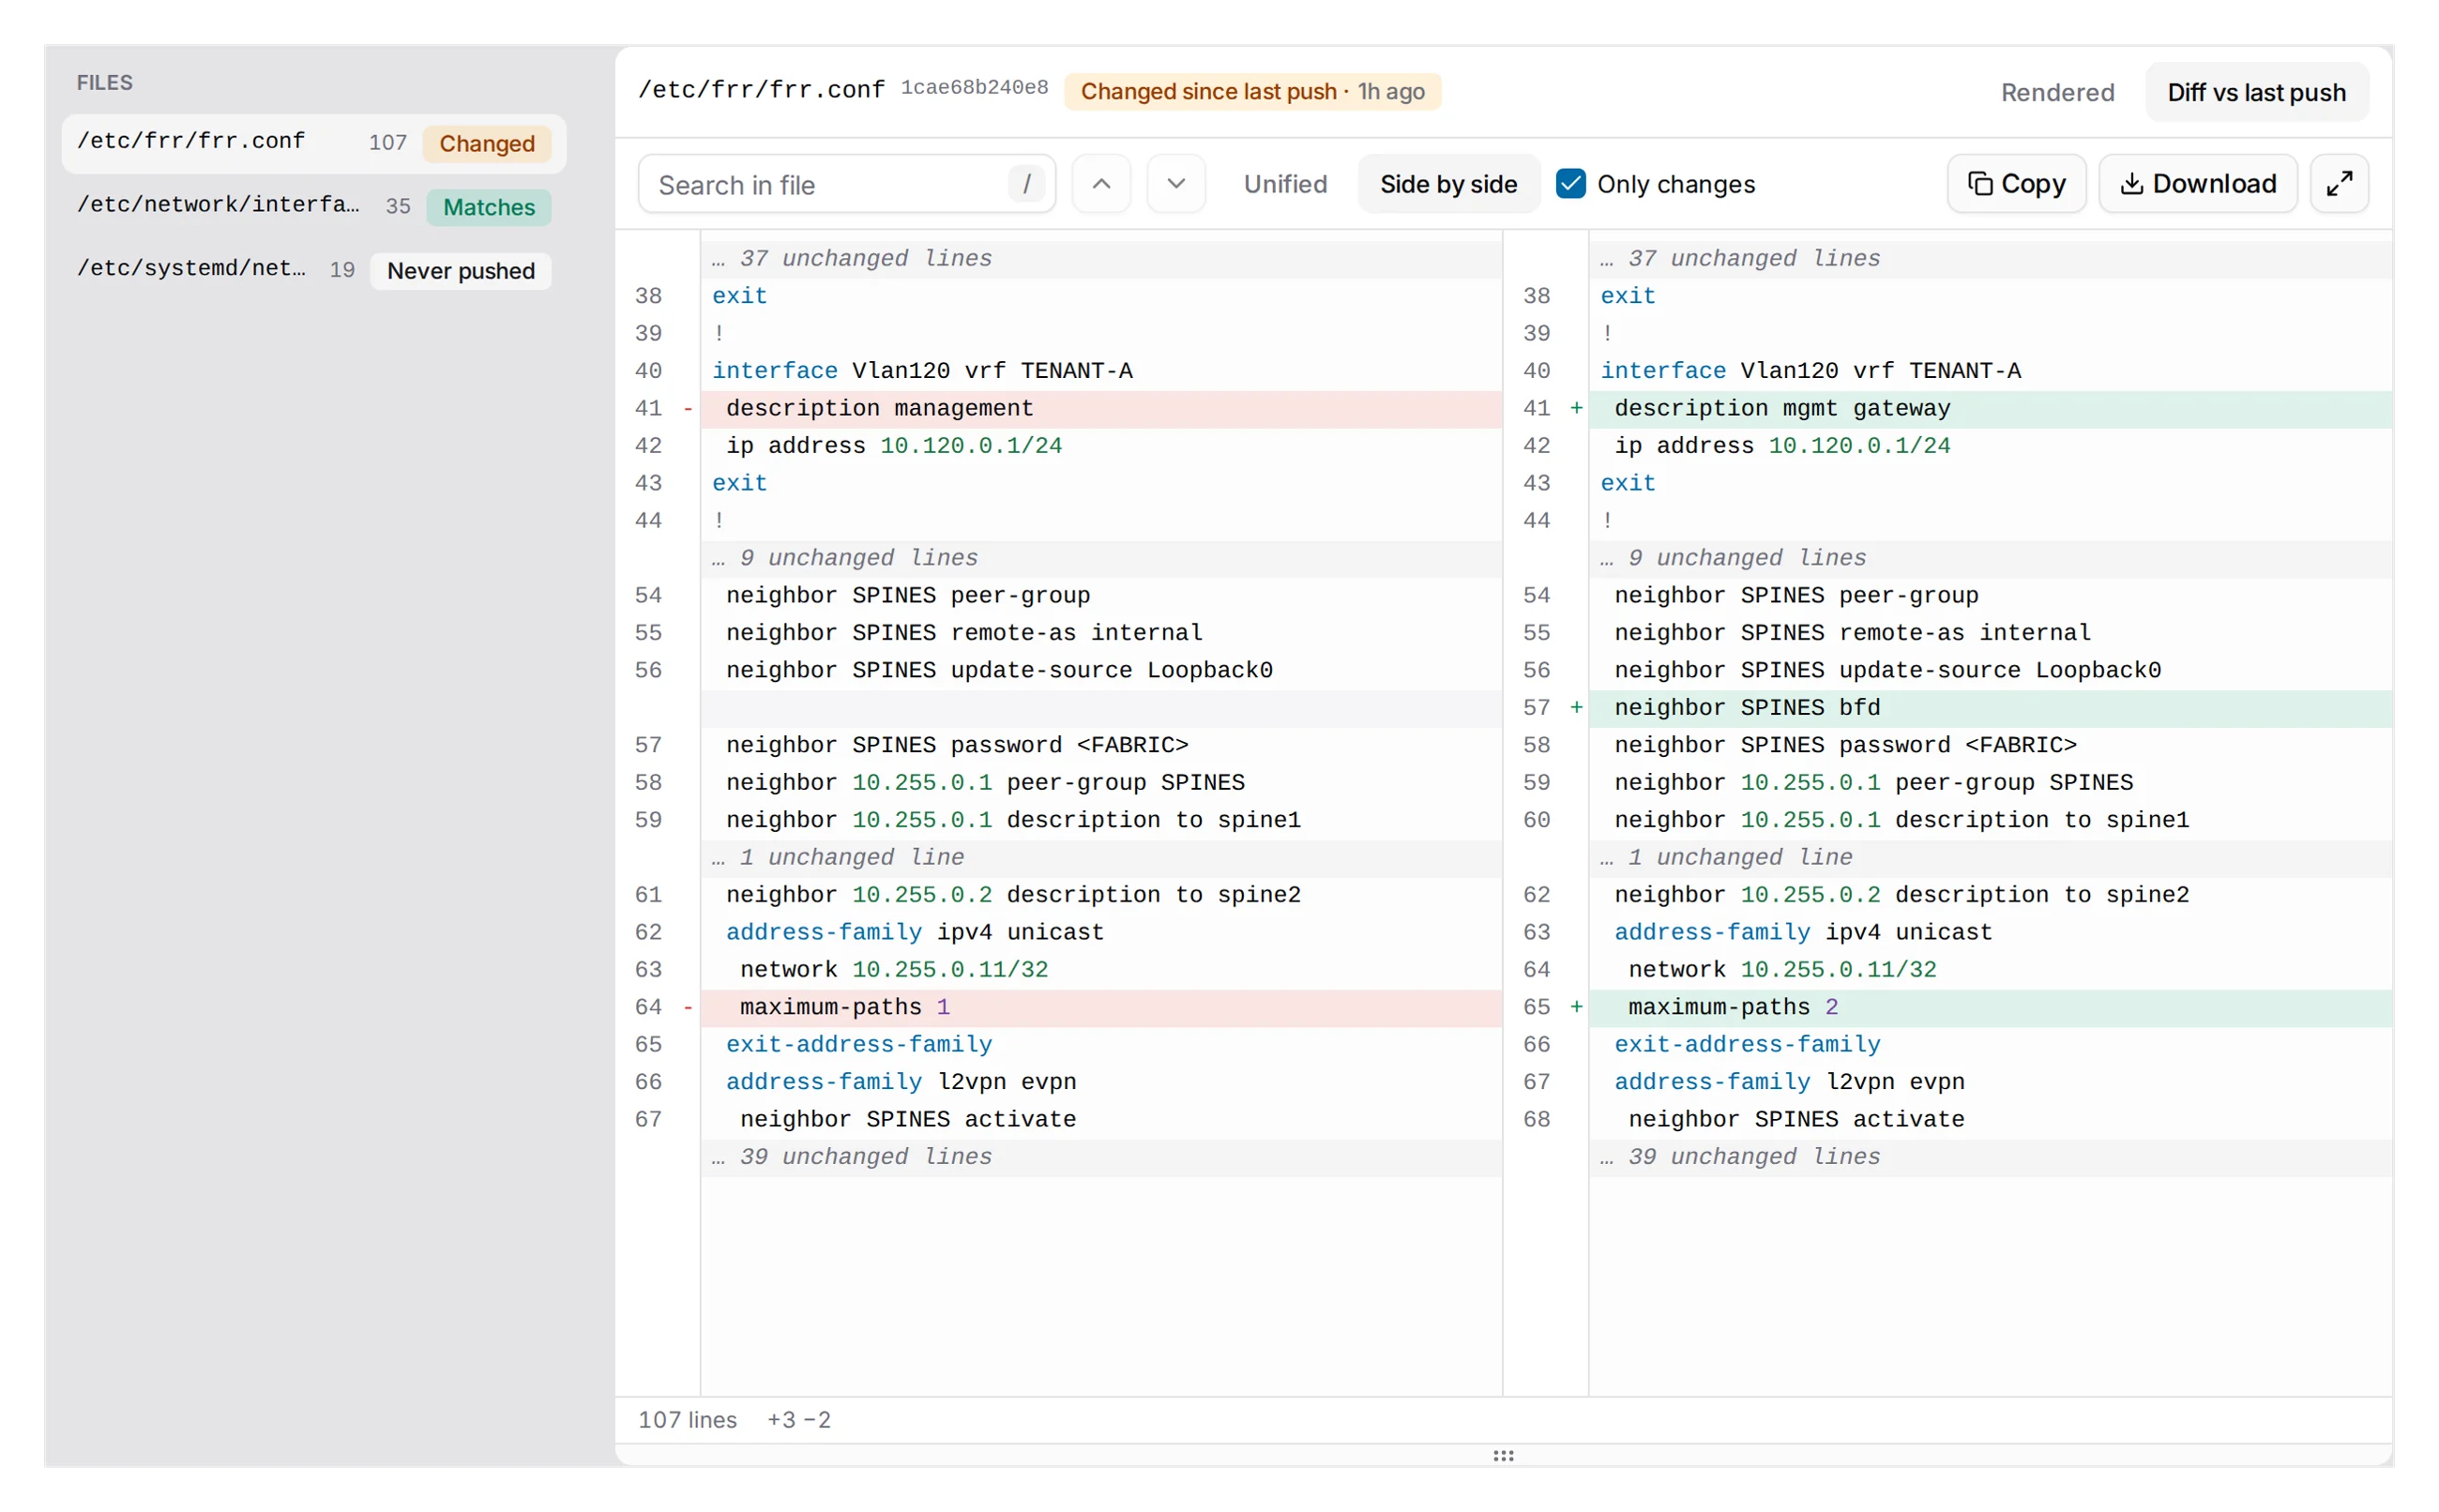
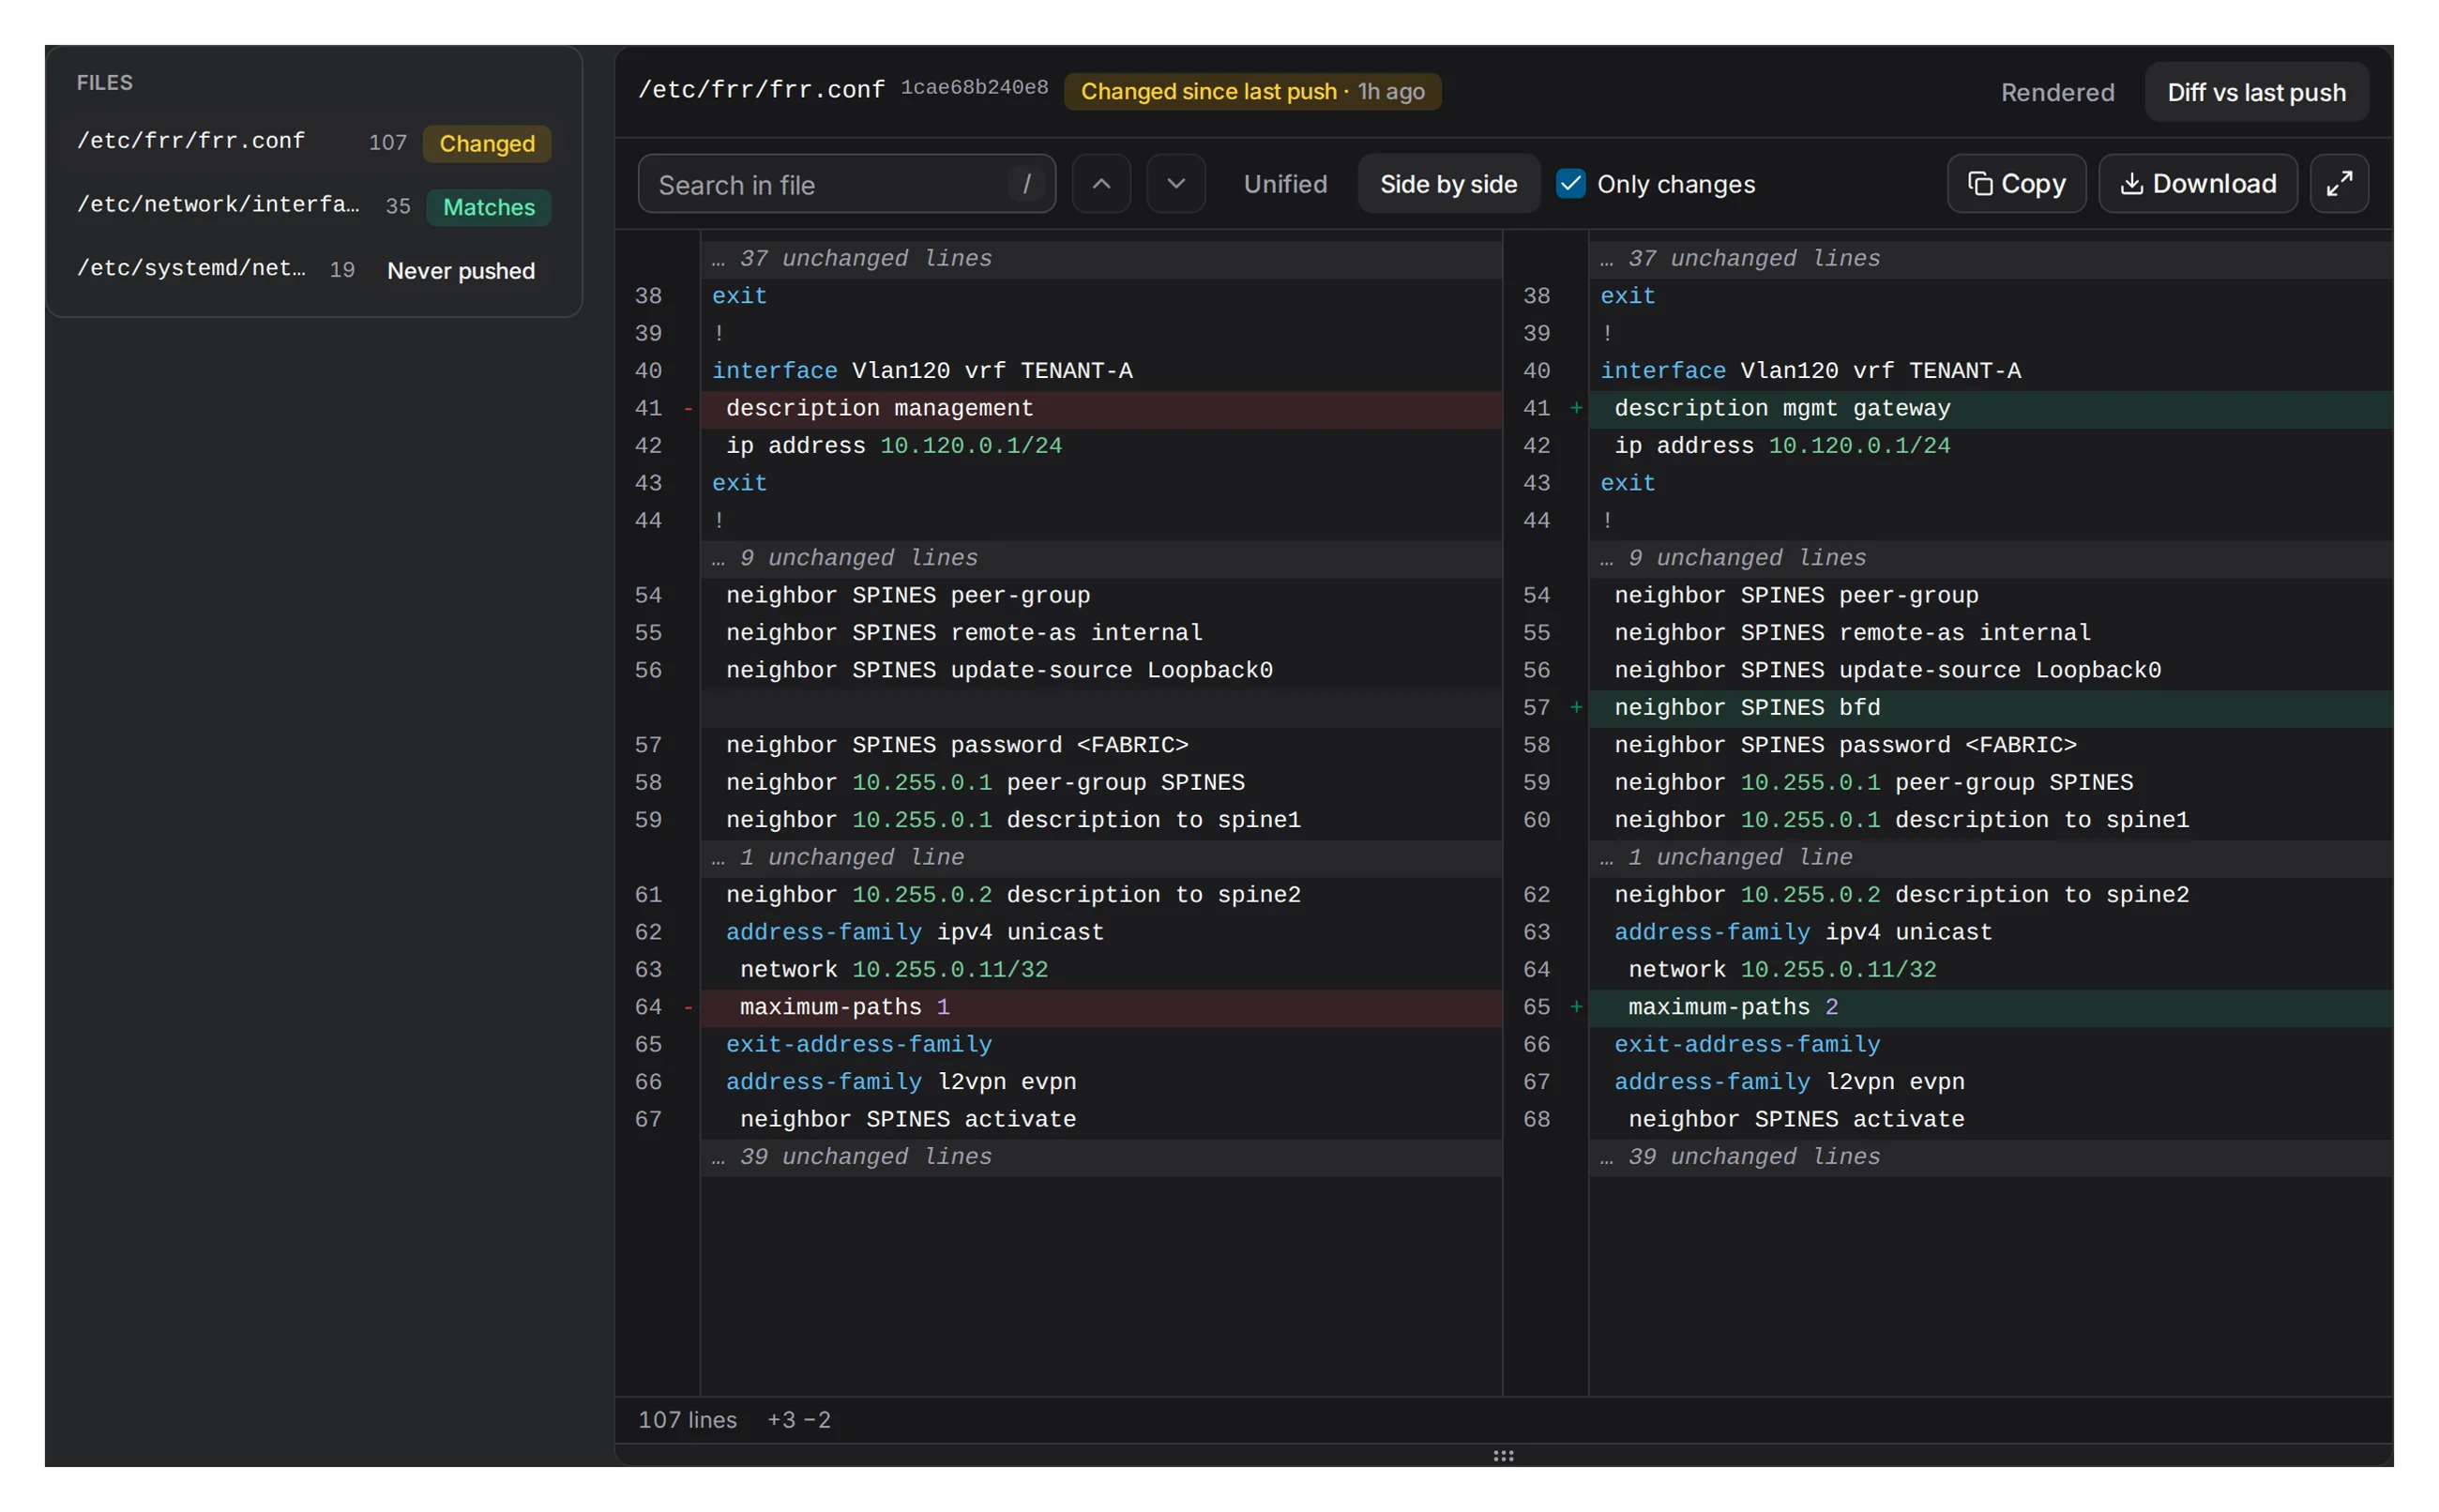
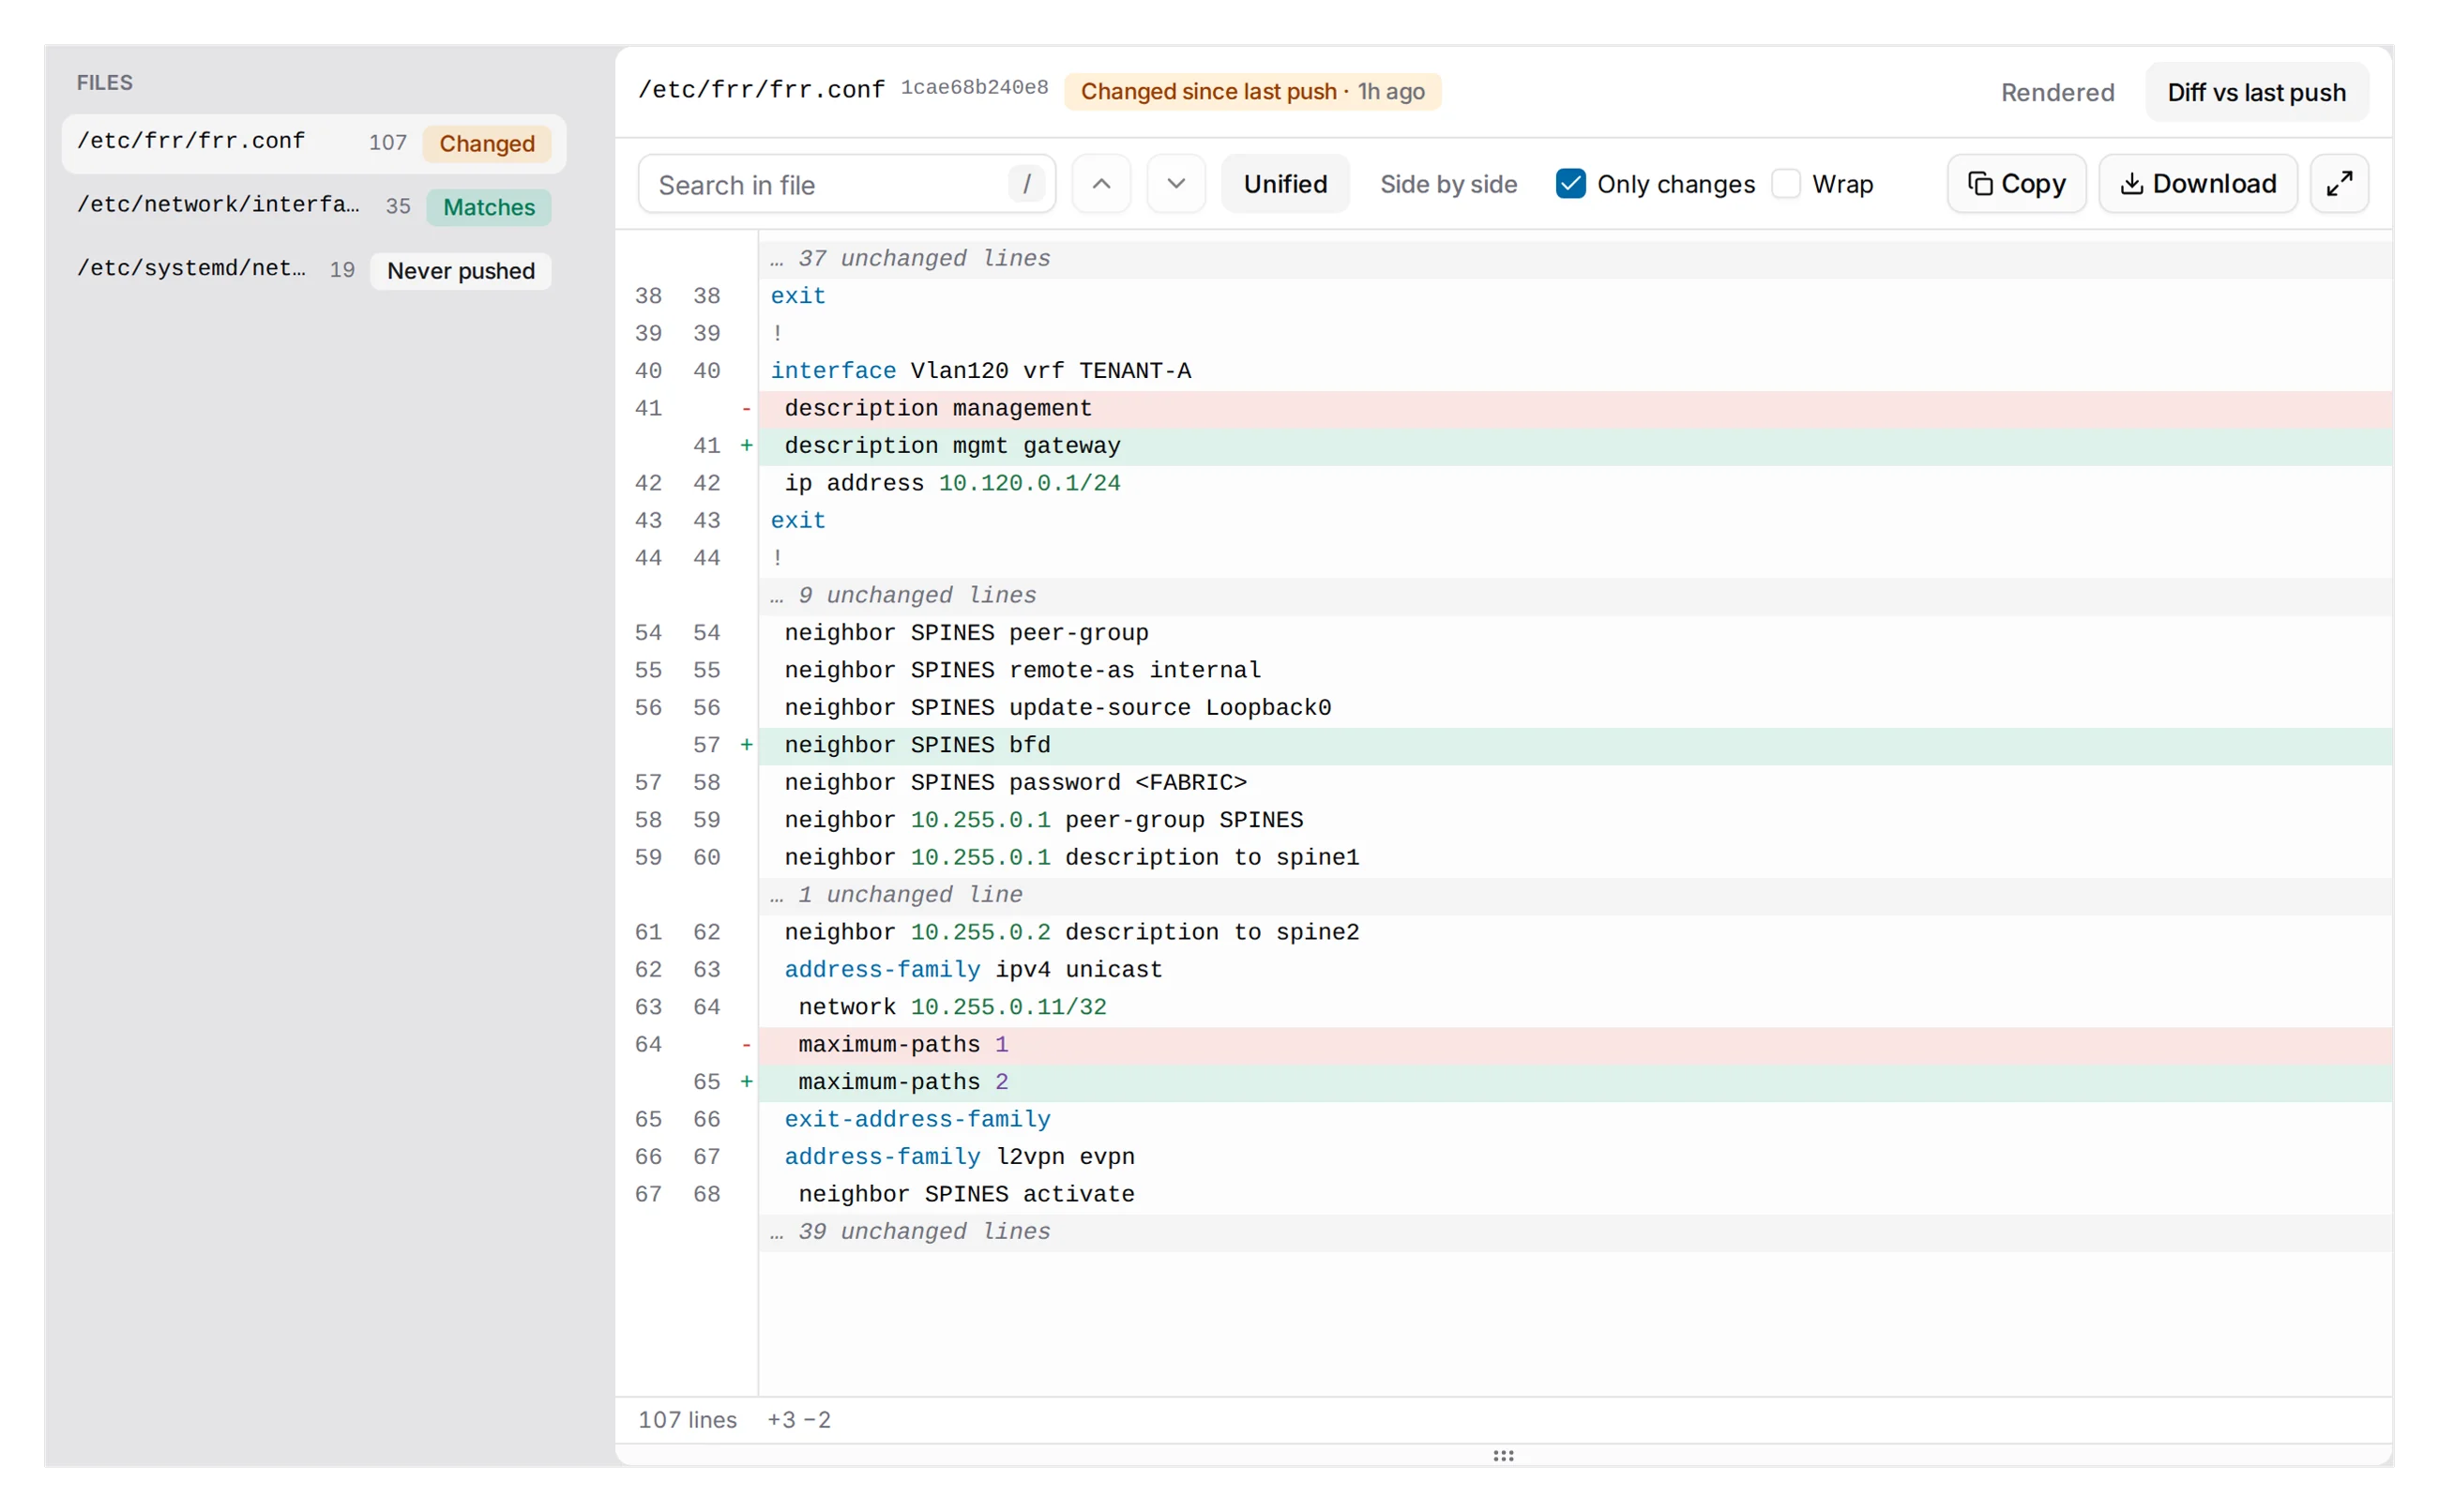
 UnifiedSide by side
The same three changes, an edited description, bfd added to a peer group and maximum-paths raised from 1 to 2, unified and side by side.
One template can write several files. Give it a target path ending in / and each {% file "name" %}…{% endfile %} block becomes a file with its own hash, drift and diff. Two templates in one bundle writing the same path is an error now, instead of the second one quietly winning.
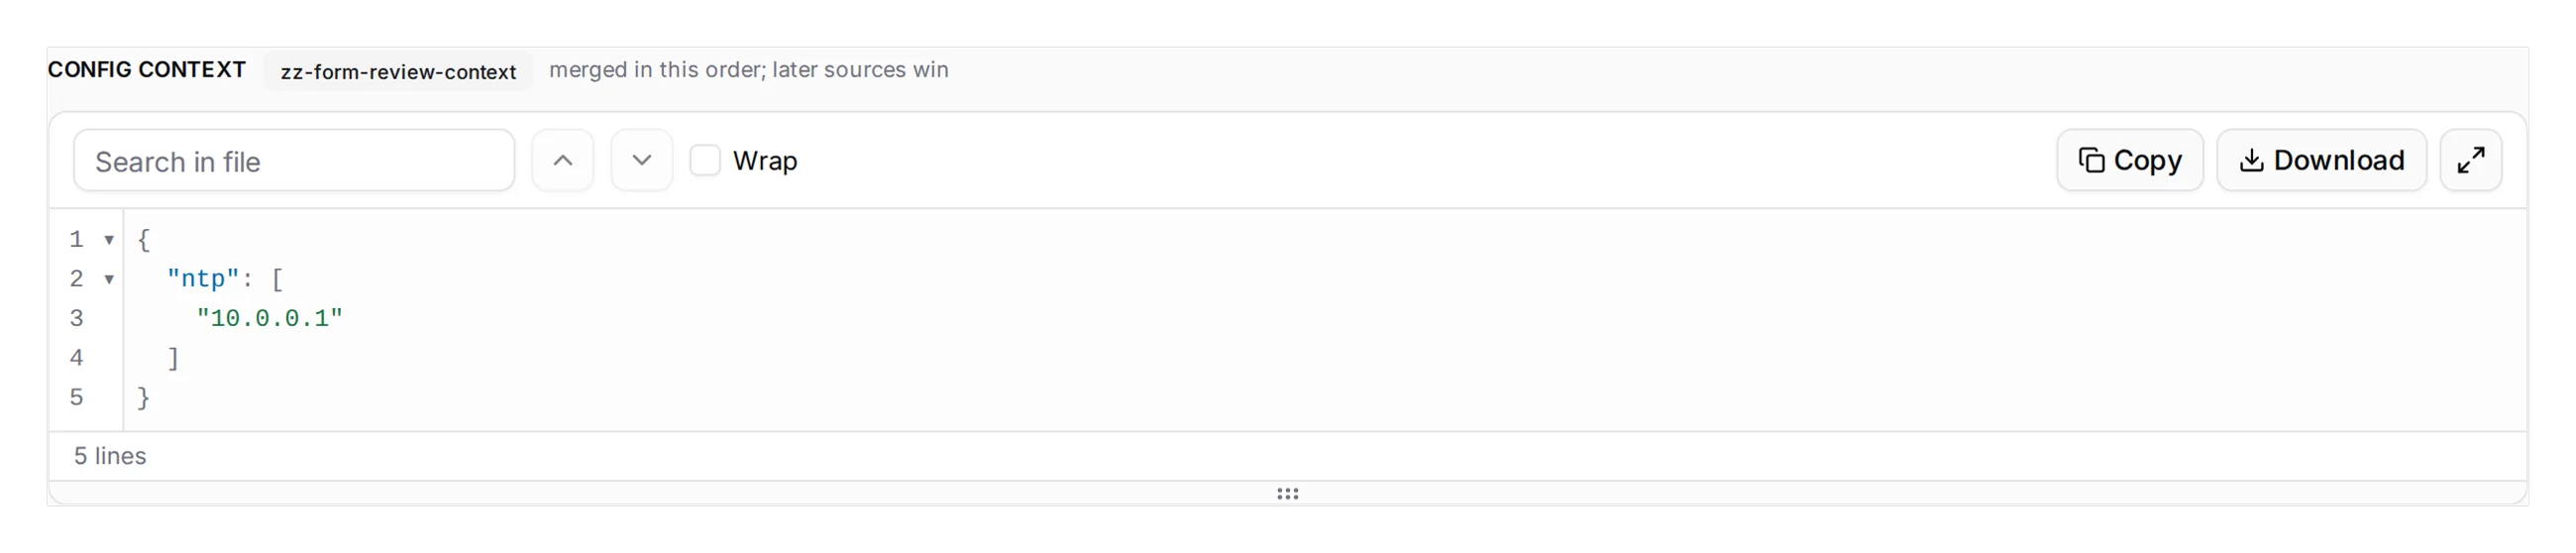
Config context can be set locally on a device or VM, merged last, and a config context can match by tag. Intended VMs can be provisioned: Provision sends one to an automation target under its own permission, and virtualization sync never overwrites, deletes or prunes it.
PRTG monitoring
PRTG is a monitoring connection like Zabbix or vCenter, under Settings → Integrations, with an encrypted write-only API key and a Test connection button. It matches PRTG devices to devices and VMs, with a review queue for the ones it cannot decide, an editable state map and a prtg check kind. The device and VM lists get a PRTG column and filter.
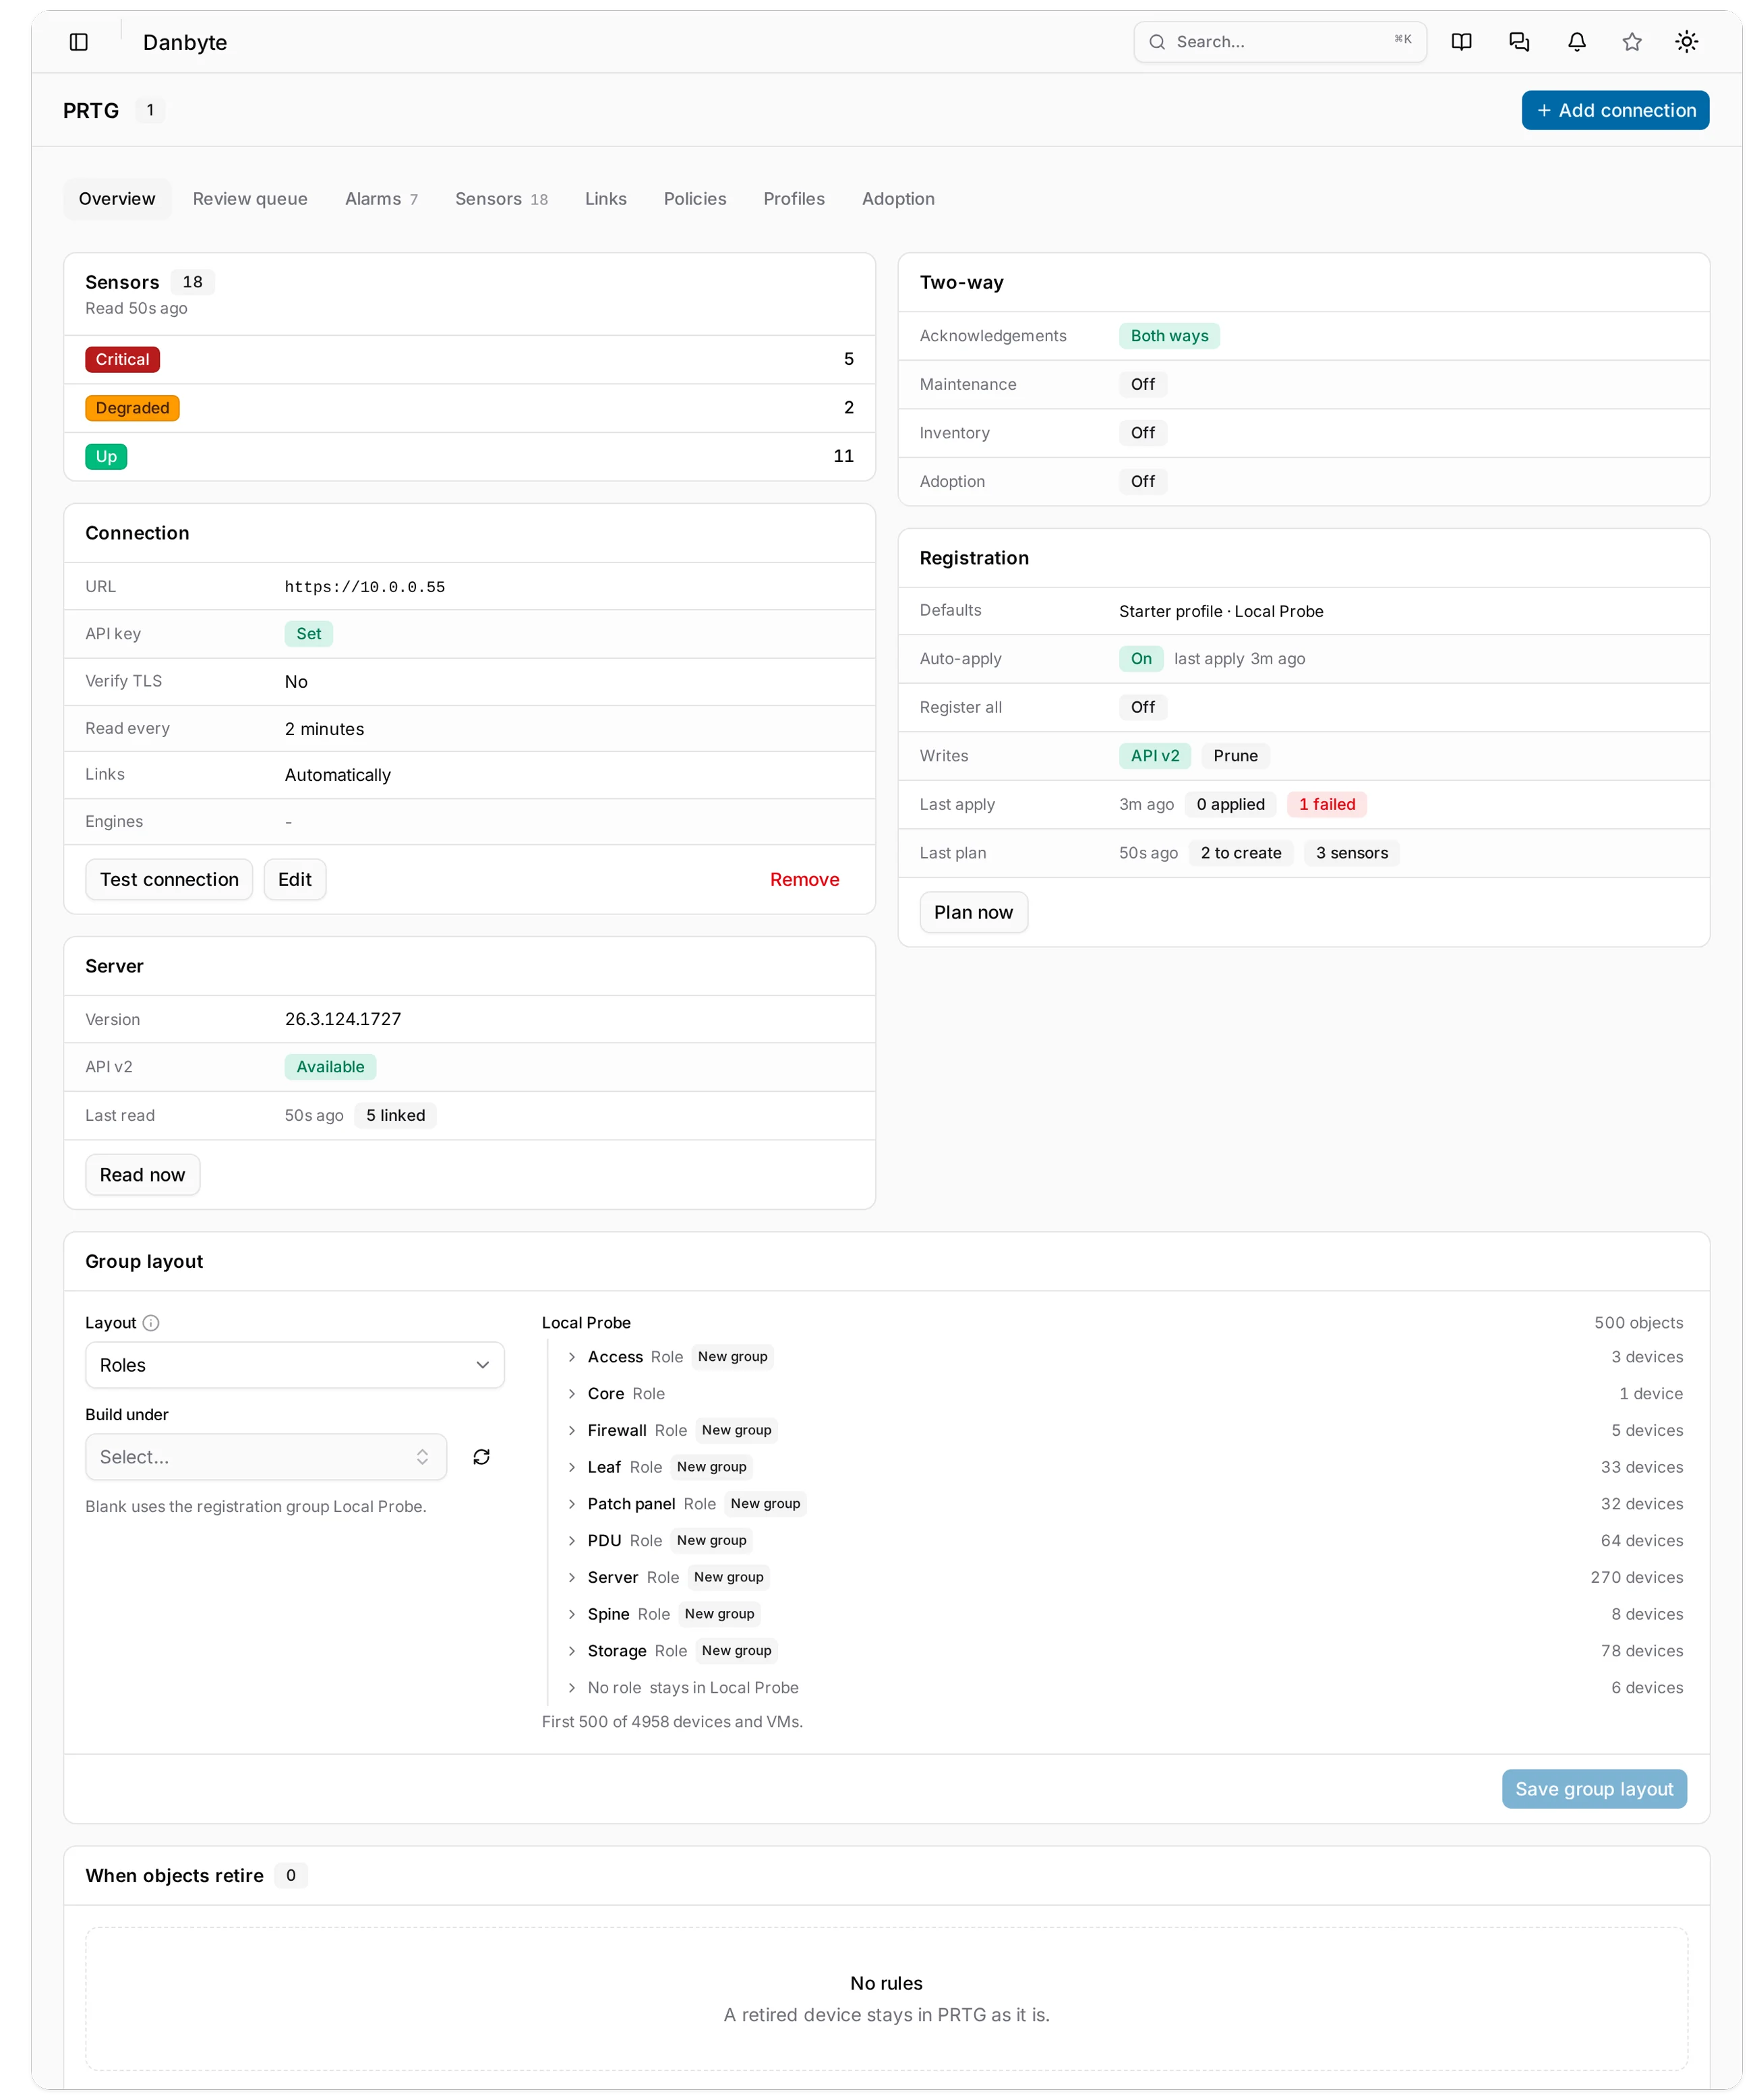
 One connection: what it reads, what it may write, and the tree it will build in PRTG.
Device and VM pages get a Sensors tab with a card per sensor. Each channel has its own gauge with warning and error bands, a sparkline and 1h, 24h and 7d history, and the card says when PRTG was last read and links straight into it.
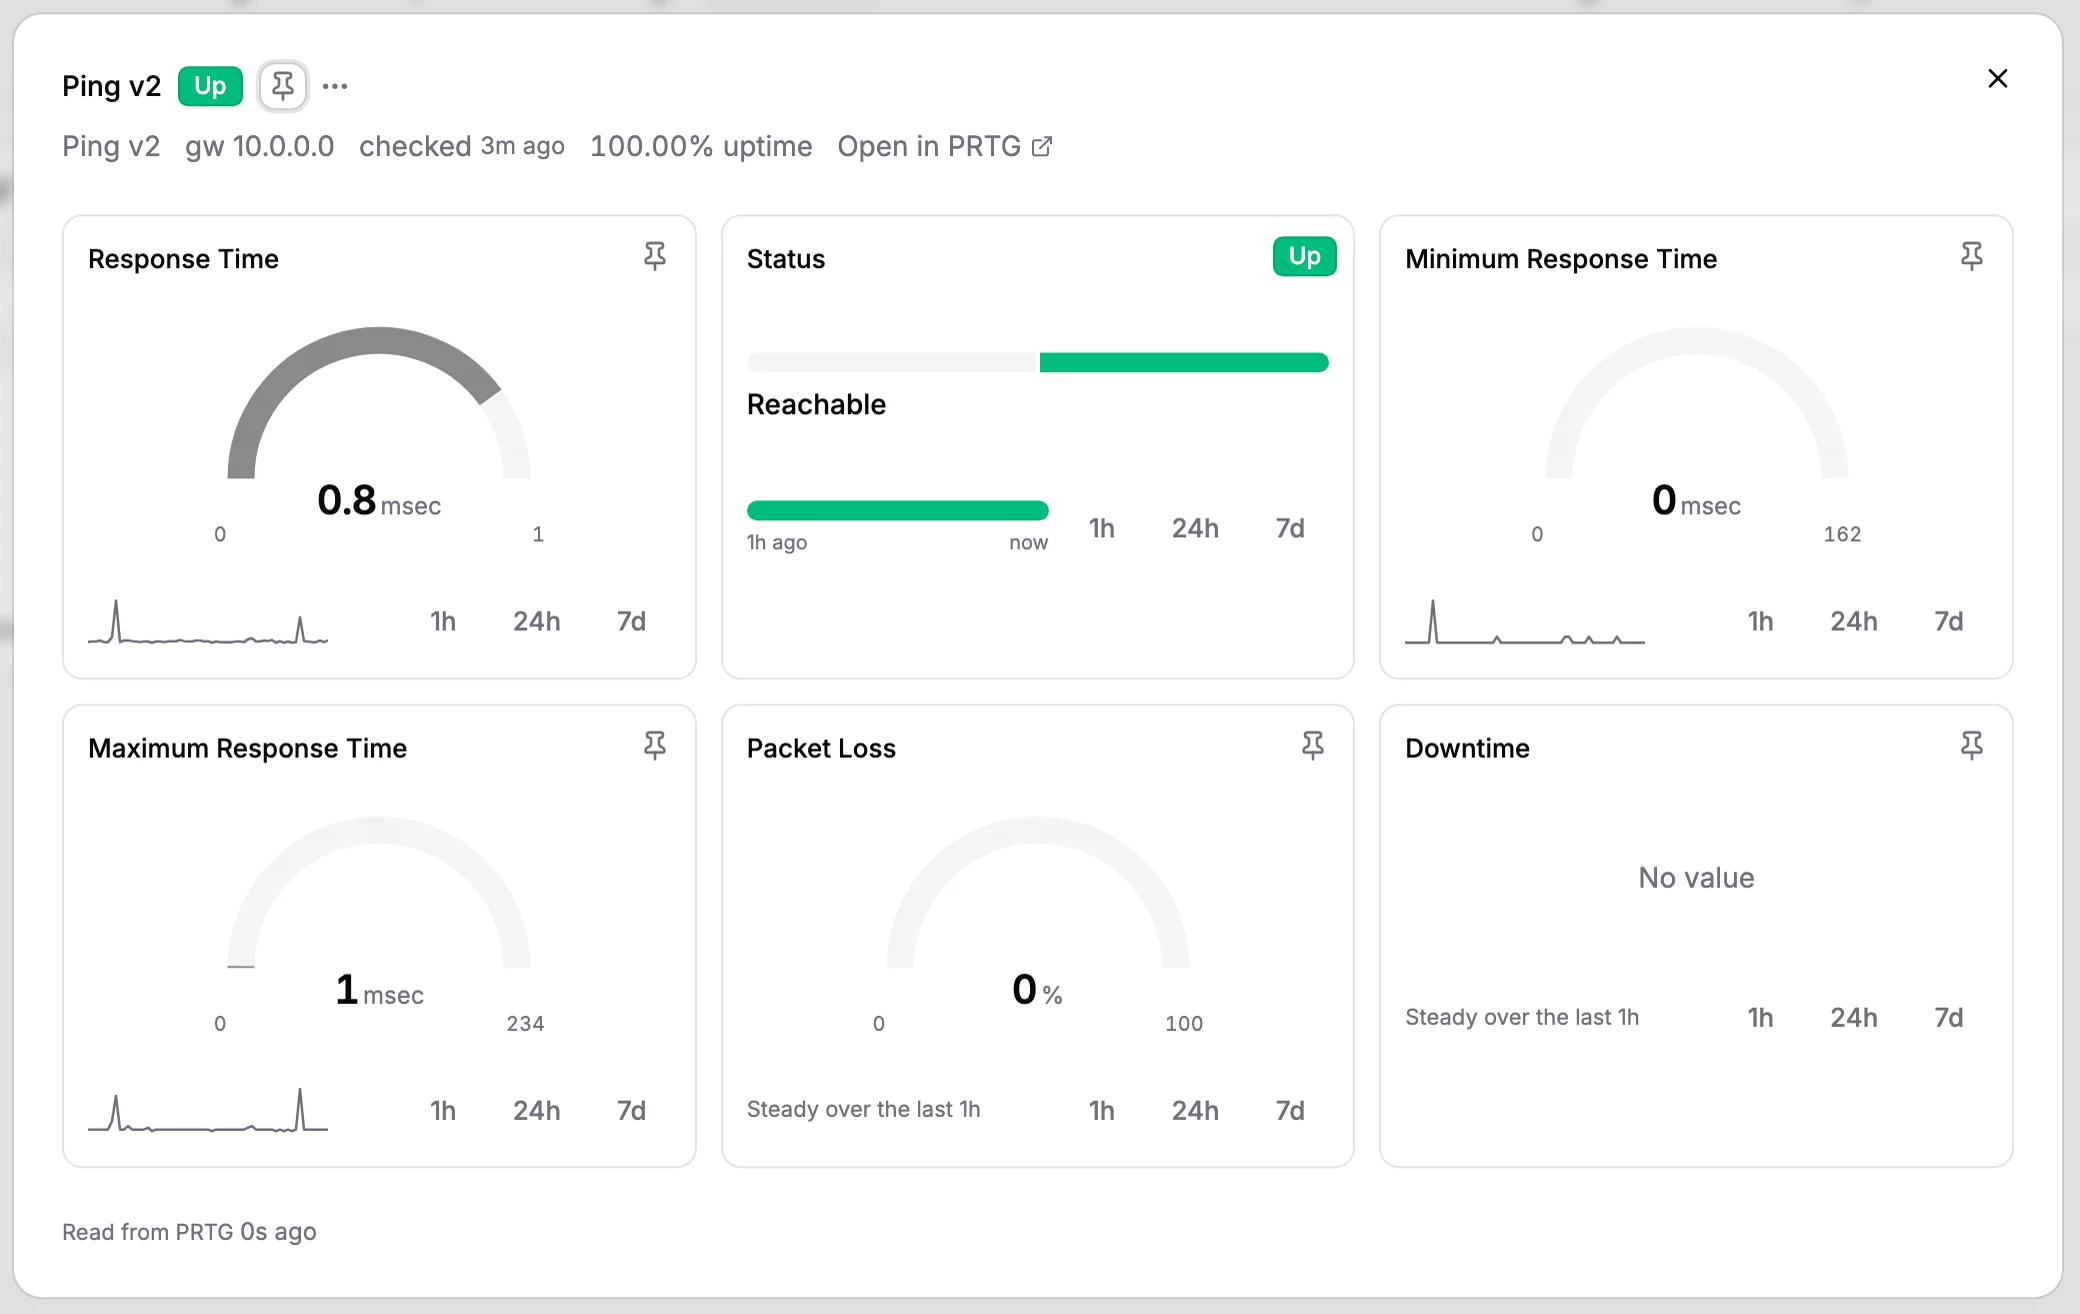
 One sensor, channel by channel, with 1h, 24h and 7d behind each one.
A channel can be pinned to the device's overview, and one monitoring card there now covers Danbyte's own checks, Zabbix and PRTG together.
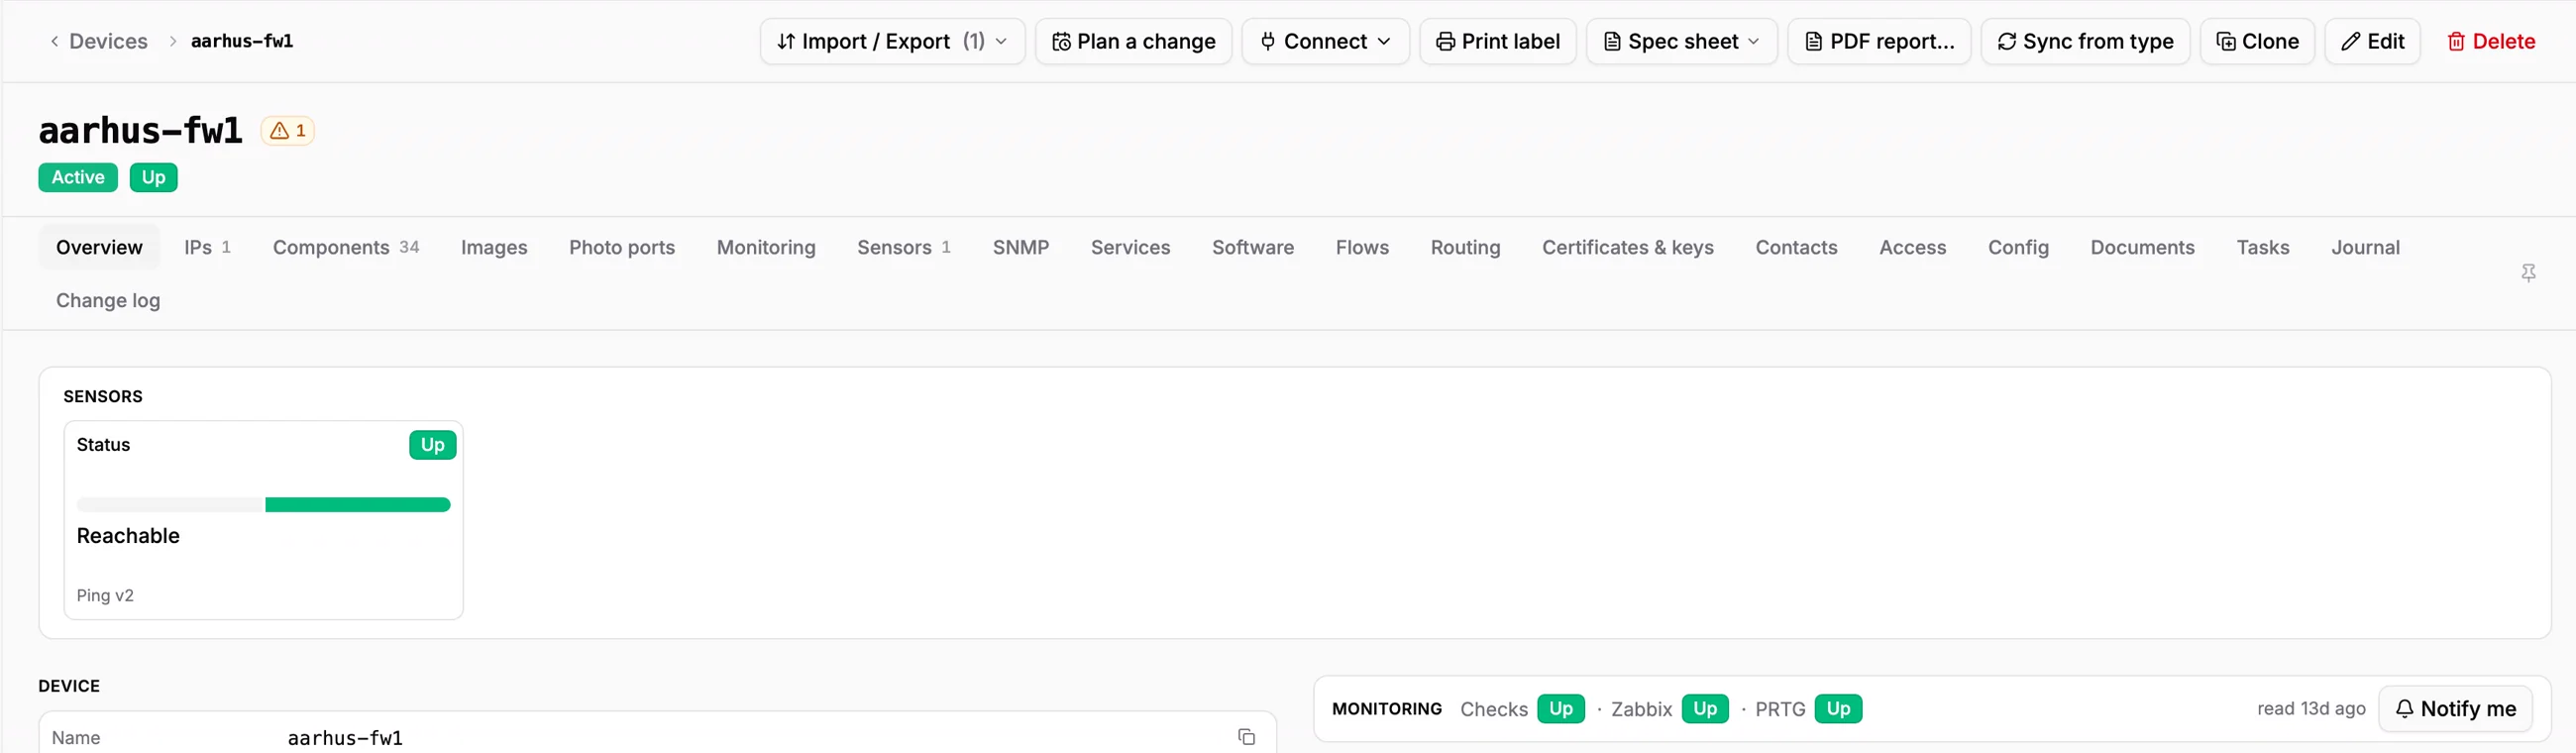
 The pinned channel on the overview, and all three monitoring sources on one row.
A sensor links to the IP address, interface or service it polls. /prtg lists sensors and alarms across the install, and there are two dashboard widgets.
Acknowledging in either system acknowledges in the other, and acknowledge, pause and resume work from Danbyte. The rest is opt-in, setting by setting, and starts off: a maintenance window pausing the devices linked to it, adopting unmatched PRTG devices, and letting system information feed inventory drift.
Danbyte can also be the source of truth. Each device and VM is set to Monitor in PRTG or Exclude. Policies pick a sensor profile and a group, group trees are built from regions, sites, locations and roles, and sensors can be overridden per device. Applying creates devices and sensors through API v2 (PRTG 26.2.120 or later; older servers copy a seed device), and it leaves alone what it did not create, apart from moving a linked device into the group its policy puts it in. Sensors can be added by hand or found with PRTG's own discovery from the Sensors tab. Delete dialogs offer Also remove from PRTG, and retirement rules pause or delete PRTG devices by status or tag.
PDF reports and SBOMs
Devices, prefixes and IP addresses print as PDF reports, from their own page, from the list's Import / Export menu and from the bulk bar (#474). Columns come out in your order, with grouping, a summary, one page per object, the sections you choose, badges in their colours, an optional cover page and chapters with a clickable contents. Prefix reports group by VRF and can list each prefix's addresses. A large report runs in the background with a live estimate.
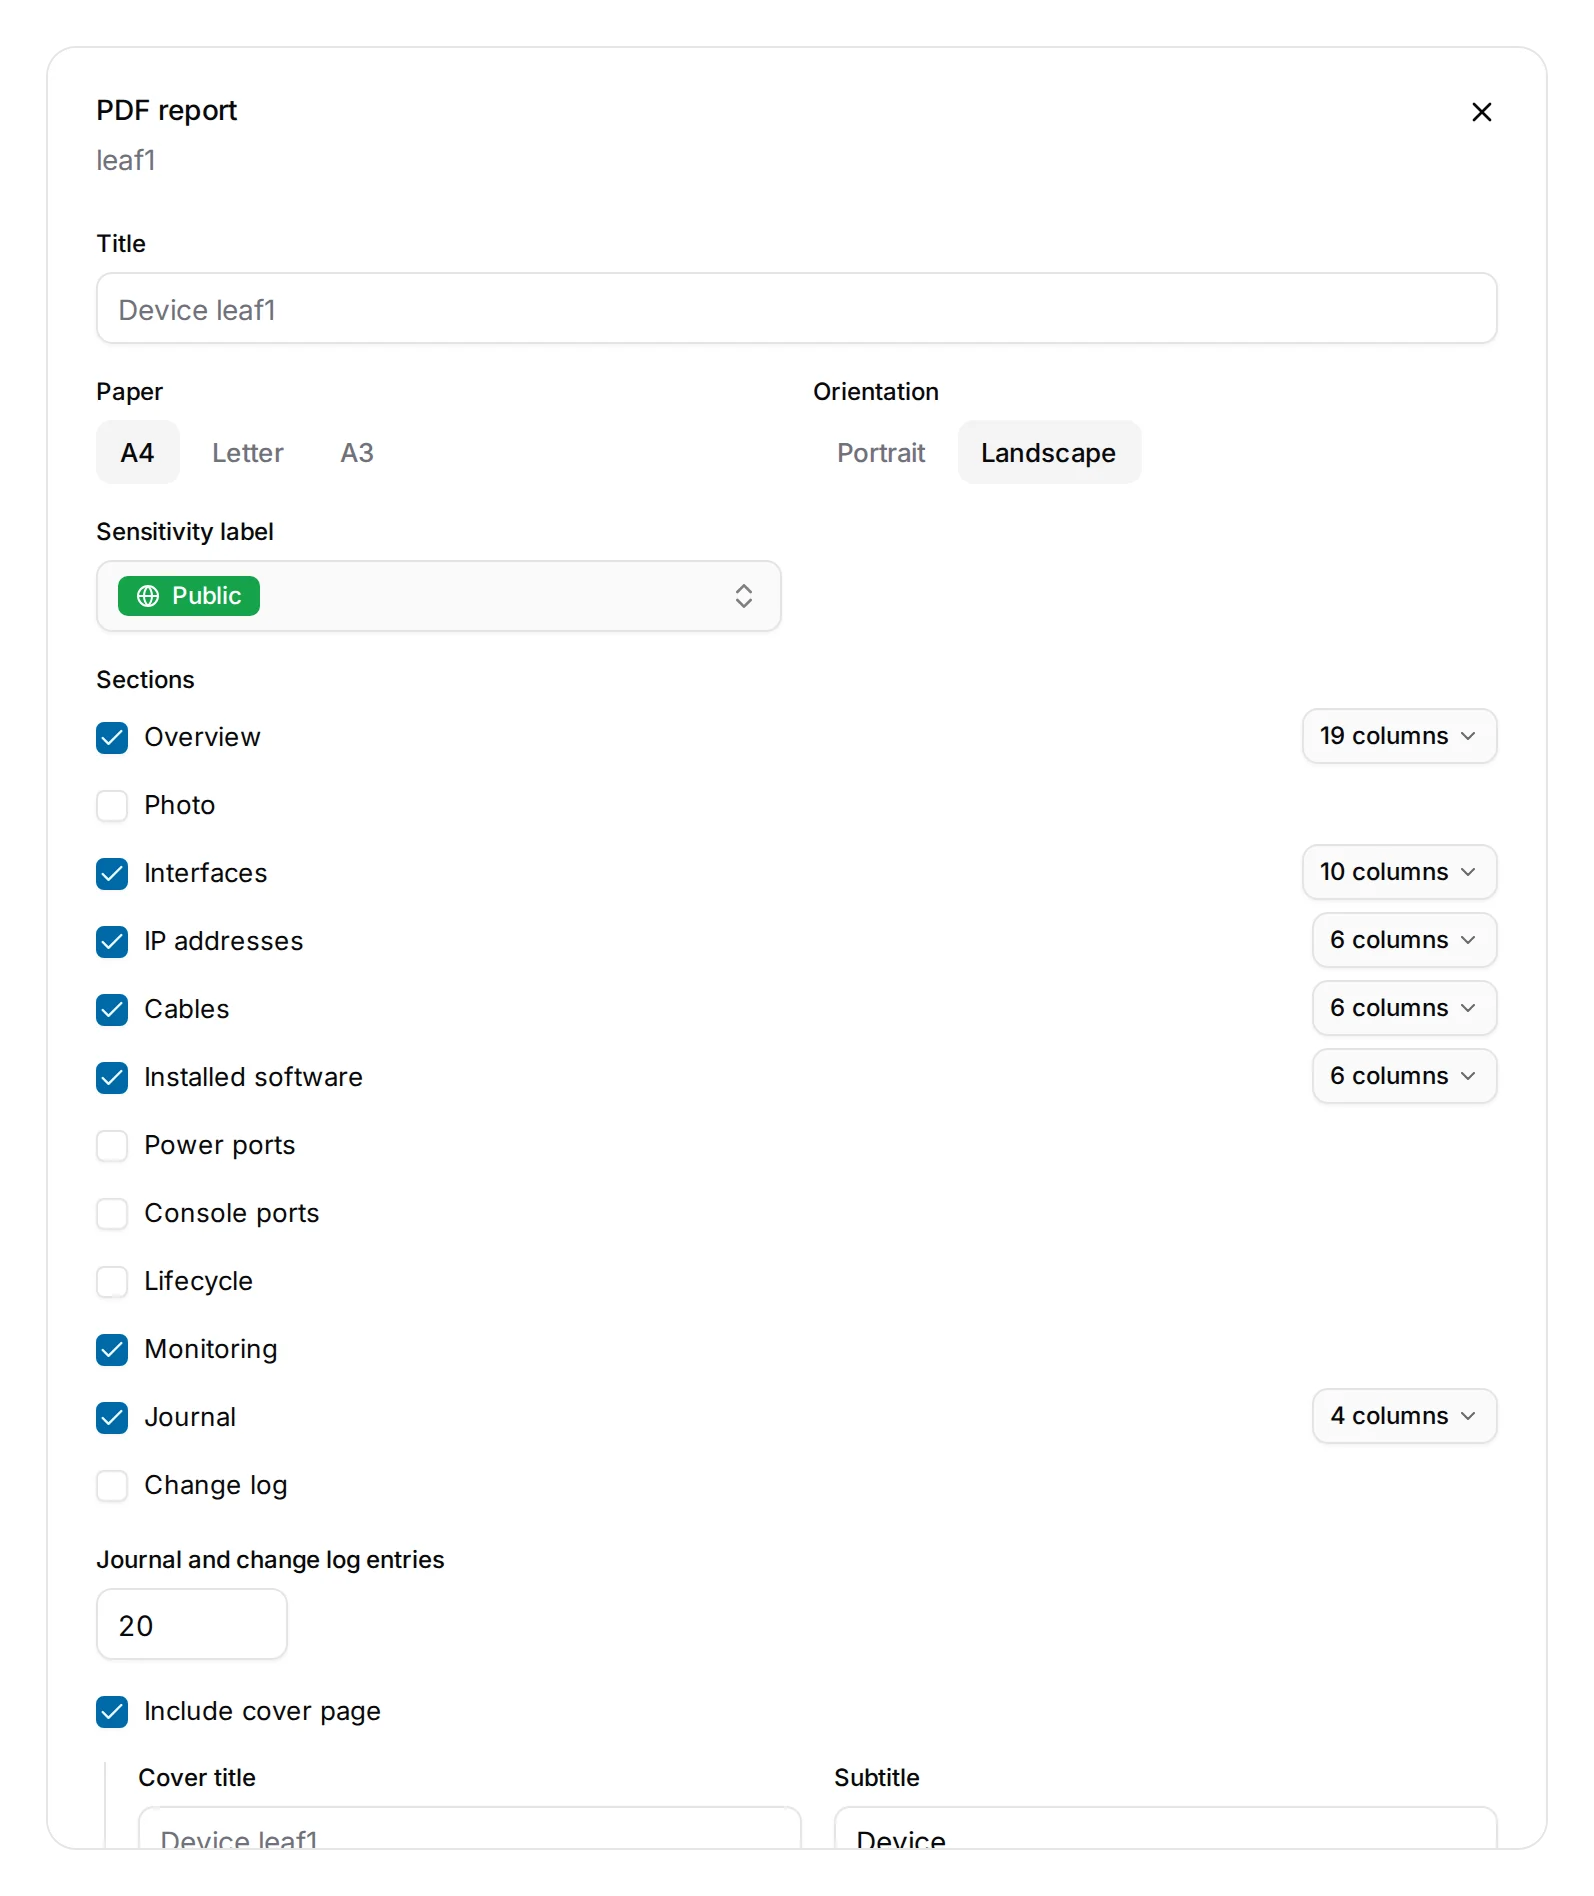
 Tick the sections, pick the paper, label it.
Here are two of them, straight out of that dialog. Each opens on a cover page with the tenant, the date, the version and the sensitivity label, then a summary, then the objects themselves.
Saved topology views print too: one PDF with each diagram, its devices, addresses and cabling, or a ZIP with one PDF per view.
Sensitivity labels are a catalog of their own, Public, Internal, Confidential and Restricted to start with, editable like statuses, with a default per tenant and cover colours and an image per tenant. Every time printed in a report, or on a topology, floor plan, rack or cabinet PDF or a spec sheet, is in your timezone with the zone named.
SBOM
Danbyte produces a CycloneDX 1.6 document of your devices and VMs with their operating systems and installed software: name, version, supplier, licence, package URL and CPE, with {version} and {os_version} templates (#468). It comes from the Devices and VMs lists with the current filters applied, from a site page, or from GET and POST /api/sbom/ by site, tag, role, device or VM. Components with no licence are counted, never guessed, and sites you cannot view are not named.
Applications and platforms carry an SPDX licence, and an install can override it. Danbyte ships its own SBOM with every release, as sbom.cdx.json in the bundle and the image, and it downloads from Settings → Updates.
Routing on the topology, and networking
Routers sit in movable AS boxes with their router ID, ASNs and loopback. eBGP and iBGP sessions are drawn with route-reflector arrows, OSPF and IS-IS adjacencies with their areas, levels and costs, and static routes to their next hop. There is a VRF picker and a checks chip collecting one-sided sessions, AS mismatches and OSPF or IS-IS mismatches. It exports to SVG, PNG, PDF and draw.io.
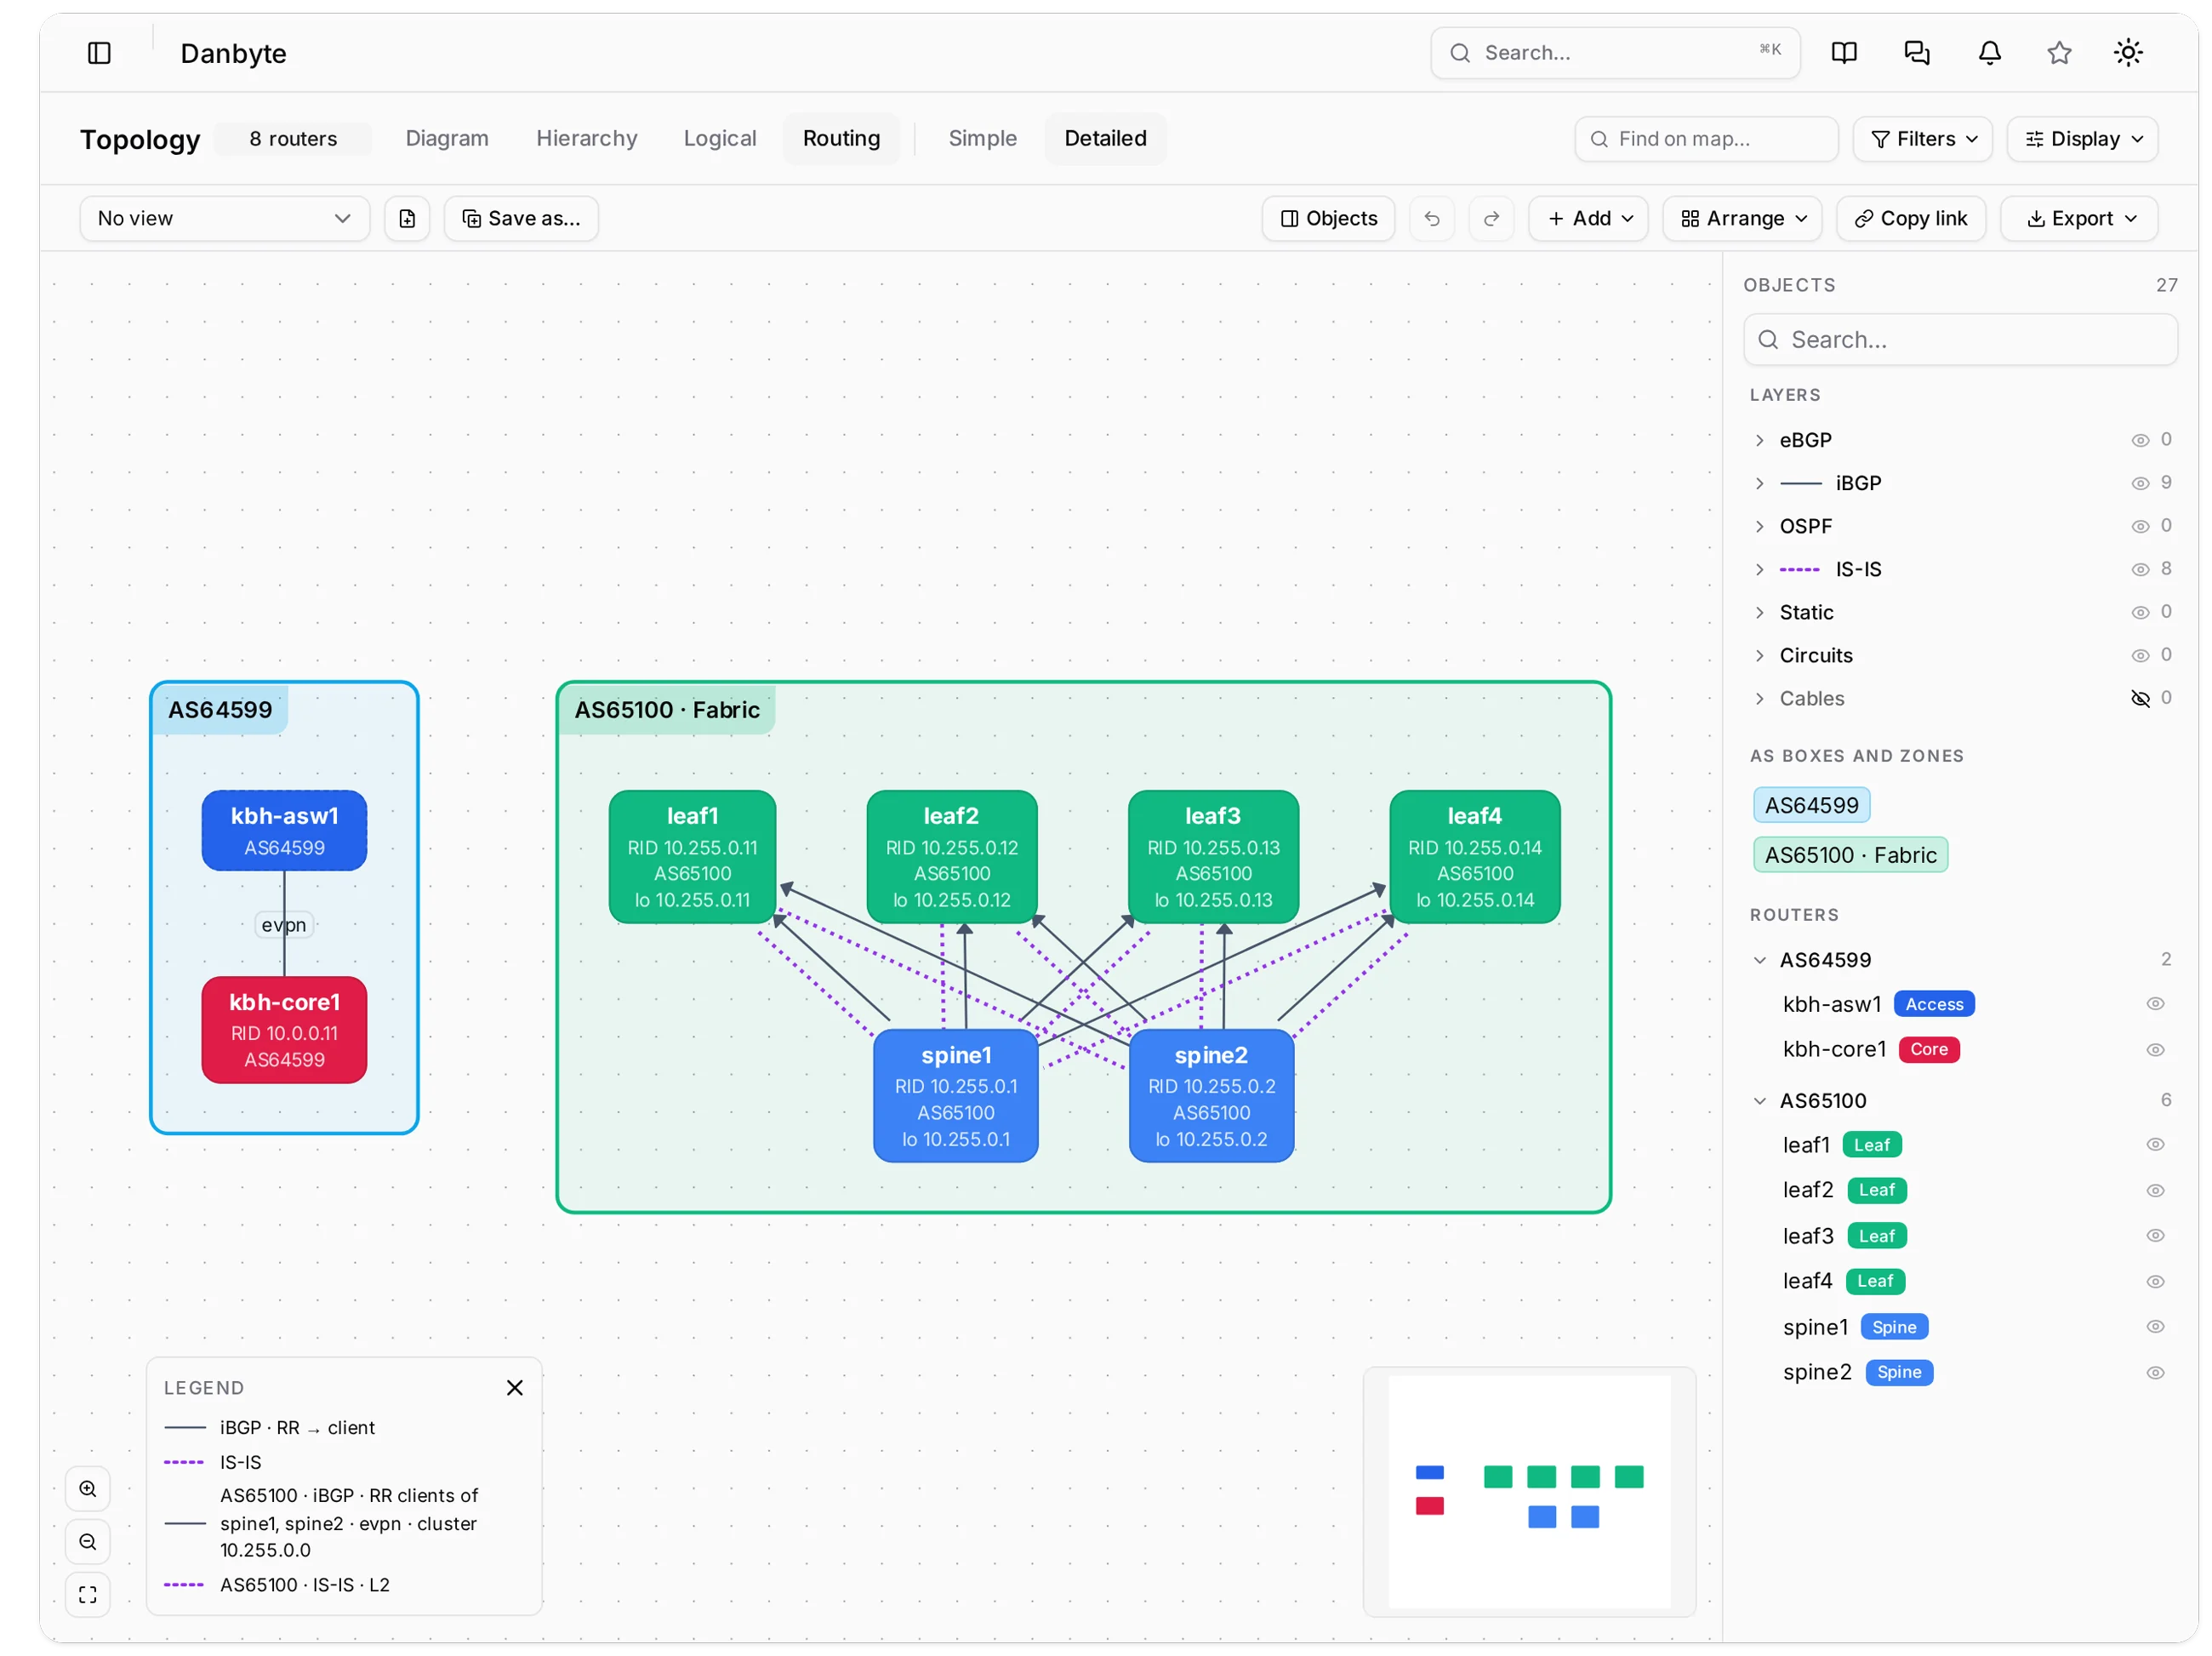
 Four leaves with their router IDs, iBGP up to the two spines as route reflectors, IS-IS level 2 dashed underneath.
The rest of the topology got attention too. Provider networks are a node on the map and a marker on the site map, with a line from each site's switch through its circuit (#466). A circuit between two sites is one dashed line between the two devices, labelled and coloured by circuit type. Cards grow and wrap so a name is never cut, in the map and in every export. Bendy lines keep their curve with their labels written along them, and every cable end keeps its addresses, IPv6 first when space is short. Bands take cards per row and an alignment, saved with the view, and a line type can be set per device and per band. /topology is now the saved views list, with who made and last changed each view. The map moved to /topology/map, and old links redirect with their parameters.
RPKI, MACsec and the rest
RPKI caches sit on BGP instances, policy rules take match rpki, and ROAs export as RFC 8416 SLURM from GET /api/routing/roas/slurm/.
MACsec is set per interface: cipher, replay window, and a keychain holding the MKA key, which never passes through the interface API.
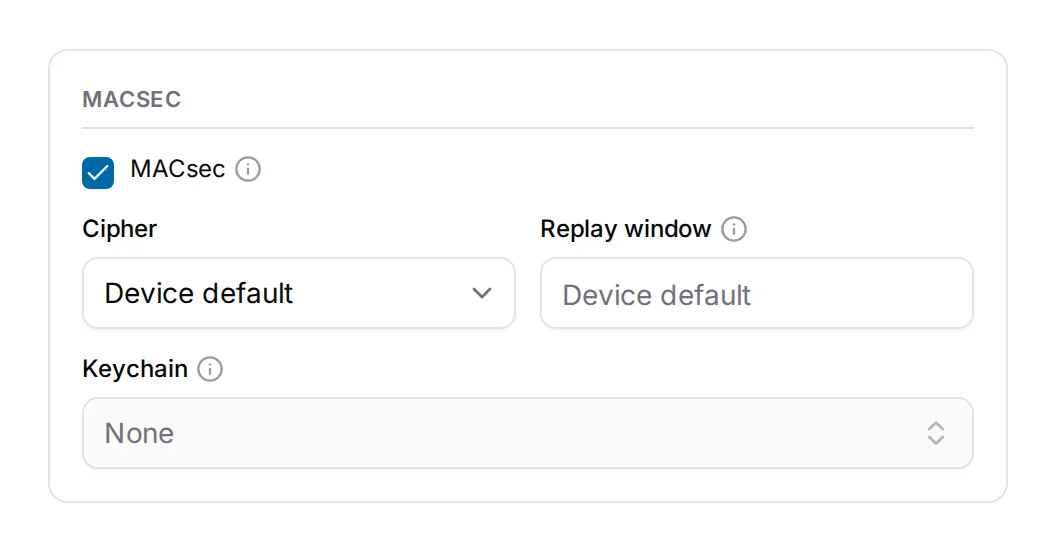
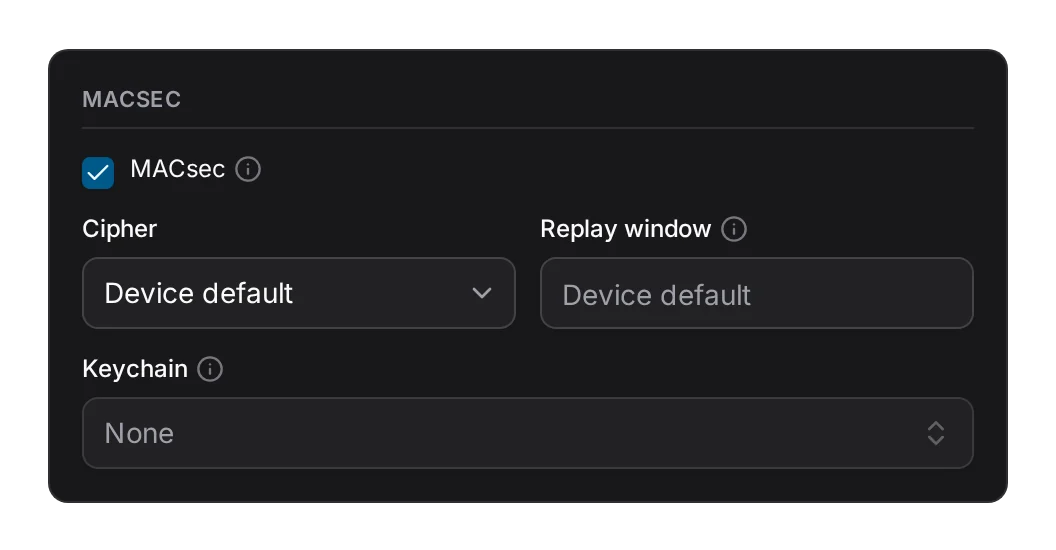
MACsec on an interface: on or off, a cipher, a replay window and a keychain, or the device's default for each.
BGP gains per-address-family settings, and maximum prefix with a warning threshold, a restart interval and warning-only, inherited from the peer group until you set it.
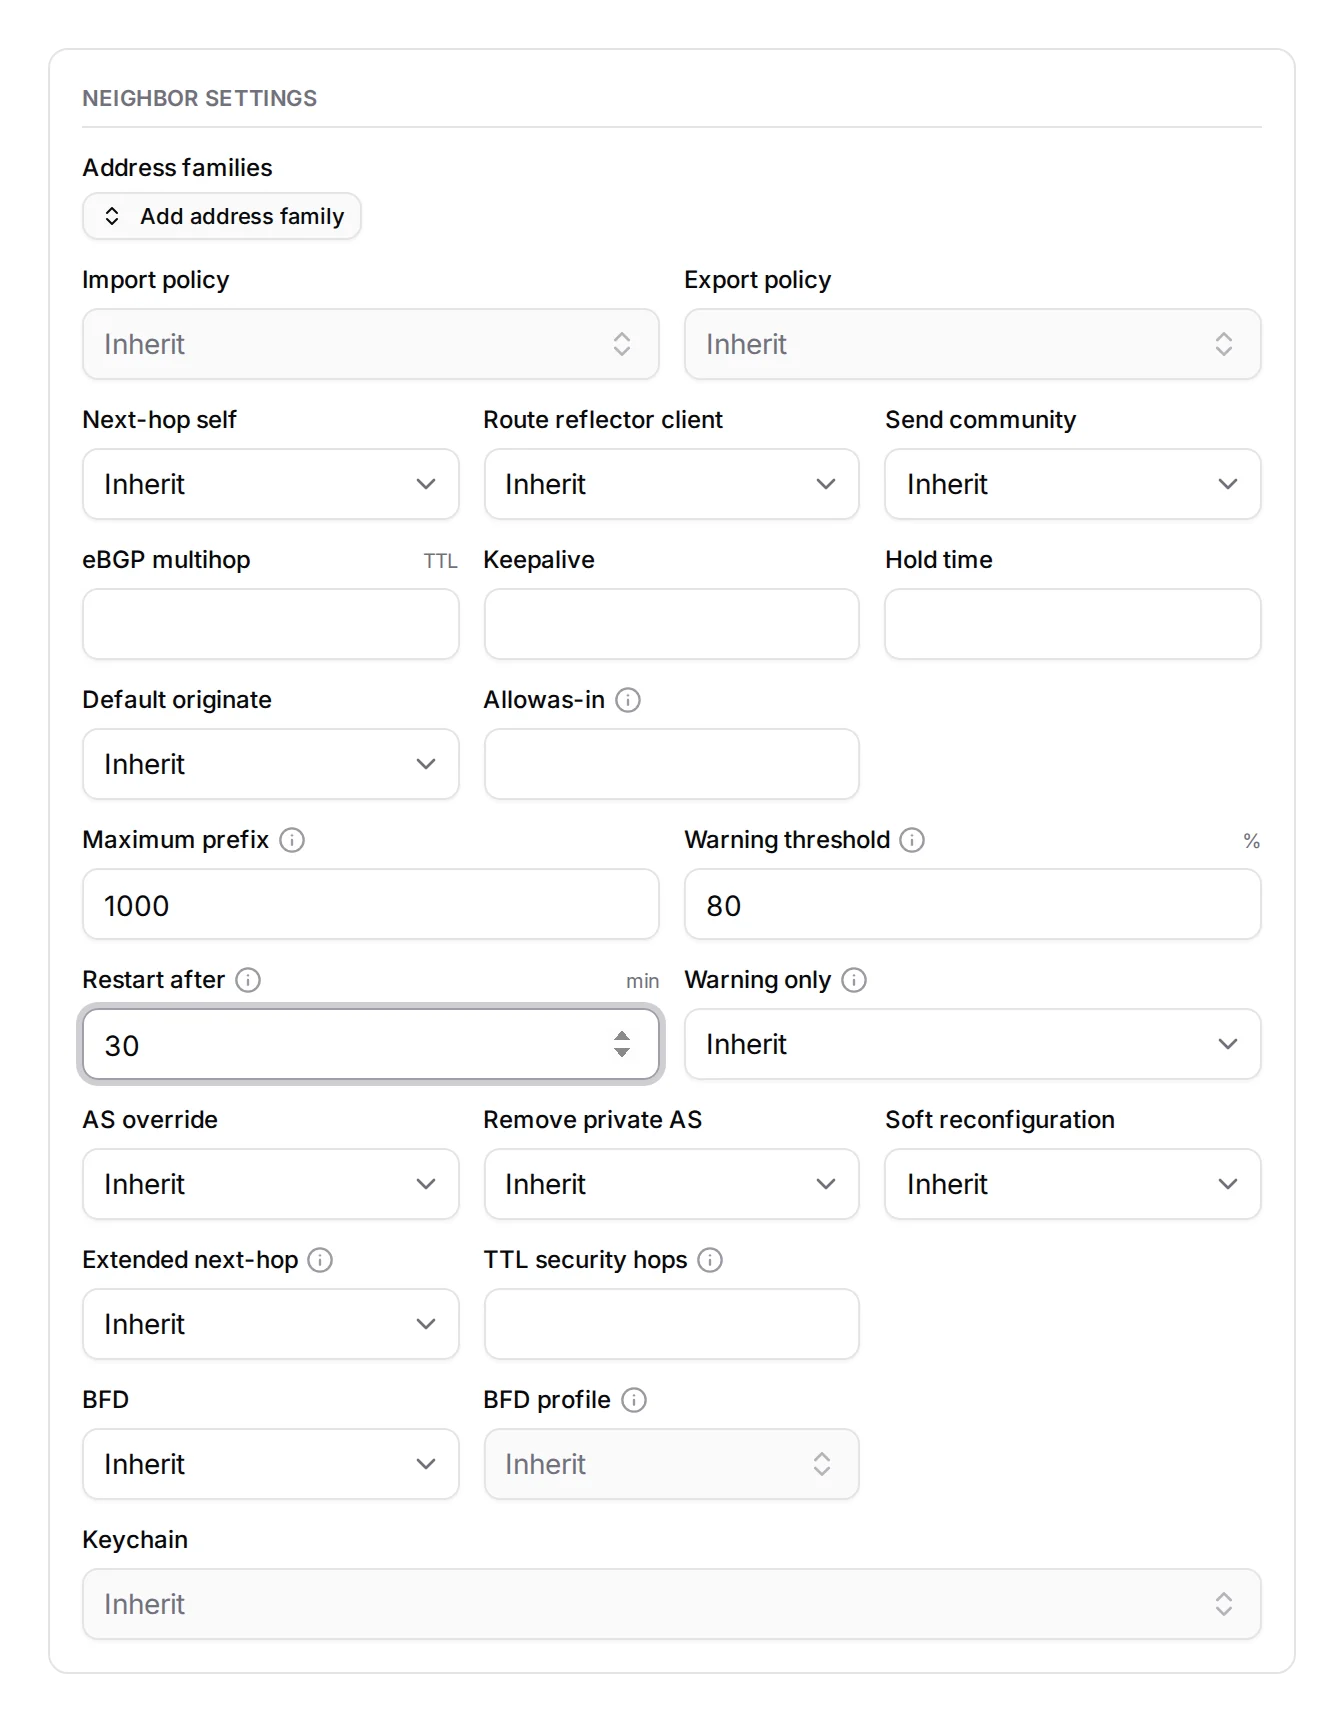
 Maximum prefix with its threshold and restart delay, everything else inherited.
Also new: WireGuard on tunnel terminations; LAG bond mode, hash policy and miimon; policy routing with ip rules, kernel tables and a NAT out interface; EVPN DF preference; a VXLAN interface type; automatic gateway that can be turned off per prefix, for loopback and point-to-point blocks; and bulk creation of IPAM records from DNS.
Proxmox SDN: the sync reads zones and VNets, which needs SDN.Audit on /sdn. NICs link to their VNet, and a cable gets a Proxmox VNet field, copied from a pve_vnet interface custom field on upgrade. A VNet with two NICs can become a cable, off by default. A source's Network plan downloads as JSON for a runner to act on. Danbyte only ever reads from Proxmox.
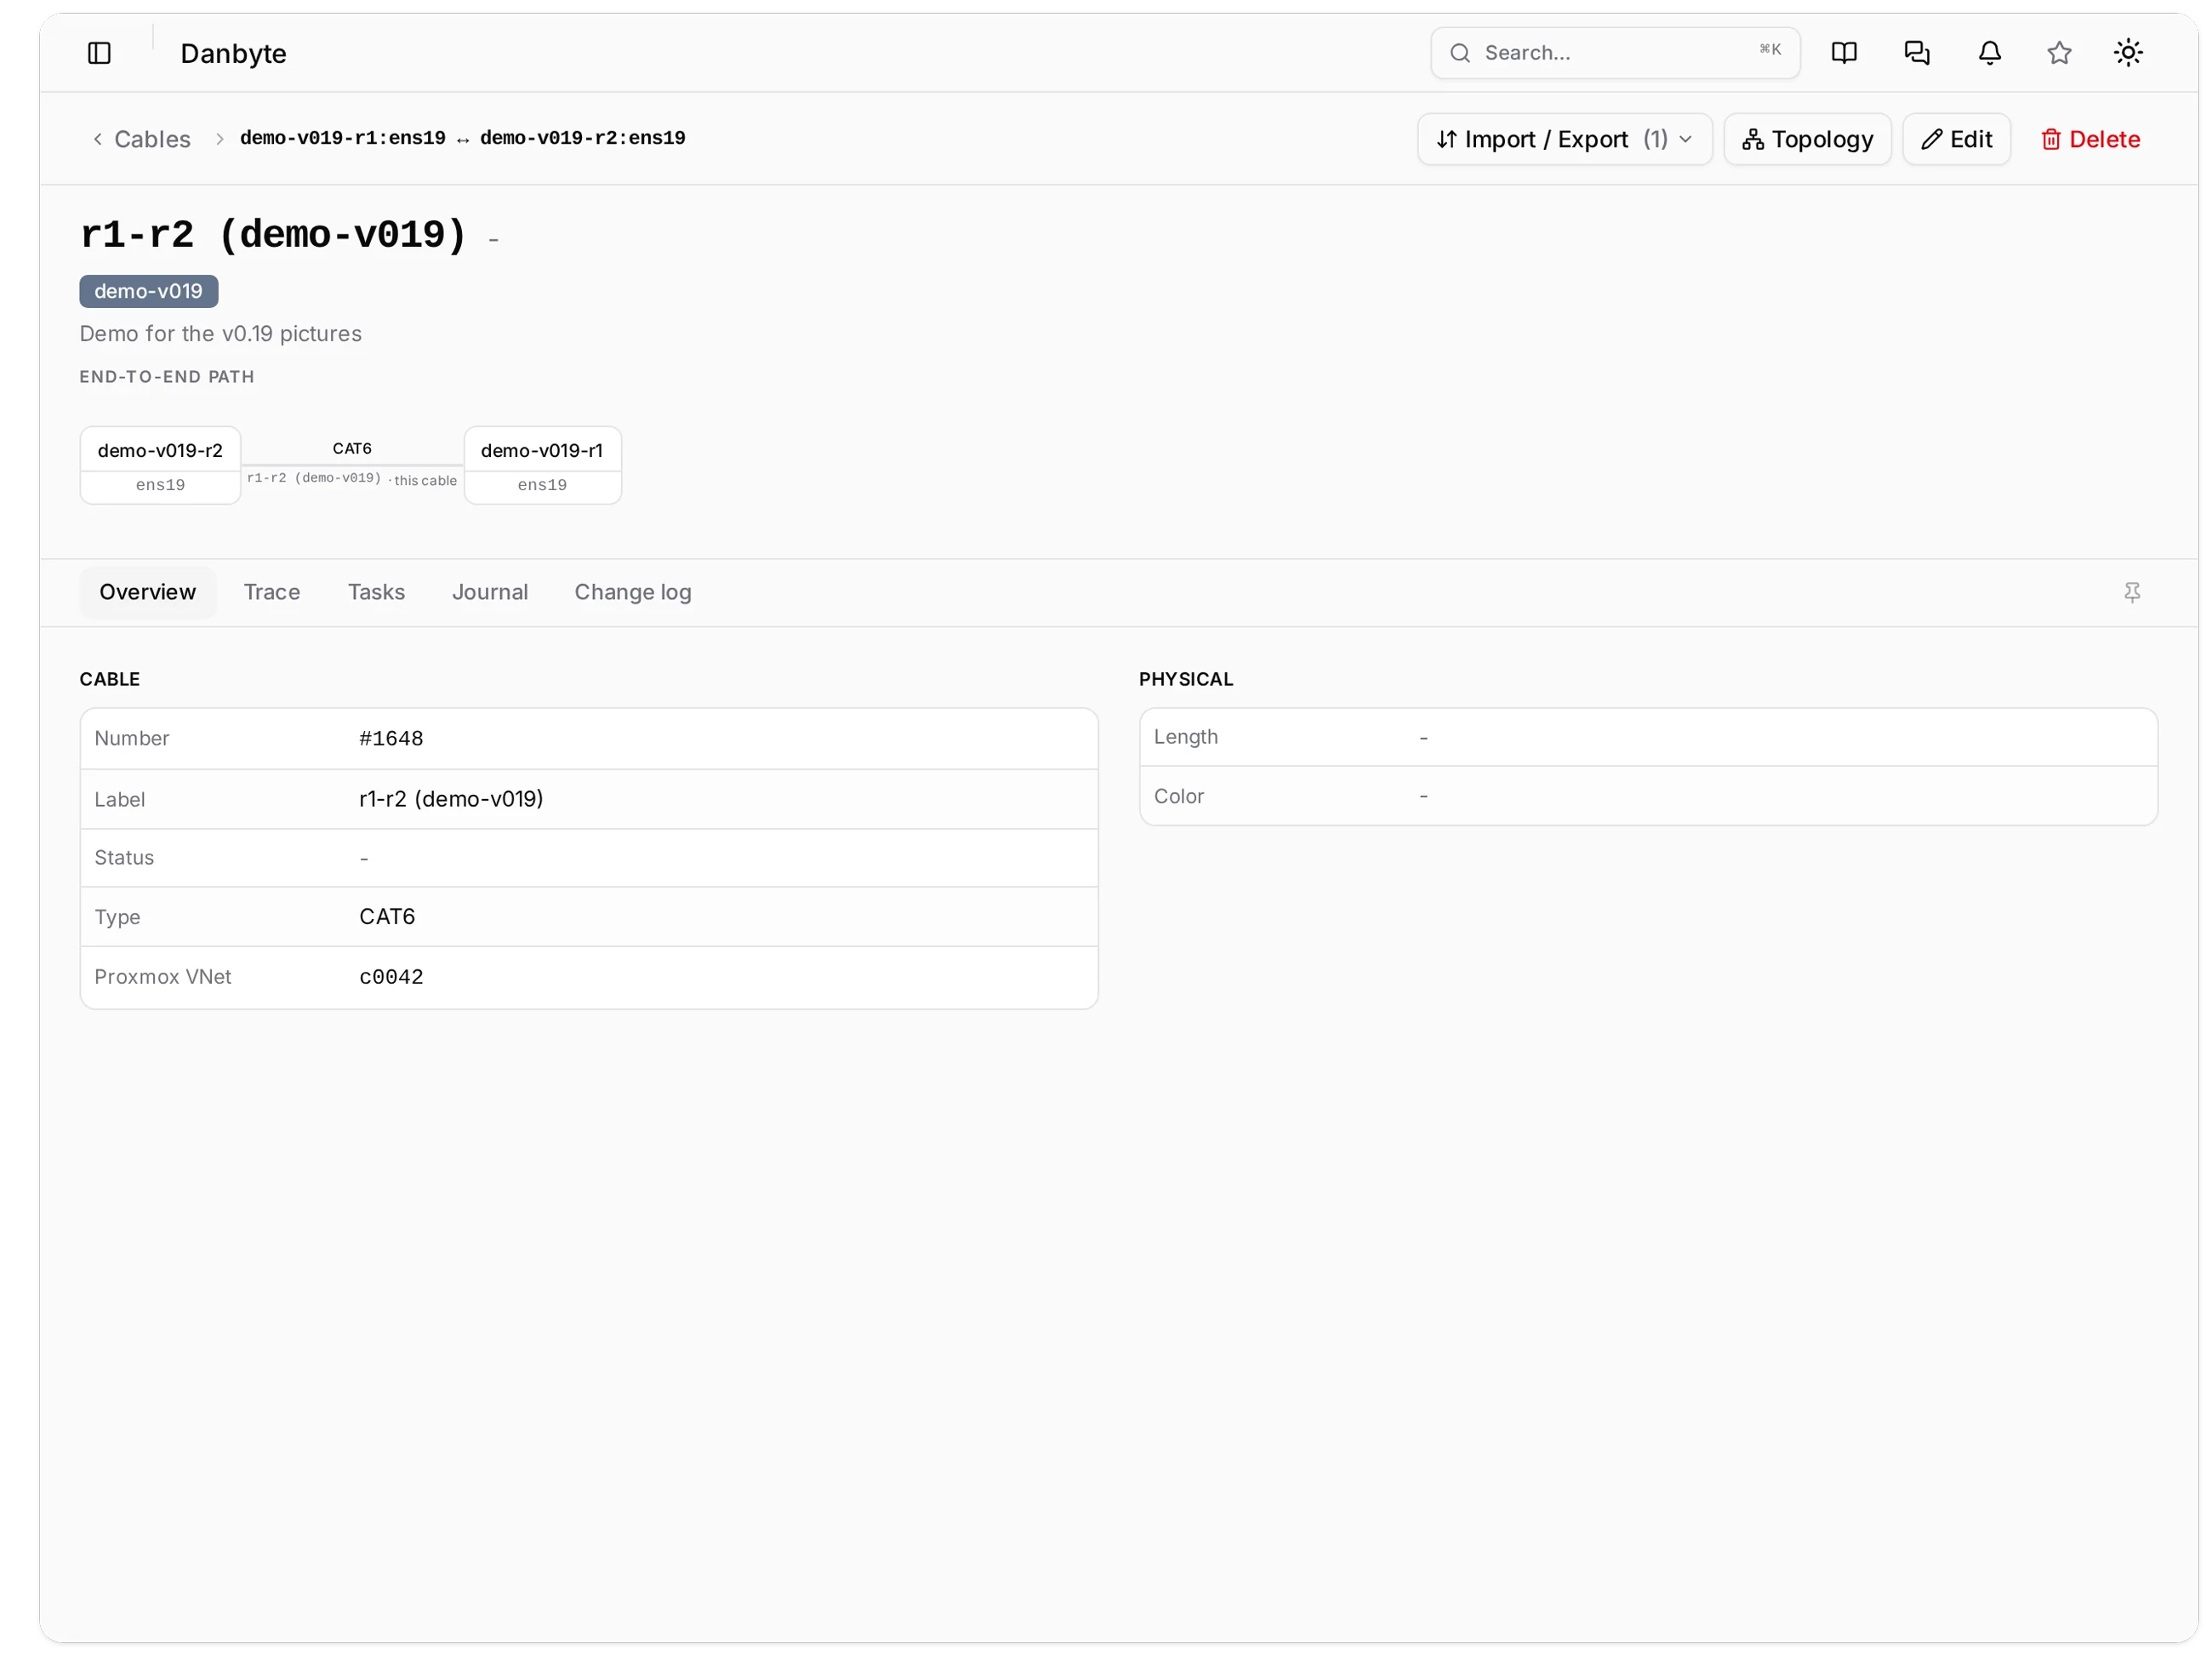
 One cable, one VNet.
Also new
Cooling
Device types, module types and devices record how they are cooled and how much heat they put out. Racks and rack types record what cooling they take and how much heat they remove. Heat load against capacity then appears where capacity already did: on the rack page, in the racks list, on floor plans coloured by Cooling, on the 3D rack card and on the site's Capacity tab, with filters for capability, free cooling, method and mismatch. Blades and modules count towards the rack their chassis is in (#434, #469).
The plant itself is modelled too: chillers, CRAHs and in-row coolers, and the loops running from them to the racks, with capacity, flow and temperatures. They get lists, bulk edit, import and export, and a rack gets a Cooling feeds tab. A rack with no capacity of its own is measured against its primary feeds. Devices and device types carry cooling intakes and outflows fed from a feed or a CDU, and a device's overview shows the whole cooling path.
Rack placement now checks cooling. A rack that states what it takes refuses liquid, hybrid or immersion hardware it cannot cool, including blades and modules going into a device inside it. Air-cooled gear goes anywhere, racks with no stated capability take anything, and placements that already exist are kept and listed under Mismatched cooling.
Power panels, power feeds, cooling sources and cooling feeds all get an Affected tab listing the racks and devices downstream. Plan maintenance opens an event with those impacts already filled in.
Application flows
An application can state the traffic it needs: from an address, a range, a prefix or anything, to another, by protocol and ports, with a status and a direction (#163). Flows tabs appear on applications, devices, VMs, IP addresses and prefixes.
The Application map draws them. Its Tree view is the application hierarchy with its hosts. The Flows view puts protocol and ports on each line, arrowheads by direction and colour by status. It has filters, search, a legend, detail panels and PNG, SVG, PDF and draw.io export, and an application's Diagram tab embeds it.
Flow requirements update themselves. An application states the flows it needs, with ends on its own hosts or on another application's, and Danbyte regenerates them as installs, addresses, hosts and services change. The change-log entry says what caused each one.
Compliance
Compliance opens on a new Overview tab with counts, a card per rule worst first, and top offenders. Violations are built for triage, with facets, grouping by rule, and Acknowledge, Snooze or Reopen with a note, behind a compliancetriage.change permission that Administrator and Operator have. The rule builder takes object types, a scope and conditions, and counts the matches as you build.
Devices, cables and lists
Cabling several ports no longer means reopening the form. Save and add another moves both ends to the next free port, and Many at once pairs ticked ports on two devices (#454). Device names take a range, so DK-RDS-[1-10] creates all ten in one go, all or nothing, up to 128 at a time.
Every list has bulk select, with export, bulk edit and safe bulk delete wherever a single page allows them, plus Enable and Disable, Activate and Deactivate, Requeue and Cancel where those exist. Secrets are never exported. Devices and VMs gain bulk delete; VMs and platforms gain bulk edit.
Tags can be merged from the Tags page, and duplicate names are flagged. A device or VM's IPs tab lists every address with an Assigned to column, and VMs have that tab for the first time. Search results are links, so they open in a new tab. Wide tables keep their scrollbar at the bottom of the window. Tasks can be added from an object's Tasks tab and from the calendar.
Faster
A lot of this release went into why big lists were slow.
The prefix list took 30 seconds with 5,000 prefixes; grouped tables are paged now (#479). The Devices, Interfaces, Cables and VMs lists are paged, sorted, filtered and faceted on the server, fetch only the fields the table shows, and no longer stop at 10,000 rows (#482, #483, #487). Natural-order device and VM lists and prefix containment lookups got indexes (#480, #484).
Around them: the update check no longer blocks workers when GitHub is slow, and the release list is cached for six hours (#478). Web workers keep a database connection for 60 seconds instead of opening one per request (#481). The frontend's files are no longer revalidated on every page load (#485; see the root step under Upgrading). The session is written at most once a minute instead of on every request (#486). The first page load is smaller, the import/export type list is cached and the Devices page makes fewer queries (#488). A device or VM page counts its addresses in one query (#455), and the SLA agreement list no longer queries channels per row (#460). The dashboard reads rollups only for the widgets on show, which took a busy install from about 9.5 seconds to 0.4.
Fixes
Lists a token client read only part of (#447). The device form's Card lines heading toggling Name only when clicked, and screen readers announcing it wrongly (#445). Unlabelled controls for screen readers, with a test that fails on new ones (#461). The Jobs page content area being unreachable by keyboard (#470). Windows DHCP sync failing on long client ids, where a bad row is now skipped (#463). The Docs link on Docker installs pointing at port 8001; the docs are built into the web image and served at /docs/ on Danbyte's own address (#472). The site map on portrait phones, where the objects panel covered the map (#476). The cramped calendar toolbar and compliance condition rows on phones (#477). A monitoring test that failed between 00:00 and 01:00 UTC (#475).
And: a catalog entry with a name already in use being saved under a new slug; VM custom fields not validated on a single save; a new floor plan from a Location page saving without its site; text overflowing the rack card in the 3D floor plan; turned tiles on free-layout plans sitting at the wrong angle or size in 3D and in SVG and PDF export; a 3D view failing to open after a deploy replaced its files, which now reloads once; floor plan tiles linked to a power panel or feed opening its edit form instead of its page; ?cluster_site= on the power panel list failing with a server error; detail panels on maps sitting under sticky table headers; and the tag picker list not scrolling inside dialogs.
Security
The two biggest fixes are API limits. A few calls with a huge page_size could block every worker, so pages are capped and large pages limited per user (#452). Each new API token used to bring its own set of large-page slots, so tokens are capped per user and the slots are shared (#457). Parallel password and two-factor guesses could slip past the lockout, because attempts were counted after they were checked instead of before (#449). Passwords set by an admin or at bootstrap skipped the password rules (#489).
HSTS and X-Frame-Options were being sent twice with different values; nginx owns them behind the proxy now (#490). Signed-in API responses had no Cache-Control and are now private, no-store (#491). Interface bulk add and bulk update accepted tag ids from another tenant, as did writable relations elsewhere (#456). SSH host keys could be moved to another device after upload (#458). Zabbix and PRTG error text could include the API key (#459).
Then a run of leaks where a reader was told about objects they cannot view. Floor plan tile links, site map rows, application flows, cooling intakes and coverage titles now show Hidden (#453). An interface's link peer no longer names a cable's far end on a site the user cannot see (#473). Counts across tenants, prefixes, VRFs, VLANs, route targets, L2VPNs, tags, contacts, clusters, locations, cabinets and floor plans no longer include rows the reader cannot view (#438, #448).
Notification channel webhook URLs and PagerDuty routing keys were readable by every viewer, Read-only included, and a failed test send echoed the webhook path. They are stored encrypted now and never returned. The API schema was served from a cache filled before the permission check. Floor plan cables showed to readers who could not view them. A tag page's Tagged objects count included other tenants. Deleting a certificate issuer left its ACME account key in the secret store.
Dependencies: vulnerable frontend development dependencies, vite, launch-editor and follow-redirects are updated (#462), along with Django 5.2.19, Django REST framework 3.18, and new minimums for Pillow, PyJWT, cryptography, certifi (a distrusted root removed), dnspython, pyasn1, brotli, msgpack and autobahn.
Upgrading
Prefixes whose CIDR is not an address are deleted. The upgrade adds a database index that reads every prefix's CIDR as an address. A prefix holding anything else, say banana or 10.0.0.0/33, would make the index build fail and roll the whole upgrade back. Migration api.0265_drop_unparseable_prefixes runs first and deletes them, logging each one to the upgrade log as a danbyte.migrations warning with its id, value and tenant. This is unlikely to delete anything: prefix input has been validated since #47, and an earlier migration already turned bare addresses into host prefixes, so only junk saved before that validation existed is affected, and it already broke prefix search and filters. Take a backup first if you want to be sure, and check the upgrade log afterwards for deleting prefix lines.
On systemd installs, root has to run one step after the upgrade. It re-renders the nginx site from this release's bundle. The upgrade shows the step on its After this upgrade card with the commands, including downloading the bundle again, because an upgrade from the app deletes the uploaded one. It brings two changes: nginx serves the frontend's build files under /assets/ itself, compressed and cached for a year, and nginx lets Danbyte frame its own pages (X-Frame-Options: SAMEORIGIN, frame-ancestors 'self'). Until the step is done everything works, only without the caching, and the topology PDF report stays at Drawing…. If you manage nginx yourself, add the /assets/ block and the $danbyte_asset_cache map from deploy/nginx/danbyte.prod.conf.template, change DENY to SAMEORIGIN and frame-ancestors 'none' to frame-ancestors 'self'. Docker installs need nothing.
If a script of yours reads a whole list out of the API, it has to follow next now. A list request without page_size answers 100 rows and a next link, where it used to answer up to 10,000, and a page_size over 2,000 is cut to 2,000. The web app and the Python SDK already follow it.
Behaviour changes. List endpoints answer 100 rows by default (API_PAGE_SIZE), cap page_size at API_MAX_PAGE_SIZE (2,000), allow two pages above 1,000 rows in flight per user across all their tokens and answer 429 with Retry-After for a third; an invalid paging setting stops the service at start. A sort column or facet the API does not know is a 400 instead of being ignored. A user may hold at most API_MAX_TOKENS_PER_USER (25) unexpired tokens. An id on a writable relation that is unknown or belongs to another tenant is a 400 field error everywhere, and interface bulk add and update never create a tag from a name. Notification channel credentials are write-only: GET /api/monitoring/channels/ answers url_set and routing_key_set instead of the values, and the upgrade moves stored values into the encrypted store and restarts the services. A deactivated tenant's Outposts and syncs stop. Rack placement checks cooling. Time bars colour by time left. Tag names are unique per tenant, ignoring case, with existing duplicates left for you to merge. A catalog entry with a name already in use answers 400. SSH host keys cannot be edited. BGP address families have their own rows, with the old list kept as a view. Every floor plan names a site, backfilled, and a plan without a location covers the whole site; floors that shared a location before 0.19 become one floor plan per location, with nothing merged across locations, renamed or deleted. Container prefixes get no automatic gateway. Software versions carry a source, and an integration never overwrites a manual or imported value. Users, groups and permissions guard against lock-out. Script export and import see only the scripts you can see. DHCP scopes and DNS zones are export-only. A single device name containing a range is refused. /topology is the saved views list and the map is at /topology/map, with redirects. Compliance opens on Overview. The Applications list opens in tree order. Webhook and AWX deploy payloads include run_id. The sidebar regroups DCIM into Devices, Catalog, Racks & cabinets and Connections, adds Software & lifecycle, renames Power to Power & cooling and moves Routing between it and Wireless. Links and permissions are unchanged.
New units. danbyte-extmon-sync.timer drives the external-monitor beat PRTG runs on, and danbyte-scripts also runs sweep_deploy_pipelines every minute. make install-services and the upgrade install both.
Permissions. Existing site viewer and editor roles gain the new types, including cooling sources, feeds, intakes and outflows, installed software and applications, application groups, PRTG rows, device profiles, rooms, location types, floor plan areas, walls and cable routes, policy rules and RPKI caches, unless an admin removed a type from the role. django-rq and django-taggit each bring one small migration.