
Data center floor plans and 3D rack views in Danbyte
Danbyte draws floor plans, a geographic site map and 3D rack views from the inventory you already keep, so the drawings match the records.
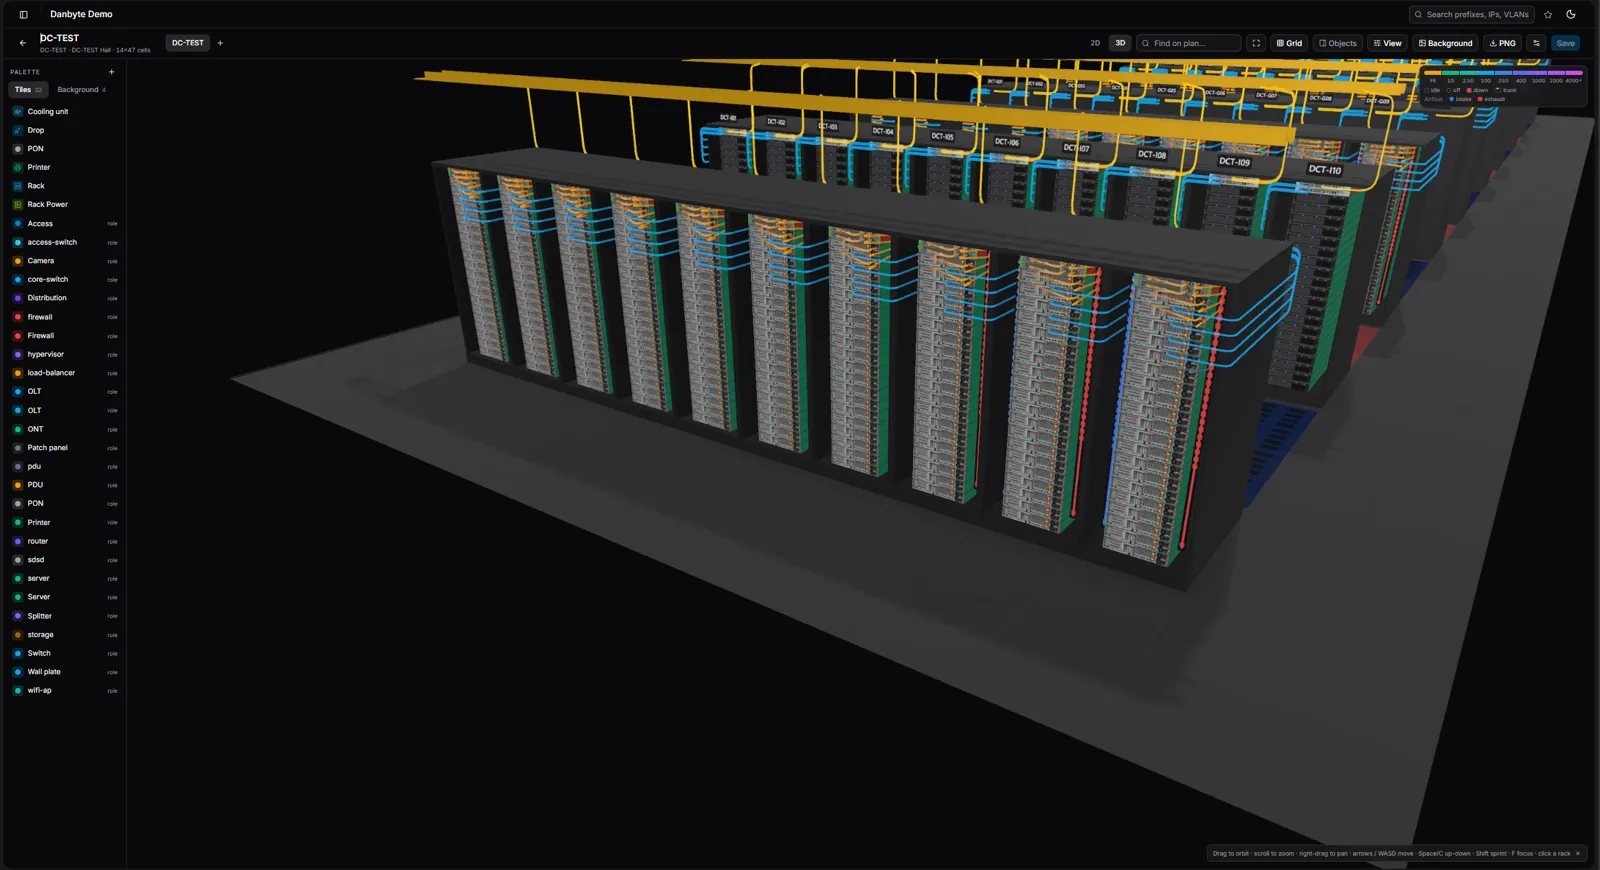
A 2U firewall arrives on the loading dock and someone has to decide where it goes. The DCIM says rack R14 has "4U free", but it does not say whether that space is at the top, at the bottom or split across the middle. You also need to know whether R14 is on the hot aisle or the cold one, and whether there is a spare 10G port near it or whether you will have to pull forty feet of fibre across the hall. You can answer all of this from tables, but it means cross-referencing three views while keeping a picture of the room in your head. It is quicker to look at a drawing of the room.
Many DCIM tools are a database with a table view on top. They know what is in each rack unit, but they do not draw it. When you need an answer about space, such as where the free units are, where the heat is or how a cable runs, you go back to a floor sketch on a shared drive that has not been updated for the last two migrations.
Danbyte draws the room from the model. Everything you record, including sites, racks, devices, ports and cables, has a position, and you can move through it on screen.
Drawing a floor plan
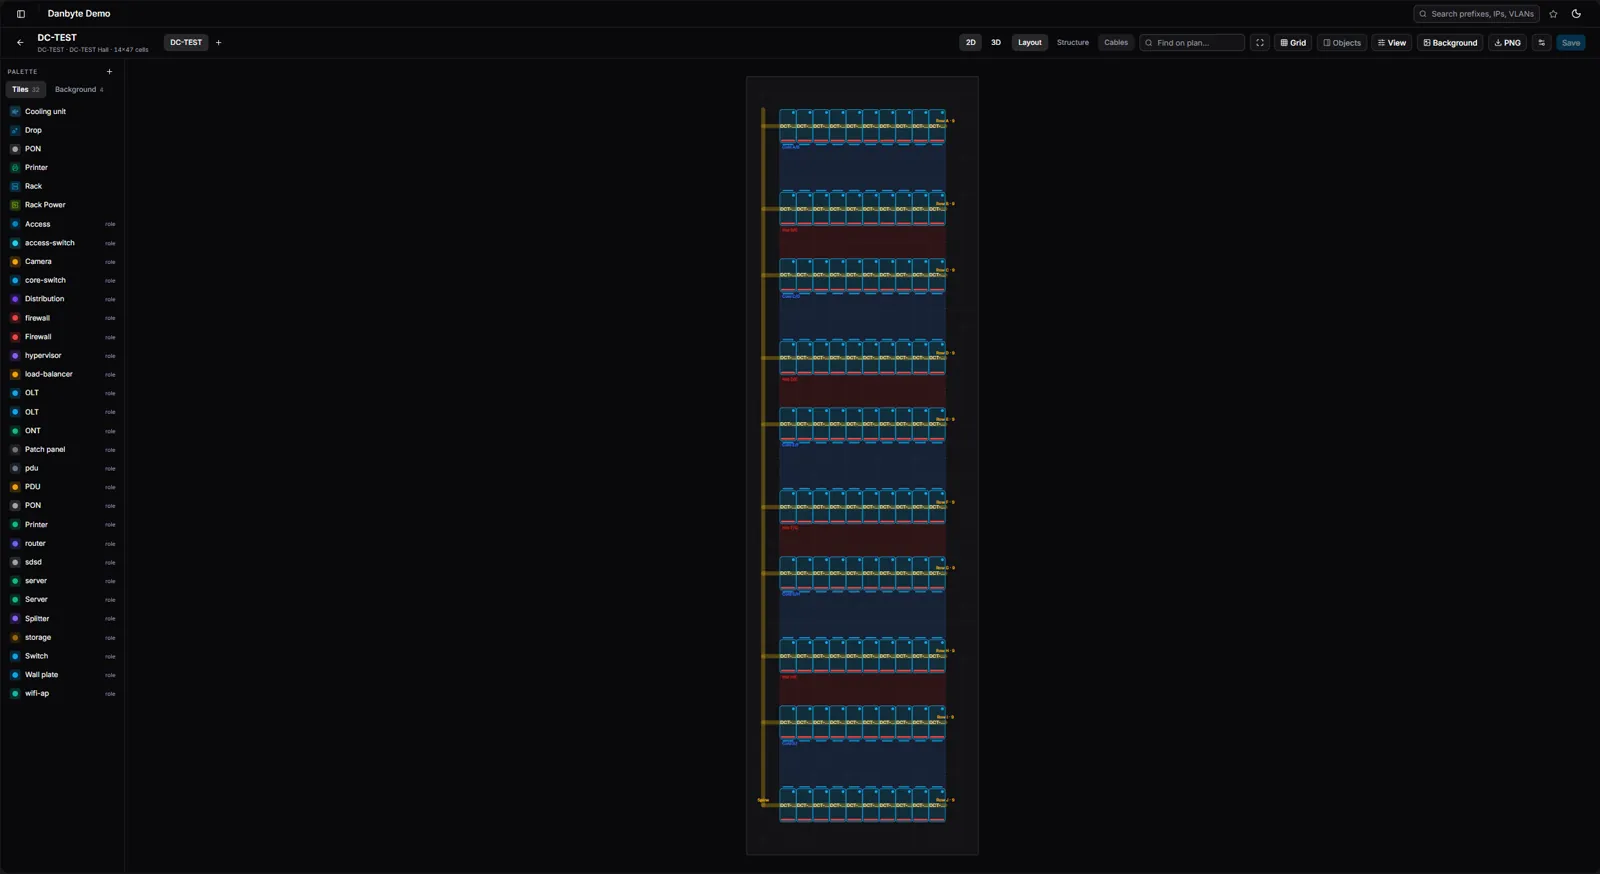
A floor plan in Danbyte starts as a grid that represents a room or a site. You place objects on it: racks, floor tiles and cameras. Racks sit on the grid, so a row looks like a row and an aisle looks like an aisle. Each camera shows its field-of-view cone on the plan, which is a quick way to find a corner of the hall that no camera covers.
Plans can be nested. A campus contains buildings, a building contains halls and a hall contains rows. You can go from the site down to a single rack in the same tool, because the plans are one connected model and not a folder of separate diagrams.

The plan uses the same data as the inventory
You draw the hall once, and the layout stays correct because it is the same data your inventory uses. When you move a rack on the plan, every elevation, port and cable tied to it moves with it. The floor plan is a view of the inventory, so there is no second copy to keep in sync.
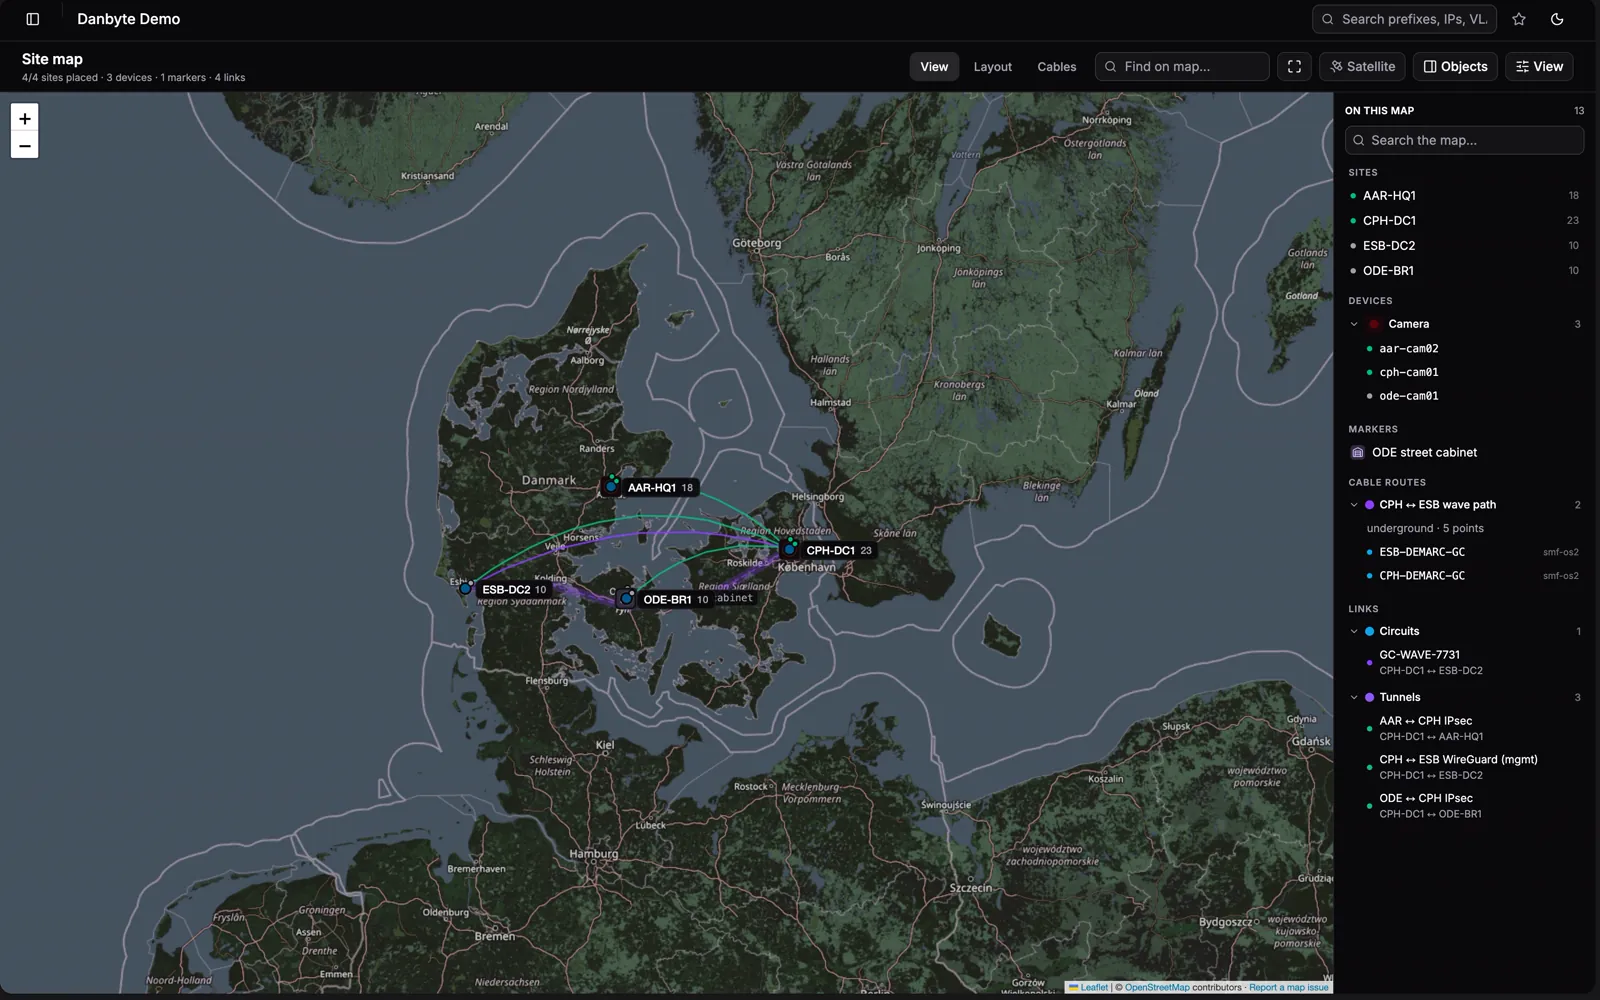
One level above the floor plans is a geographic map of every site you run. Each location is shown at its real coordinates, and the circuits and fibre between sites are drawn as links between them. When a carrier reports a cut between two cities, you can see which sites have lost a path without searching a spreadsheet of circuit IDs.
Racks in 3D at their real U-height
When you open a rack, you see it as it stands in the room: a 3D rack elevation with every device at its true U-height and real depth. A flat rack elevation diagram shows a column of rectangles. The 3D view looks like the rack you would see if you walked up to it.
The faceplates are not generic boxes. Each device type has its own photos, so the front panel is drawn from the real hardware, with the port layout, labels and indicator LEDs where they are on the device. A technician reading the screen sees the same panel they will see when they are standing at the rack.
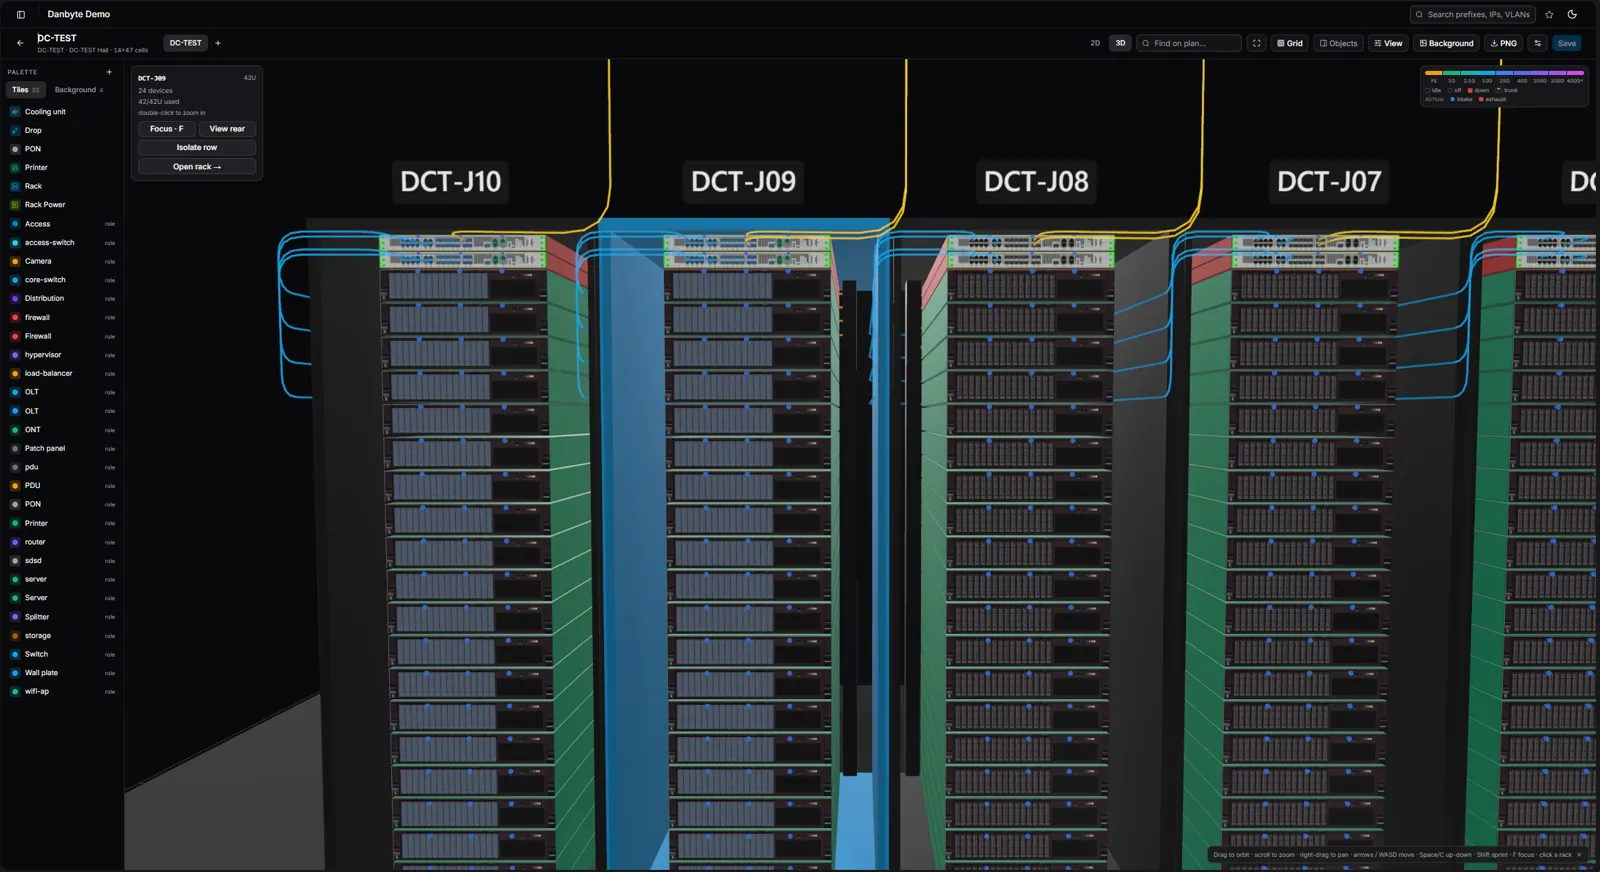
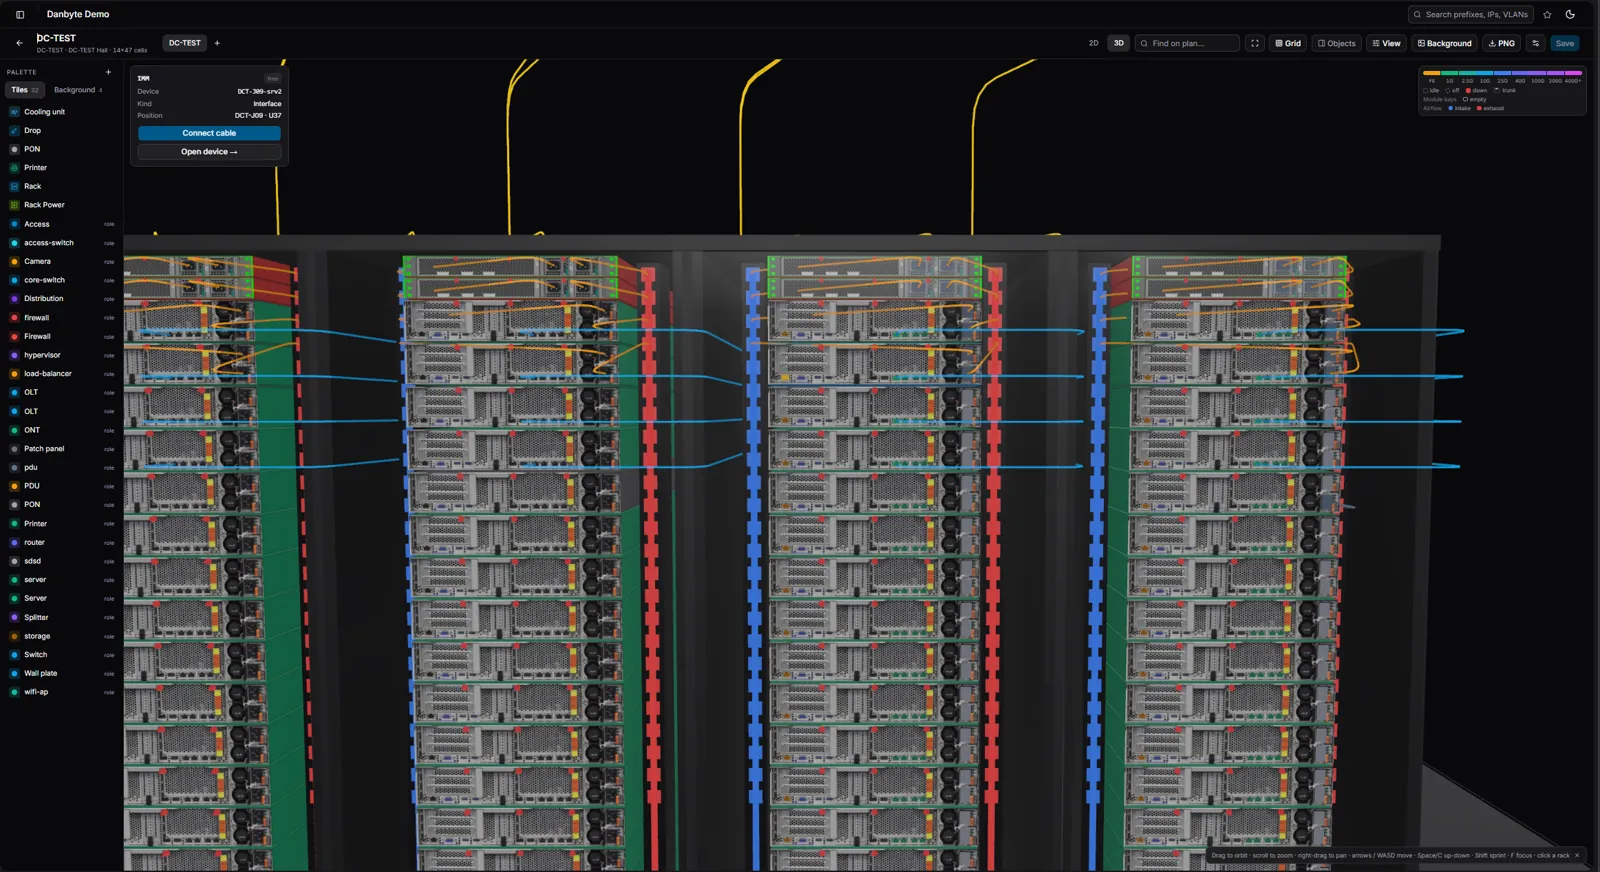
Cabling is hard to show in a flat drawing. In Danbyte you click a port to trace its cable end to end, from a device in the rack, along the rails, to the point where the far end terminates, through as many patch panels as there are on the way. Cables run along the rails as real ones do, so a crowded channel looks crowded. Speed tiers are colour-coded, so a 1G uplink in a bundle of 25G links is easy to see before a cutover.
The 3D view reads the same live inventory, so drift is shown on the panel. If a port is documented as connected and the switch reports it down, or the switch reports it in use and the record says it is free, the port is marked. The person who is about to patch it sees the difference at the port.
There are three other ways to look at the same data:
- Zoom out to the whole hall to see the rows, the aisles and where the empty units are across every rack at once.
- Go to the rear to see the cabling, the PDUs and the power feeds behind the front panel.
- Switch to a 2D layout with hot- and cold-aisle shading when you want the classic layout and a view of the thermal zones. The shading comes from the hot-aisle and cold-aisle zones you draw on the plan, and it shows which aisle supplies cold air and which racks back onto a hot aisle.
The 2D layout lets you check capacity and cooling together. The 2U firewall from the loading dock goes into a rack that has both the space and the airflow for it, and you can check both from your desk.
What the views are used for
Questions about space are operational questions. When your data center floor plan software is connected to your inventory, a change request no longer depends on guesses. You plan a migration by moving objects, you find the single-homed rack before the maintenance window, and you can send a remote-hands technician a picture of the exact panel and port. 3D rack visualization and data center visualization are useful for a practical reason: they get what the database knows to the person standing in the aisle.
Danbyte is open source and includes all of this. You can self-host it on your own hardware. The features list covers the rest of the product, and the docs explain how floor plans and 3D racks fit with the rest of your inventory.
The plan only shows what you have recorded, so the work is in drawing the room once and placing the racks on it. After that you do not have to keep the layout in your head.