
Not just what is down. When, for how long, and who answered.
Checks attach to the addresses already in the inventory, so monitoring inherits what you have documented instead of asking for a second copy of it. Every status change is kept, and the strip that draws them turns up wherever an address appears.
Checks against the things you already documented
A check targets an address, and the address already knows its device, its site and its role, so a check inherits all of it. Policies attach checks by scope rather than one at a time, which is what keeps a few thousand of them maintainable.
Eight types: ICMP, TCP, HTTP, SSH, DNS, TLS certificate, SNMP and an exec check for whatever is not covered.
A history you can hover and click
Wherever an address, a device or a check appears there is a thin bar drawn over a window to scale: one block per stretch of unchanged status, its width the share of the window it covered. An outage two days ago is a red block two days back. Grey is time with nothing measured.
Click a block and you get the exact from and to, the change that opened it with the checker's own detail, and every alert that was open while it lasted. Because the strip is drawn on time rather than on samples, a five-minute check and a one-second one look the same.
One record, every view of it
The strip, the availability figure, the daily bars and the history table are all cut from the same status changes, so they cannot disagree with each other.
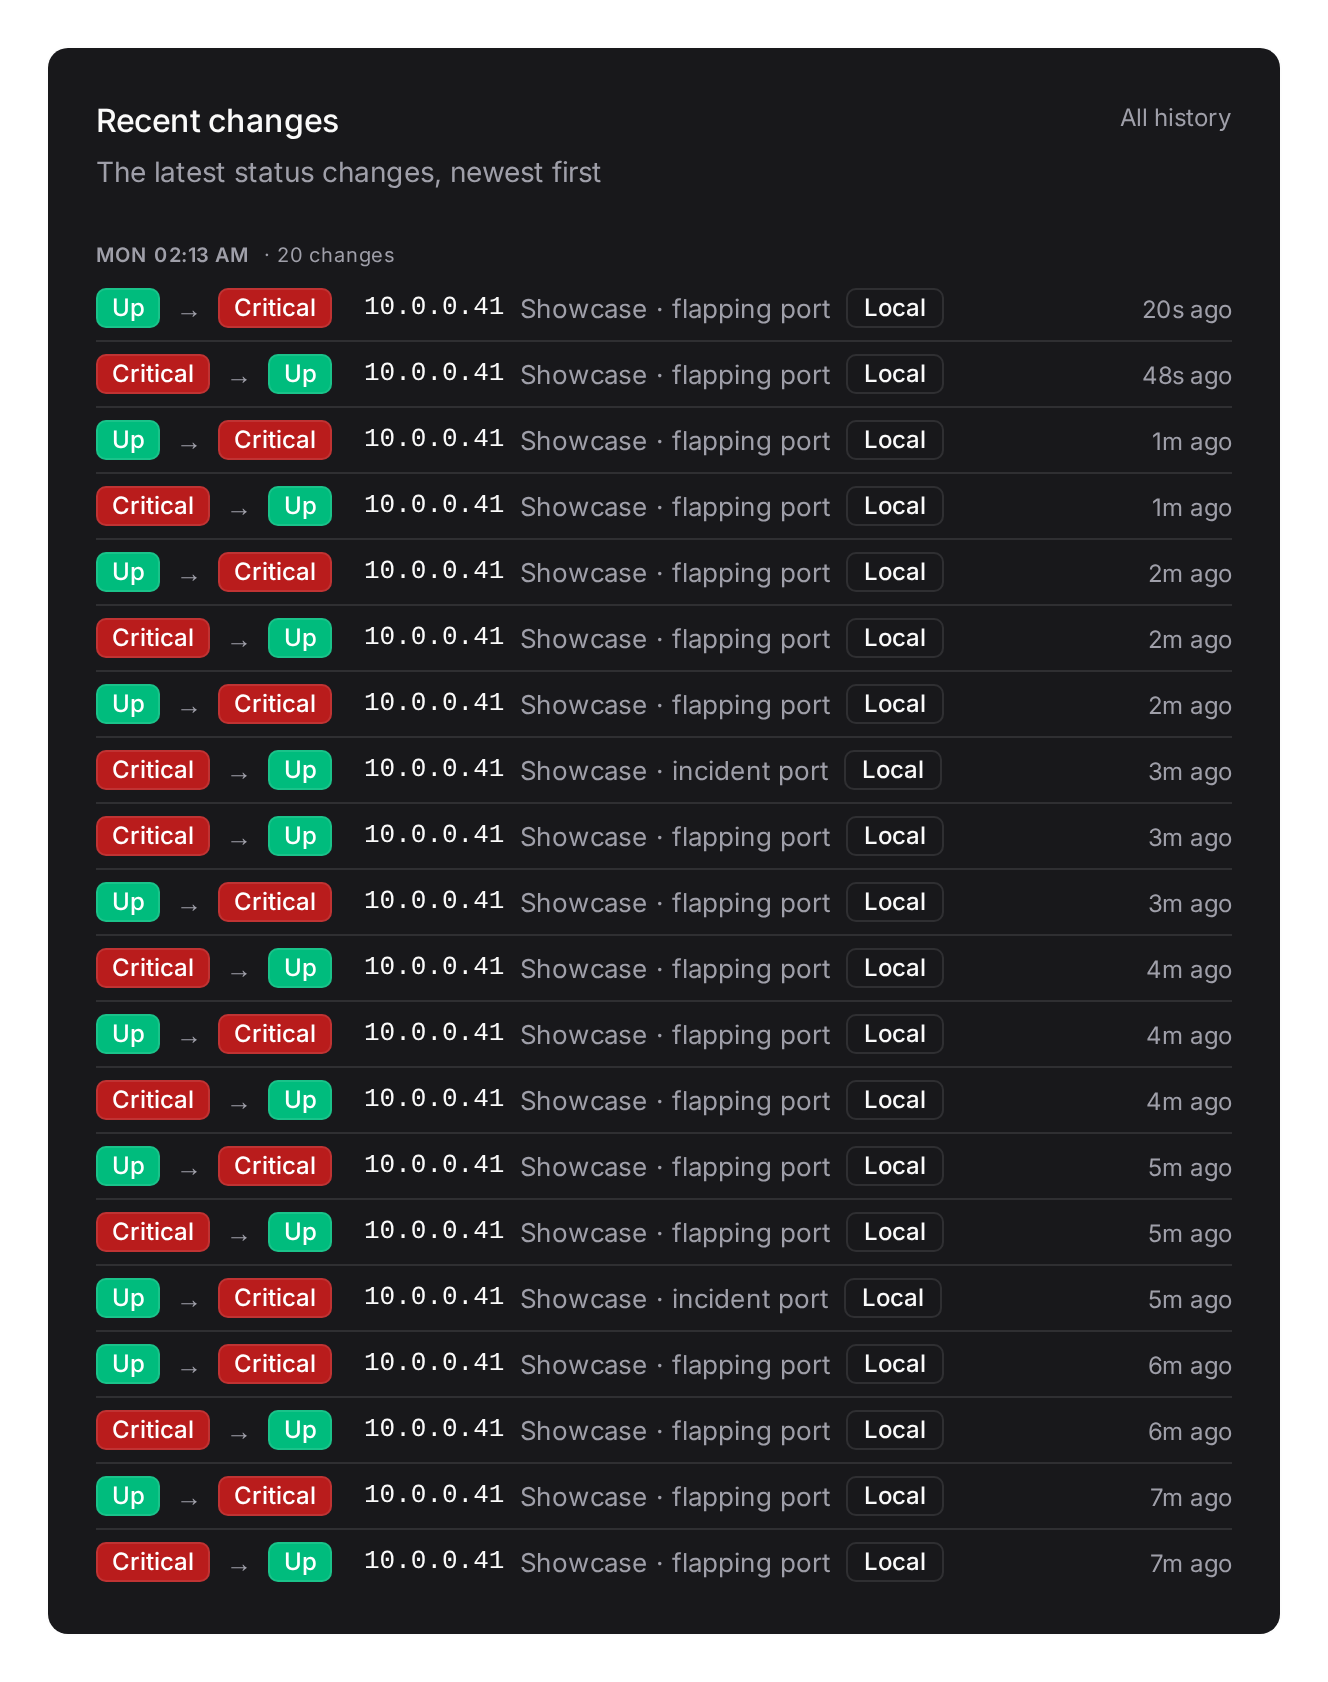

The whole estate's changes, in one place
The History tab lists every status change in the tenant, with the same filter rail the Checks list has and a chart of changes per hour or per day. Everything is in the address, so a filtered view is a link you can paste into a ticket.
The weekday-by-hour grid shows patterns a table hides. A column lit on every row is a scheduled job; a single lit row is one bad day; a 03:00 column is a backup window.
The fast lane, without filling the database
A second lane runs the checks that matter every 200 ms to 30 s. It keeps its schedule in memory and writes a window aggregate rather than a row per probe, so sub-second checking does not turn into a storage problem.
A check on the fast lane carries a Fast badge, and its results record the samples, the loss and the minimum, average and maximum for the window.
Flapping is a state, not a feeling
A check that keeps changing its mind is flagged as flapping and stays flagged until a person confirms it is settled. That turns the noisiest thing in monitoring into a small list someone works through, rather than an alert storm everyone learns to ignore.
An existing Zabbix, as an engine
If Zabbix already watches the estate, it can answer for a device, a rack or a whole site through an ordinary Danbyte check. Alert rules, silences, history and the strips all work over it unchanged, because it is the same check object with a different engine behind it.
Every result and status change records who answered: Local for Danbyte's own workers, an Outpost by name, or Zabbix. When three things watch the same estate, that is the first question in an incident.
Latency, results and alerts over time
The Overview carries the estate's median and 95th percentile latency per bucket, which is the pair worth having: the median says how the network feels, the 95th says who is suffering. Alongside it, check outcomes per hour and alerts opened against resolved per day, the chart that answers whether you are keeping up.
Air-gapped and behind other people's firewalls
An Outpost is a small agent that runs checks where Danbyte cannot reach: a customer site, a management VLAN, a network with no inbound route. It polls for work and posts results back, so nothing has to be opened towards it.
Nothing here needs the internet. A fully air-gapped install monitors, alerts and reports exactly as a connected one does.
Questions
- Does this replace Zabbix or Prometheus?
- It can, for reachability and certificate checking against the inventory. Where Zabbix is already in place it is usually better to keep it and let it answer through Danbyte, so the inventory and the monitoring agree without a second copy of the estate.
- How much does the fast lane store?
- One row per recording window rather than one per probe. A 200 ms check that records every 30 seconds writes two rows a minute, carrying the samples, loss and min/avg/max for the window.
- How long is history kept?
- Status changes for a year and raw results for thirty days by default, both configurable. Since 0.17 the rolled-up history outlives the raw results: hourly for thirty days, daily indefinitely.
In the documentation
See it with real data.
The live demo is a private instance with a populated estate, yours for thirty minutes. Or install it yourself in a few minutes.