
The drawing stops being a separate thing you forget to update.
Every map here is rendered from the inventory. Arrange it, colour it, hide what you do not want, then hand it to a contractor as a PDF or an editable draw.io file that still matches what you run.
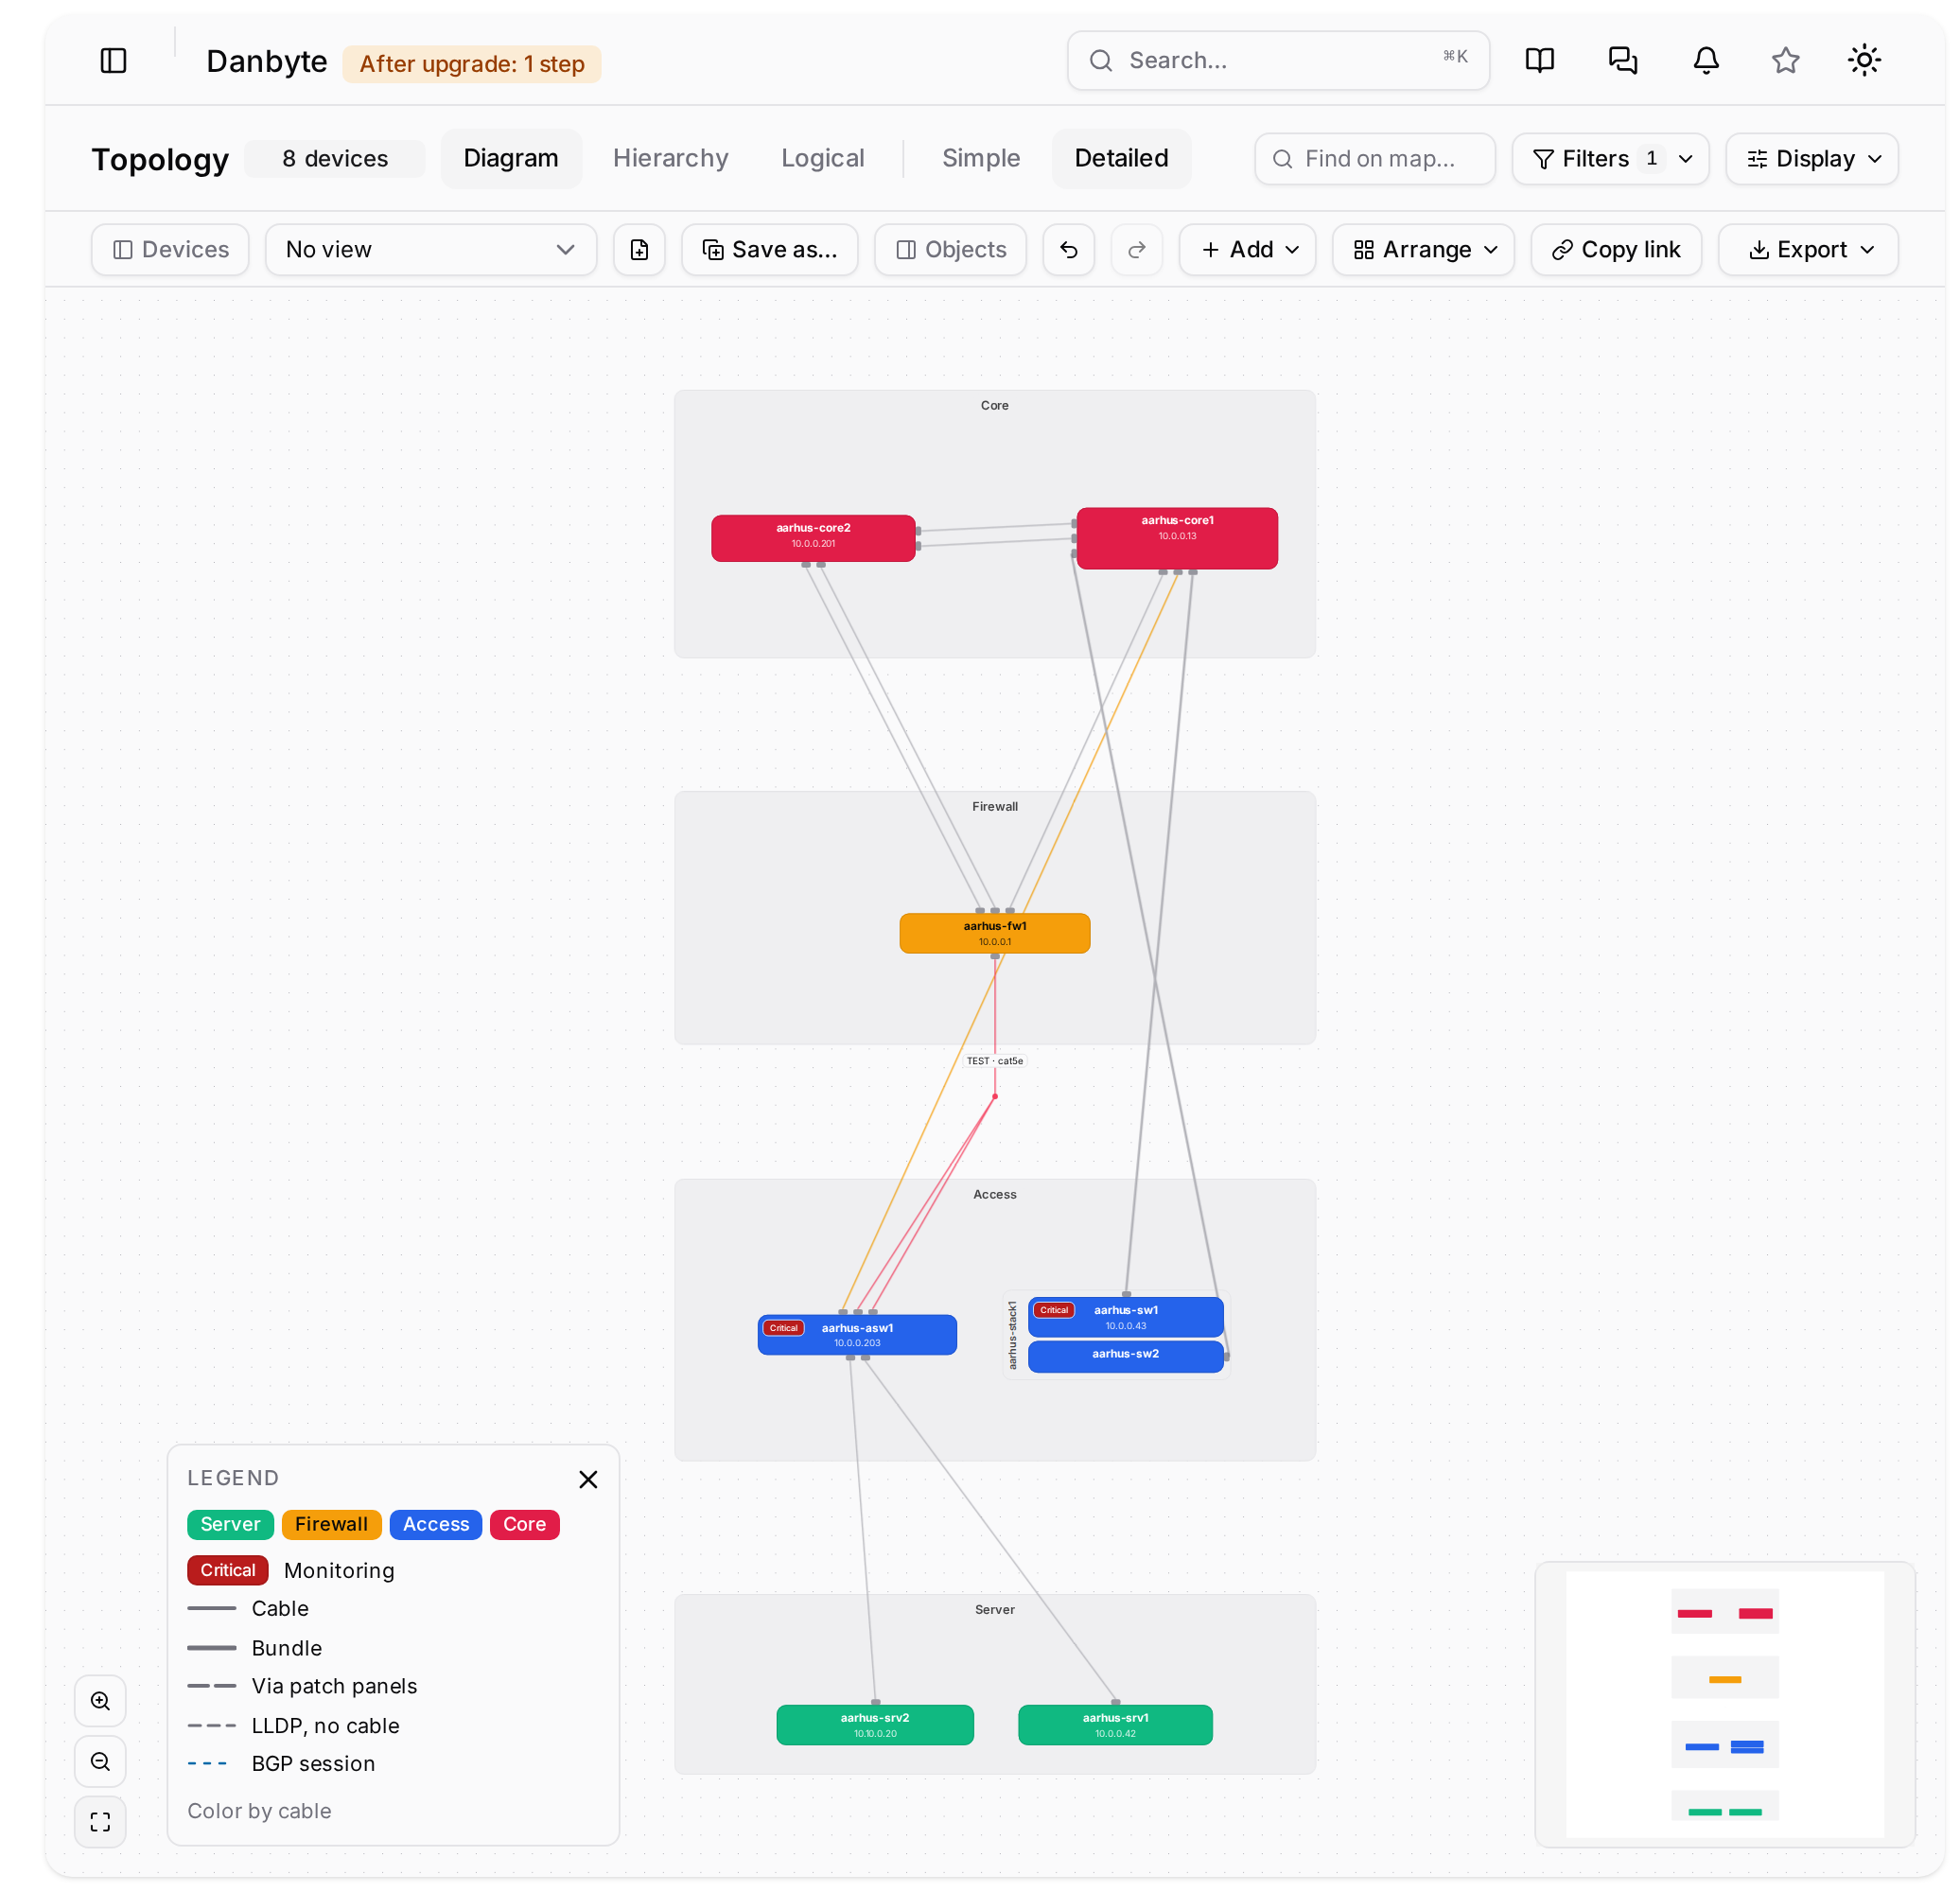
One card per device, in its role's colour
A card takes its role's colour with black or white text, whichever reads, and carries a pill for monitoring or lifecycle state plus a few lines you choose: the address, a loopback, a serial, a custom field. Set them for all devices, per role, per saved view or per device.
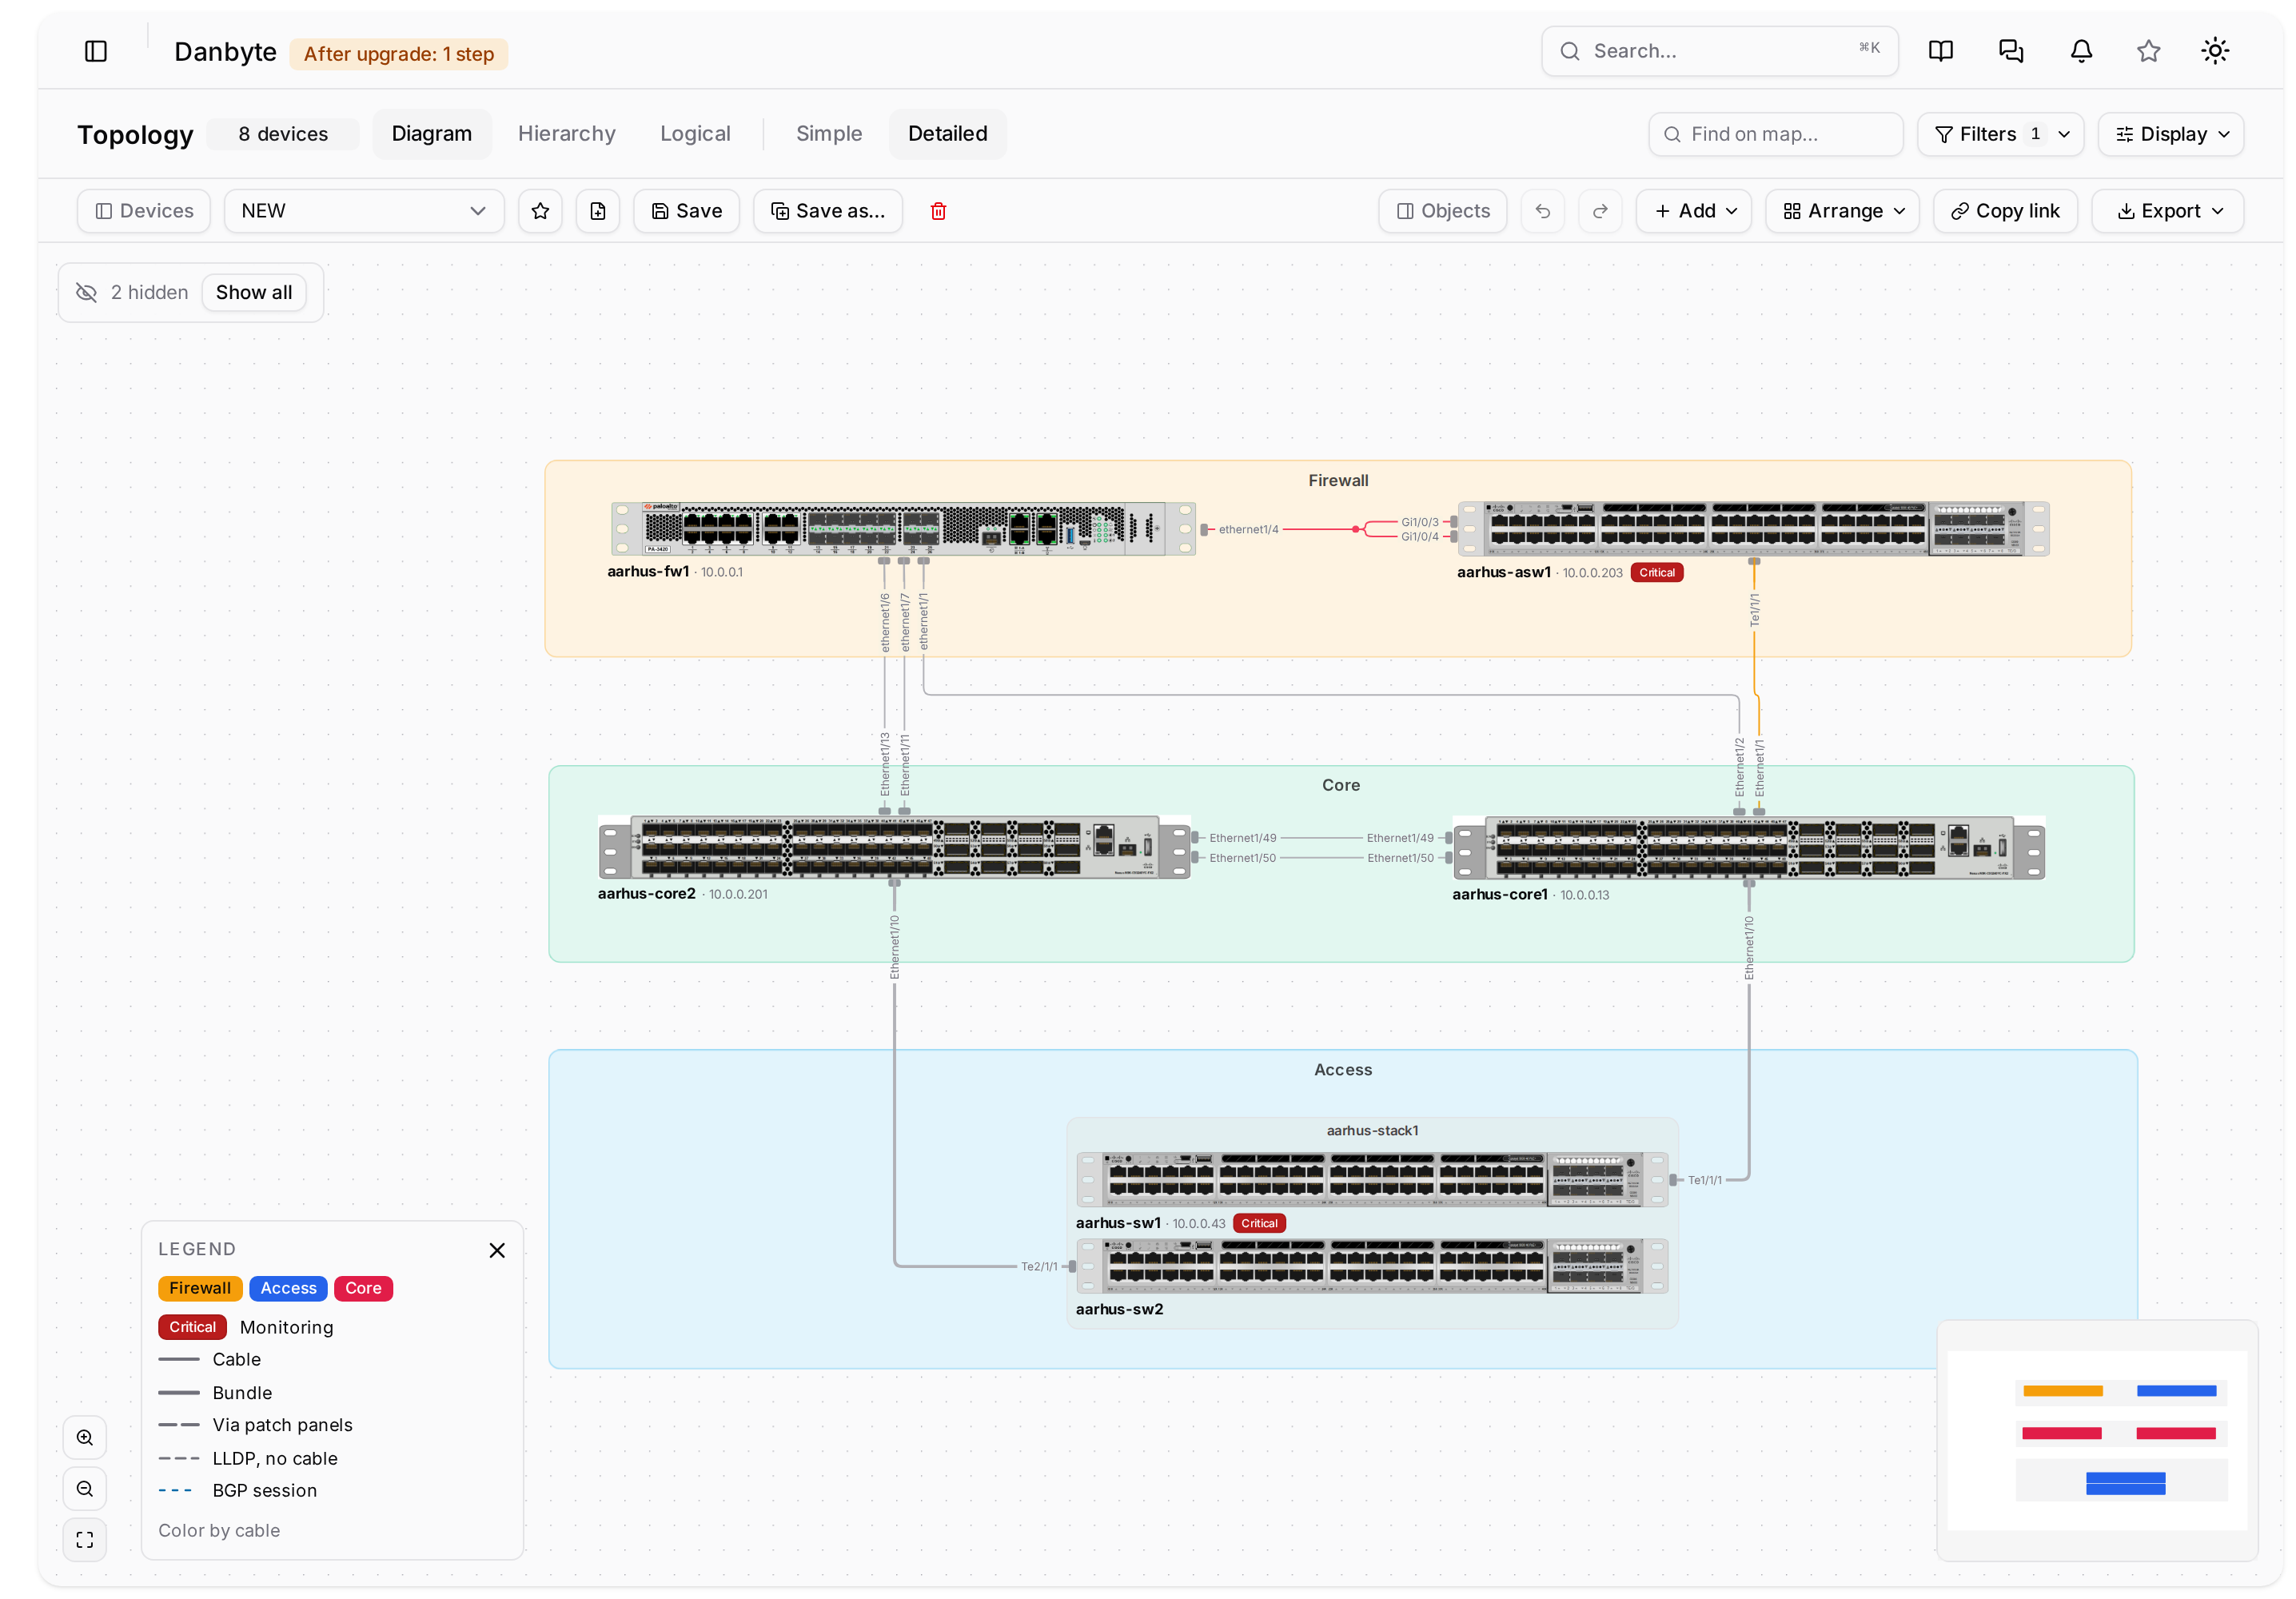
Detailed gives every cabled interface its own nub and cable with the port name on it. Simple draws one line per device pair with a count chip. Cards are placed by their centre, so an arrangement survives the switch between them.
Something you can actually hand over
Export writes a PNG at 2x, an SVG where each card and cable links back into Danbyte, a PDF on A4 to Tabloid with a title block naming the view, tenant, filters, date and version, or an editable draw.io file.
It is drawn from the map's data rather than captured from the screen, so cards that were off-screen are still in the file.
Arranged once, understood by everyone
Bands stack the map into titled layers in one undoable step. Cards can be drawn as their real photographs, with each cable landing on the port it actually uses.
The geographic view
Sites on a real map, with the circuits, tunnels and cables between them. Lines can be coloured by type, status, speed or utilisation: speed from the circuit's commit rate or the cabled ports, utilisation from the last two SNMP counter samples at each end, split at the midpoint so each half shows the traffic leaving that end.
Unknown is left blank rather than guessed, and a link without two recent samples reads *No data*.
The building's own drawing, under the grid
A floor plan takes a DXF, or a DWG converted on the server, at true scale: the drawing's units line up with the grid's cell size, so a 600 mm floor tile in the drawing is one 600 mm cell and a rack lands on the tile it will actually stand on.
A unitless drawing is calibrated by clicking two points and typing the distance. The file's own layers are listed with their colours and shape counts, each with a tick, and hidden layers apply in 2D, in 3D and in exports.
Floor plans that carry capacity
Colour the plan by space, power, ports, panel ports, rack role or status, in 2D and in the 3D room. One scale throughout: green to the warning level, amber above, red above critical, grey where there is nothing to measure, with the figure written on the tile so nothing rests on colour alone.
Coloured by racks, a sortable rack table opens under the plan. Pointing at a row rings its rack; clicking zooms to it.
On paper, in vector
A floor plan exports as a PDF with the drawing in vector rather than a picture of the screen, fitted to A4, A3, Letter or Tabloid, with a scale bar, the ratio, the colour legend, the source file and a title block.
A site's capacity, added up
A site's Capacity tab adds its racks up floor plan by floor plan: racks, devices, space, power, ports and panel ports, with the racks that are on no floor plan kept apart so they are not quietly forgotten.
Questions
- Which CAD formats work?
- DXF, and DWG where the server has the converter, which the release bundle ships. Model space only: xrefs, raster images, PDF and DGN underlays, OLE objects and paper-space layouts are skipped and counted so you can see what was left out.
- Can I edit the exported diagram?
- Yes. The draw.io export is an editable file, not a picture, and the SVG keeps a link back to each card and cable in Danbyte.
- Does the topology lay itself out?
- It does, from the cabling, and then you arrange it. Bands stack it into titled layers in one undoable step, and a saved view keeps your arrangement with undo, redo and a prompt before you leave unsaved edits.
In the documentation
See it with real data.
The live demo is a private instance with a populated estate, yours for thirty minutes. Or install it yourself in a few minutes.